| Param | Original file | Final file |
|---|---|---|
| Filename | modeM0/AS1G07_069T01_9000001356_09553cztM0_level2.evt | modeM0/AS1G07_069T01_9000001356_09553cztM0_level2_quad_clean.evt |
| Size (bytes) | 494,637,120 | 112,982,400 |
| Size | 471.7 MB | 107.7 MB |
| Events in quadrant A | 3,421,104 | 755,302 |
| Events in quadrant B | 3,585,802 | 748,740 |
| Events in quadrant C | 3,245,399 | 745,286 |
| Events in quadrant D | 4,289,328 | 721,975 |
| Mode SS | |||
|---|---|---|---|
| Quadrant | BADHDUFLAG | Total packets | Discarded packets |
| A | 0 | 132 | 0 |
| B | 0 | 132 | 0 |
| C | 0 | 132 | 0 |
| D | 0 | 132 | 0 |
| Mode M9 | |||
|---|---|---|---|
| Quadrant | BADHDUFLAG | Total packets | Discarded packets |
| A | 0 | 20 | 0 |
| B | 0 | 20 | 0 |
| C | 0 | 20 | 0 |
| D | 0 | 21 | 0 |
| Mode M0 | |||
|---|---|---|---|
| Quadrant | BADHDUFLAG | Total packets | Discarded packets |
| A | 0 | 14161 | 3 |
| B | 0 | 14799 | 2 |
| C | 0 | 13581 | 2 |
| D | 0 | 17248 | 2 |
| Quadrant | Total seconds | Saturated seconds | Saturation percentage |
|---|---|---|---|
| A | 6458 | 120 | 1.858160% |
| B | 6458 | 149 | 2.307216% |
| C | 6458 | 91 | 1.409105% |
| D | 6458 | 143 | 2.214308% |
Noise dominated data is calculated using 1-second bins in cleaned event files. If a bin has >2000 counts, and if more than 50% of those come from <1% of pixels, then it is considered to be noise-dominated and hence unusable.
| Quadrant | # 1 sec bins | Bins with >0 counts | Bins with >2000 counts | High rate bins dominated by noise | Noise dominated (total time) | Noise dominated (detector-on time) | Marked lightcurve |
|---|---|---|---|---|---|---|---|
| A | 7784 | 6459 | 0 | 0 | 0.00% | 0.00% | 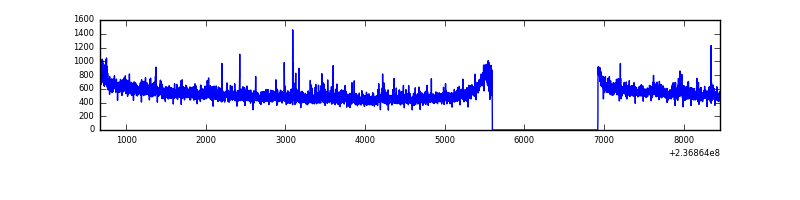 |
| B | 7784 | 6459 | 17 | 17 | 0.22% | 0.26% | 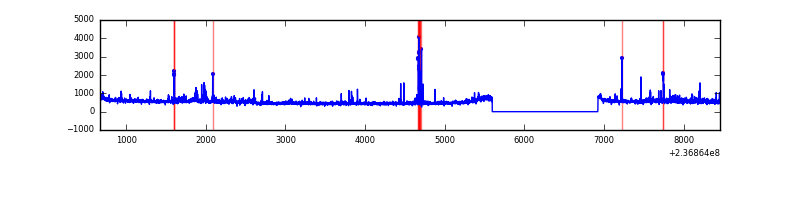 |
| C | 7784 | 6459 | 7 | 7 | 0.09% | 0.11% | 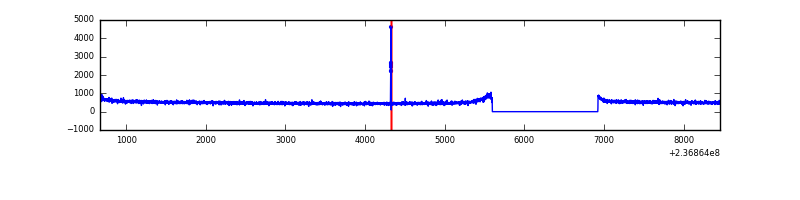 |
| D | 7784 | 6459 | 28 | 28 | 0.36% | 0.43% | 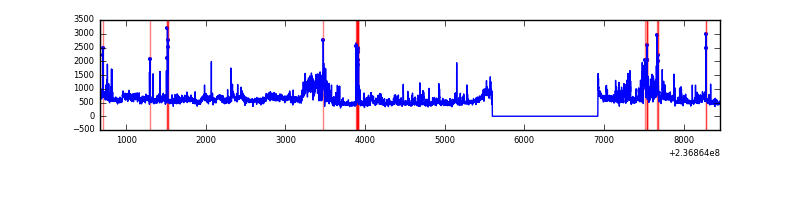 |
Top three noisy pixels from each quadrant. If the there are fewer than three noisy pixels in the level2.evt file, extra rows are filled as -1
| Pixel properties | Quadrant properties | ||||||
|---|---|---|---|---|---|---|---|
| Quadrant | DetID | PixID | Counts | Sigma | Mean | Median | Sigma |
| A | 1 | 162 | 73921 | 428.34 | 853 | 833 | 170.6 |
| A | 1 | 178 | 21328 | 120.11 | 853 | 833 | 170.6 |
| A | 1 | 161 | 21240 | 119.6 | 853 | 833 | 170.6 |
| B | 4 | 80 | 115575 | 737.4 | 839 | 821 | 155.6 |
| B | 0 | 214 | 100633 | 641.38 | 839 | 821 | 155.6 |
| B | 10 | 252 | 58878 | 373.07 | 839 | 821 | 155.6 |
| C | 14 | 234 | 21916 | 113.03 | 825 | 832 | 186.5 |
| C | 13 | 61 | 6092 | 28.2 | 825 | 832 | 186.5 |
| C | 9 | 68 | 5367 | 24.31 | 825 | 832 | 186.5 |
| D | 12 | 227 | 426947 | 2098.53 | 826 | 808 | 203.1 |
| D | 1 | 52 | 262594 | 1289.17 | 826 | 808 | 203.1 |
| D | 7 | 71 | 223015 | 1094.26 | 826 | 808 | 203.1 |
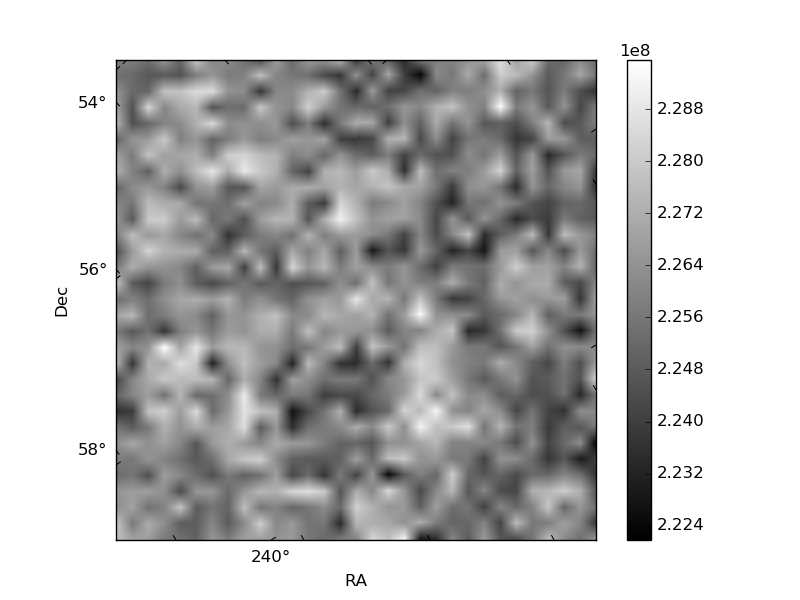
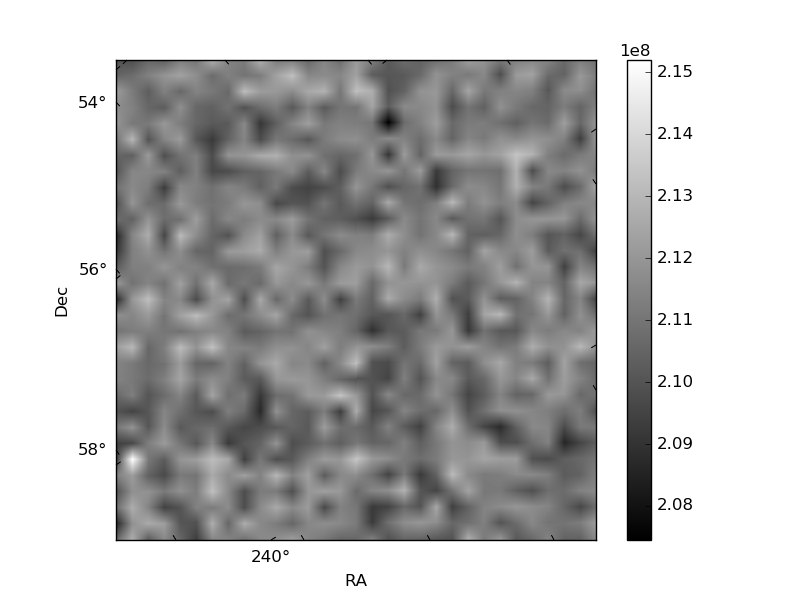
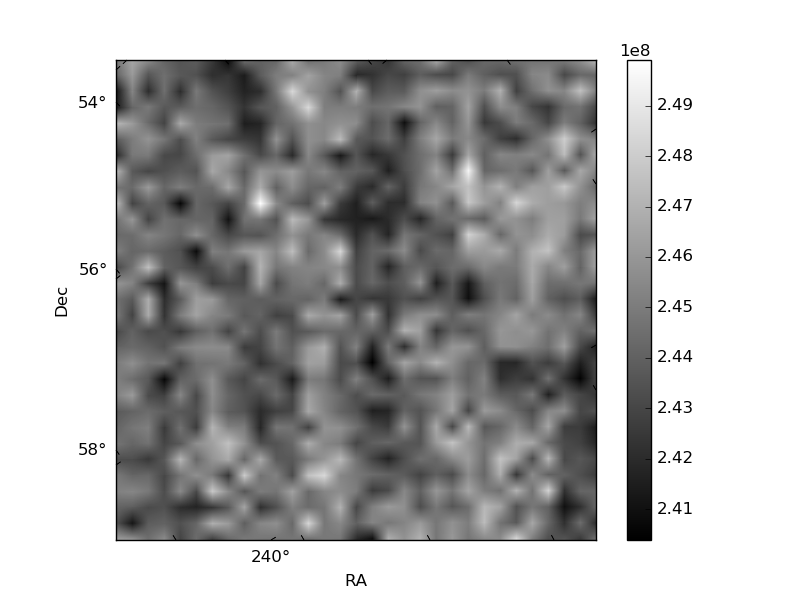
Histogram calculated using DETX and DETY for each event in the final _common_clean file
| Quadrant A | 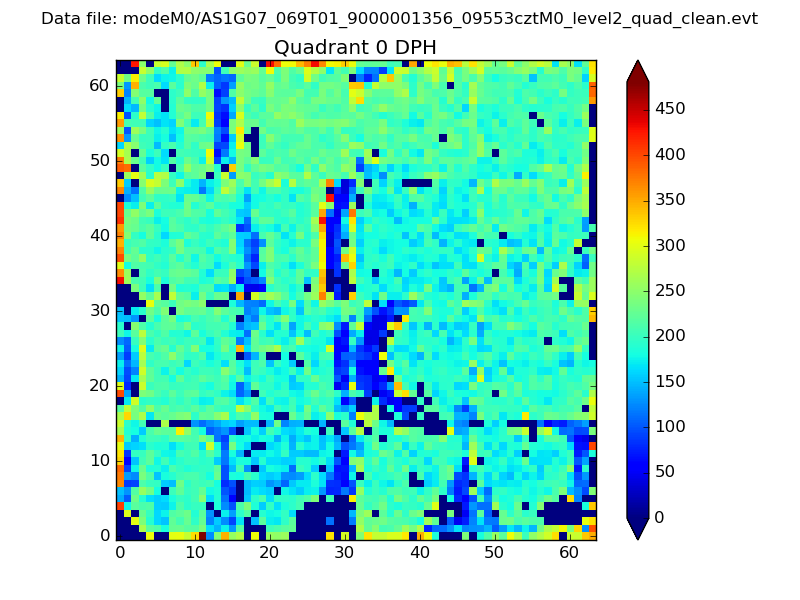 |
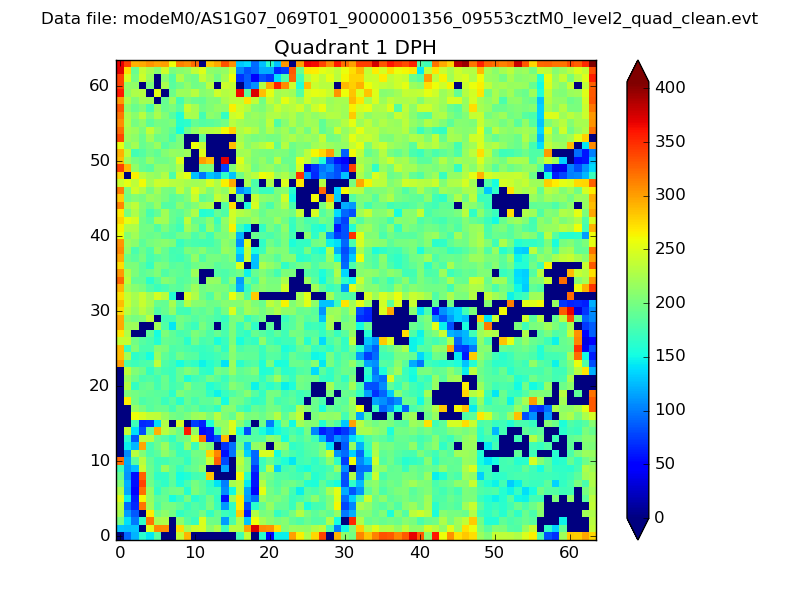 |
Quadrant B |
|---|---|---|---|
| Quadrant D | 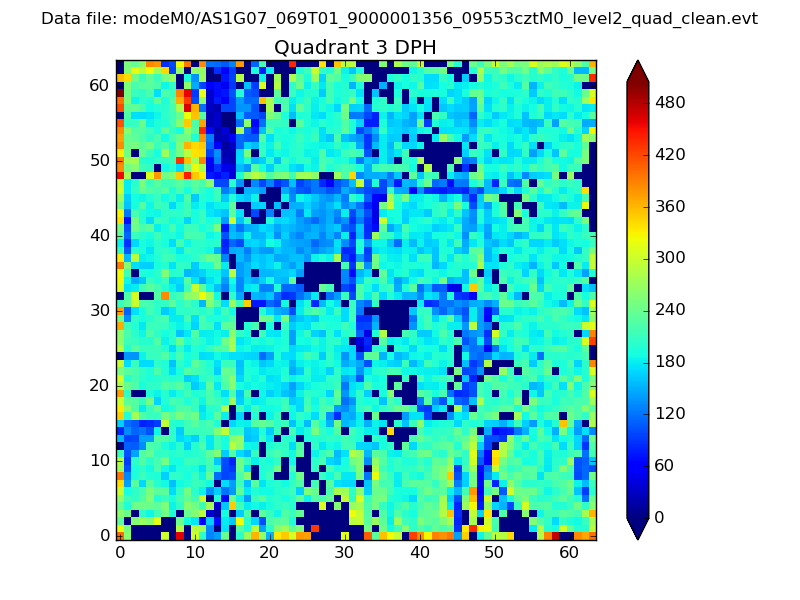 |
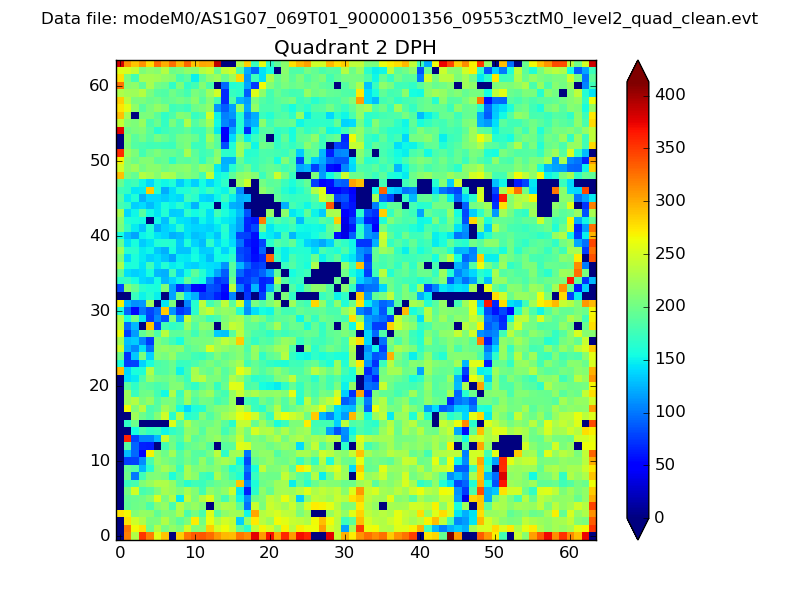 |
Quadrant C |
| Plot type | Count rate plots | Images |
|---|---|---|
| Comparison with Poisson distribution Blue bars denote a histogram of data divided into 1 sec bins. Red curve is a Poisson curve with rate = median count rate of data. |
 |
 |
| Quadrant-wise count rates Data is divided into 100 sec bins |
 |
|
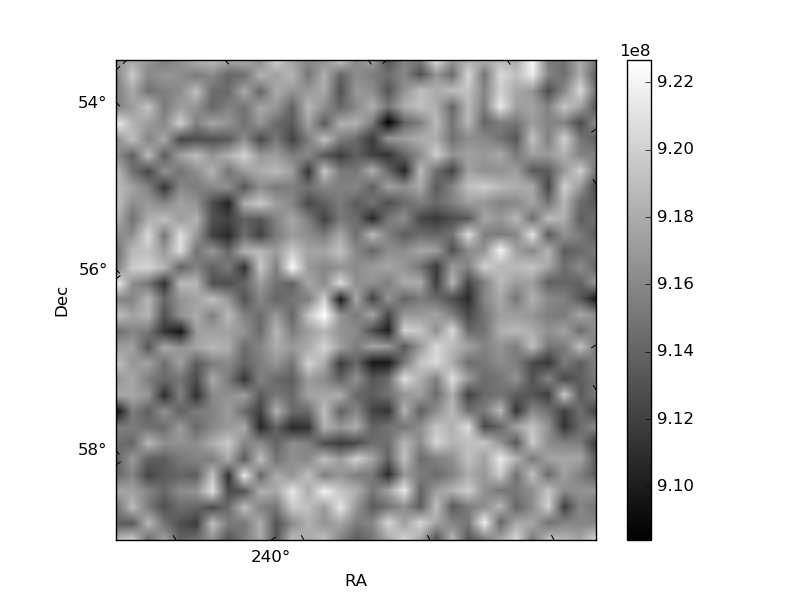
| Module-wise count rates for Quadrant A Data is divided into 100 sec bins |
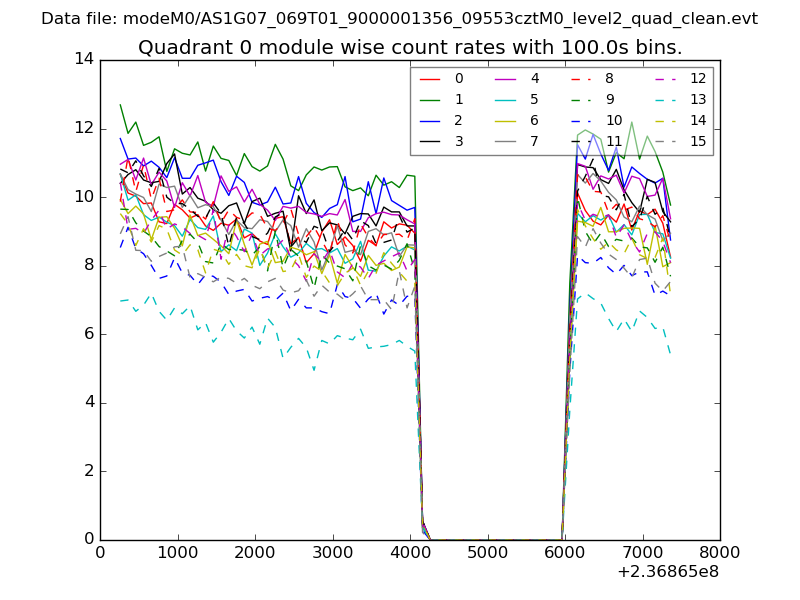 |
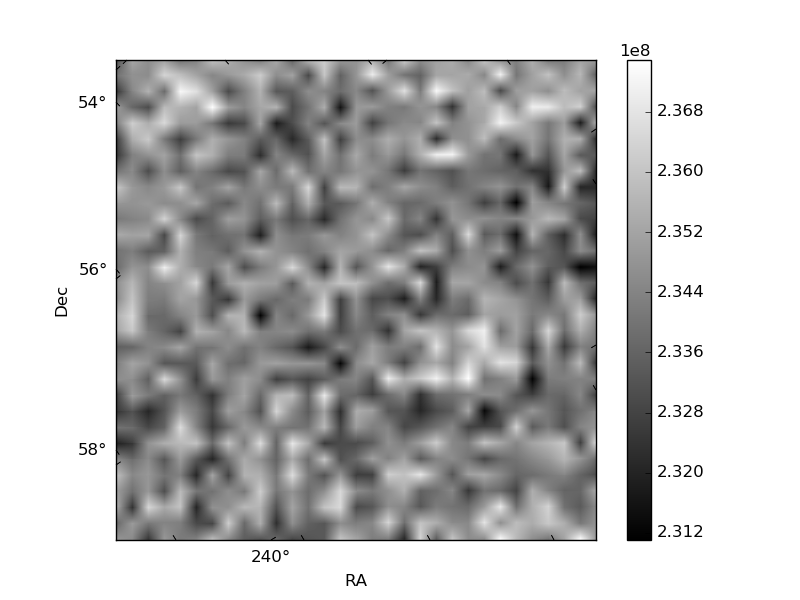 |
| Module-wise count rates for Quadrant B Data is divided into 100 sec bins |
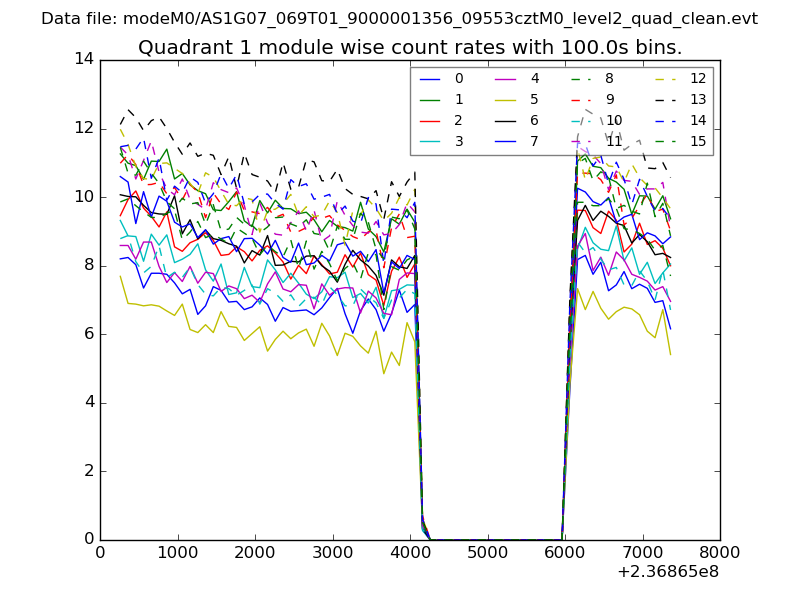 |
 |
| Module-wise count rates for Quadrant C Data is divided into 100 sec bins |
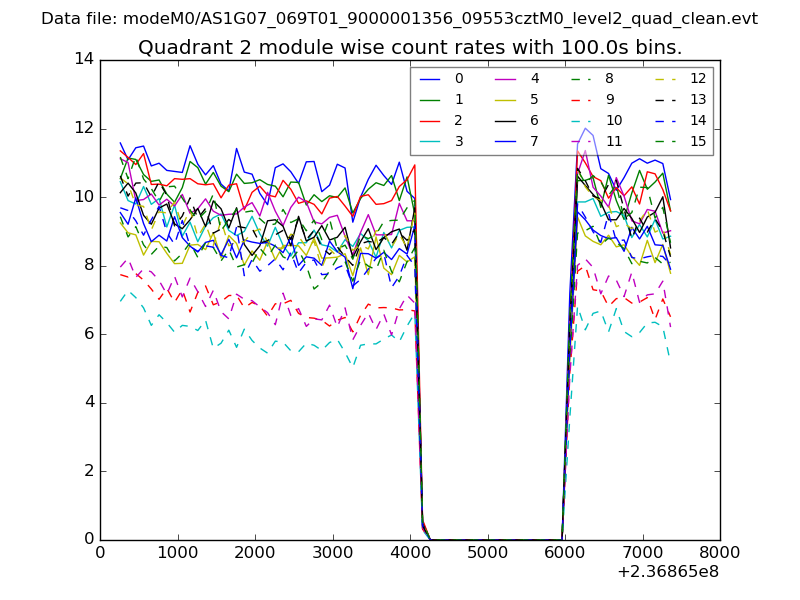 |
 |
| Module-wise count rates for Quadrant D Data is divided into 100 sec bins |
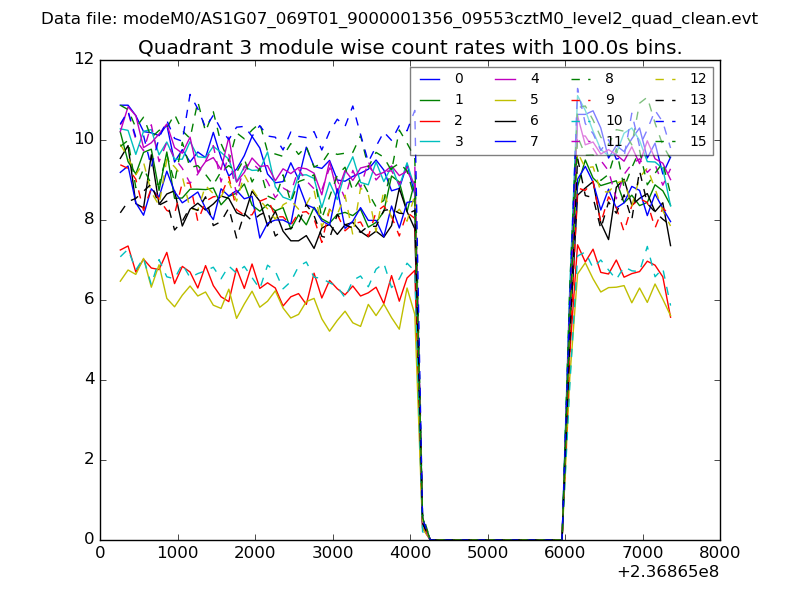 |
 |
| Parameter | Plot |
|---|---|
| CZT HV Monitor | 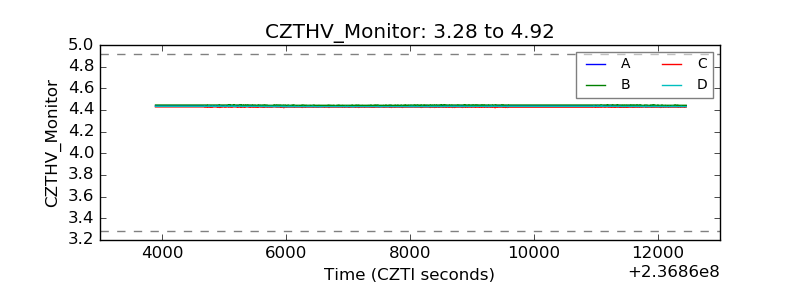 |
| D_VDD | 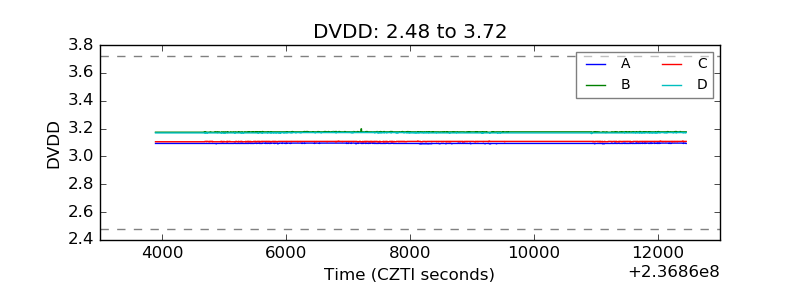 |
| Temperature 1 | 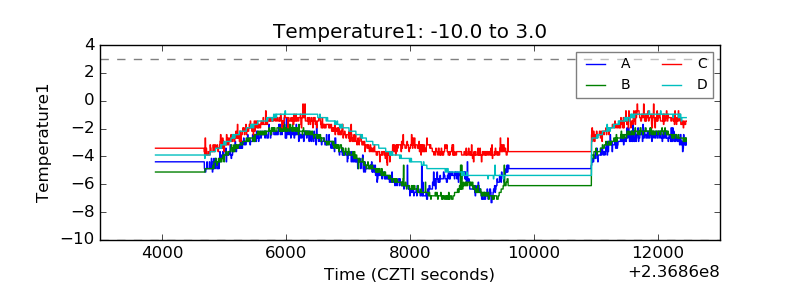 |
| Veto HV Monitor | 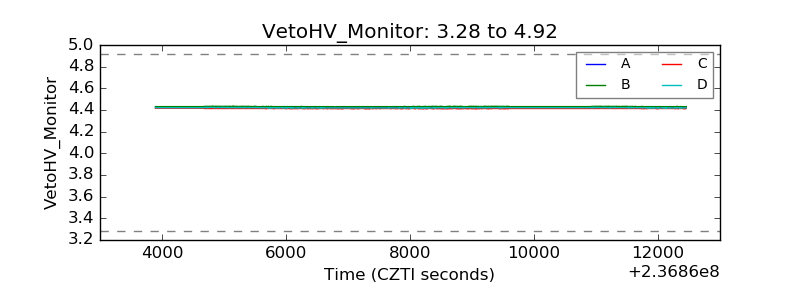 |
| Veto LLD | 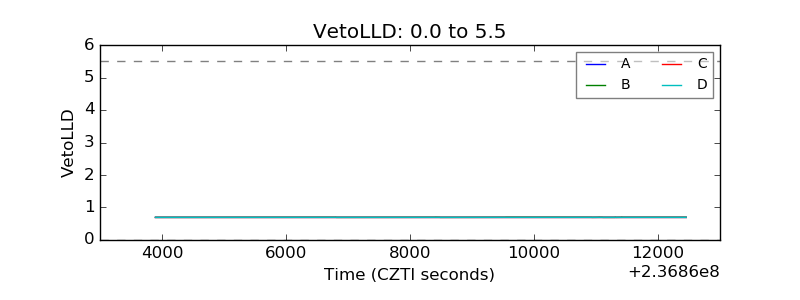 |
| Alpha Counter |  |
| _CPM_Rate | 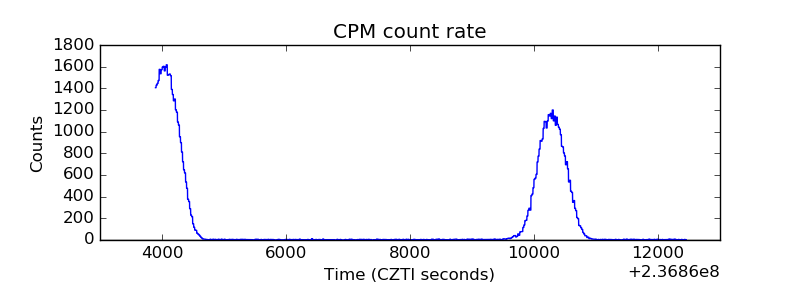 |
| CZT Counter | 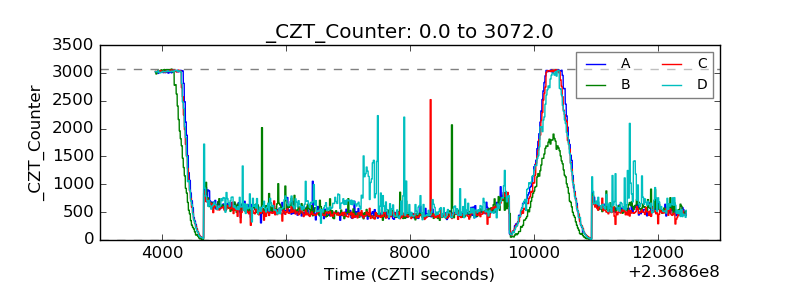 |
| +2.5 Volts monitor |  |
| +5 Volts monitor |  |
| _ROLL_ROT | 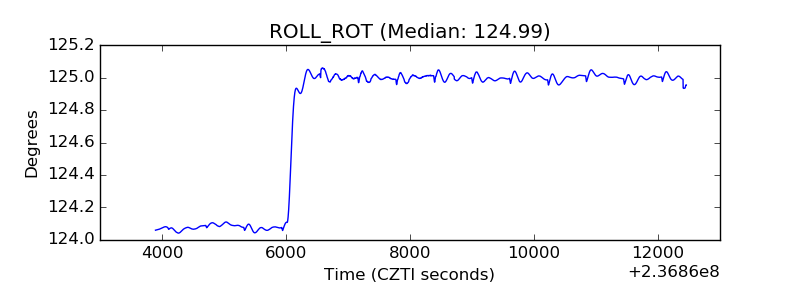 |
| _Roll_DEC | 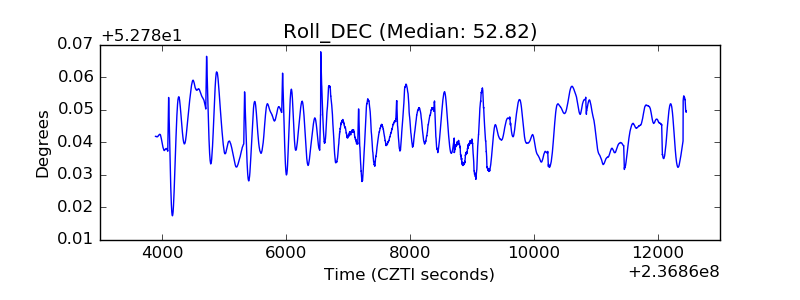 |
| _Roll_RA | 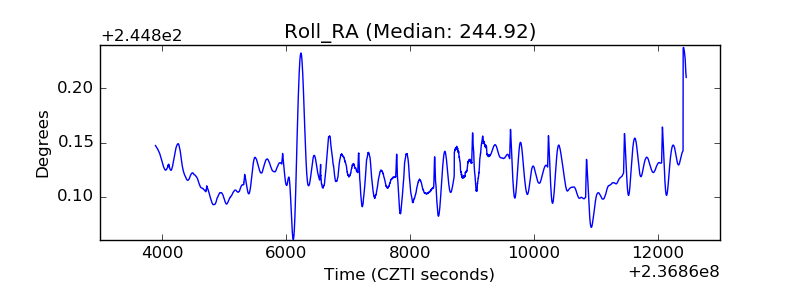 |
| Veto Counter | 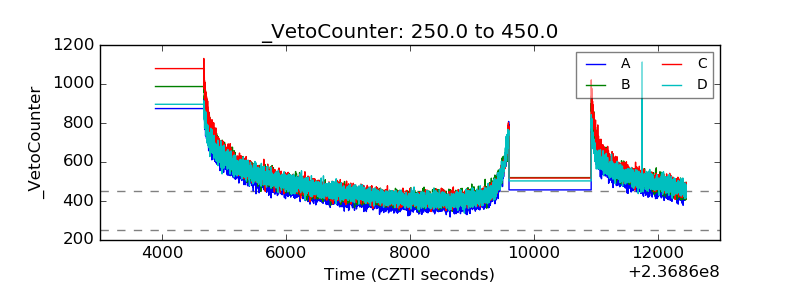 |