| Param | Original file | Final file |
|---|---|---|
| Filename | modeM0/AS1G07_069T01_9000001356_09554cztM0_level2.evt | modeM0/AS1G07_069T01_9000001356_09554cztM0_level2_quad_clean.evt |
| Size (bytes) | 455,932,800 | 107,521,920 |
| Size | 434.8 MB | 102.5 MB |
| Events in quadrant A | 3,104,494 | 720,376 |
| Events in quadrant B | 3,324,237 | 713,410 |
| Events in quadrant C | 2,923,242 | 713,229 |
| Events in quadrant D | 4,041,377 | 683,165 |
| Mode SS | |||
|---|---|---|---|
| Quadrant | BADHDUFLAG | Total packets | Discarded packets |
| A | 0 | 124 | 0 |
| B | 0 | 124 | 0 |
| C | 0 | 124 | 0 |
| D | 0 | 124 | 0 |
| Mode M9 | |||
|---|---|---|---|
| Quadrant | BADHDUFLAG | Total packets | Discarded packets |
| A | 0 | 12 | 0 |
| B | 0 | 12 | 0 |
| C | 0 | 12 | 0 |
| D | 0 | 12 | 0 |
| Mode M0 | |||
|---|---|---|---|
| Quadrant | BADHDUFLAG | Total packets | Discarded packets |
| A | 0 | 13130 | 2 |
| B | 0 | 13935 | 1 |
| C | 0 | 12572 | 1 |
| D | 0 | 16083 | 1 |
| Quadrant | Total seconds | Saturated seconds | Saturation percentage |
|---|---|---|---|
| A | 6105 | 90 | 1.474201% |
| B | 6105 | 100 | 1.638002% |
| C | 6105 | 55 | 0.900901% |
| D | 6105 | 187 | 3.063063% |
Noise dominated data is calculated using 1-second bins in cleaned event files. If a bin has >2000 counts, and if more than 50% of those come from <1% of pixels, then it is considered to be noise-dominated and hence unusable.
| Quadrant | # 1 sec bins | Bins with >0 counts | Bins with >2000 counts | High rate bins dominated by noise | Noise dominated (total time) | Noise dominated (detector-on time) | Marked lightcurve |
|---|---|---|---|---|---|---|---|
| A | 7340 | 6106 | 0 | 0 | 0.00% | 0.00% | 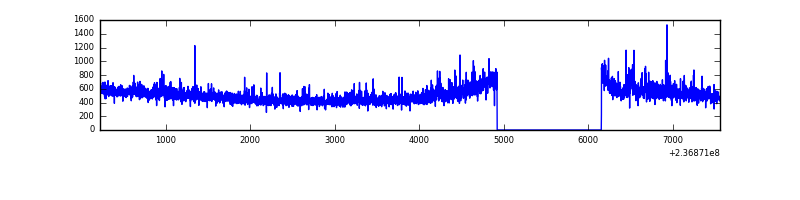 |
| B | 7340 | 6106 | 5 | 5 | 0.07% | 0.08% | 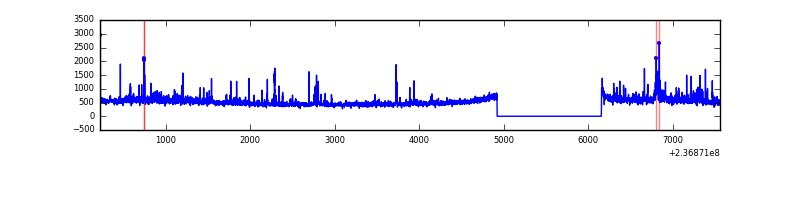 |
| C | 7340 | 6106 | 2 | 2 | 0.03% | 0.03% | 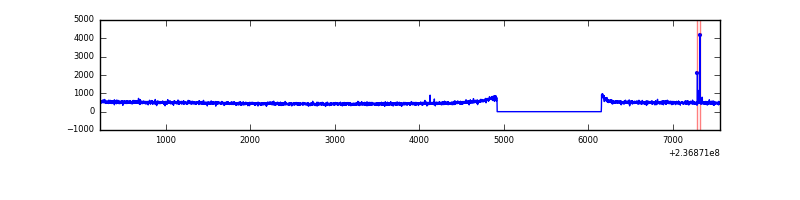 |
| D | 7340 | 6106 | 119 | 119 | 1.62% | 1.95% | 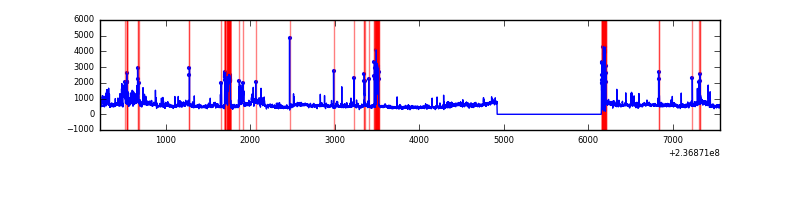 |
Top three noisy pixels from each quadrant. If the there are fewer than three noisy pixels in the level2.evt file, extra rows are filled as -1
| Pixel properties | Quadrant properties | ||||||
|---|---|---|---|---|---|---|---|
| Quadrant | DetID | PixID | Counts | Sigma | Mean | Median | Sigma |
| A | 1 | 162 | 85645 | 553.64 | 762 | 747 | 153.3 |
| A | 1 | 161 | 26640 | 168.86 | 762 | 747 | 153.3 |
| A | 1 | 178 | 26449 | 167.61 | 762 | 747 | 153.3 |
| B | 4 | 80 | 154439 | 1093.12 | 755 | 737 | 140.6 |
| B | 0 | 214 | 149182 | 1055.73 | 755 | 737 | 140.6 |
| B | 4 | 81 | 34492 | 240.06 | 755 | 737 | 140.6 |
| C | 14 | 234 | 15924 | 89.23 | 744 | 749 | 170.1 |
| C | 13 | 61 | 5492 | 27.89 | 744 | 749 | 170.1 |
| C | 9 | 68 | 3042 | 13.48 | 744 | 749 | 170.1 |
| D | 1 | 52 | 650732 | 3474.0 | 737 | 722 | 187.1 |
| D | 12 | 227 | 413152 | 2204.24 | 737 | 722 | 187.1 |
| D | 13 | 122 | 49979 | 263.26 | 737 | 722 | 187.1 |
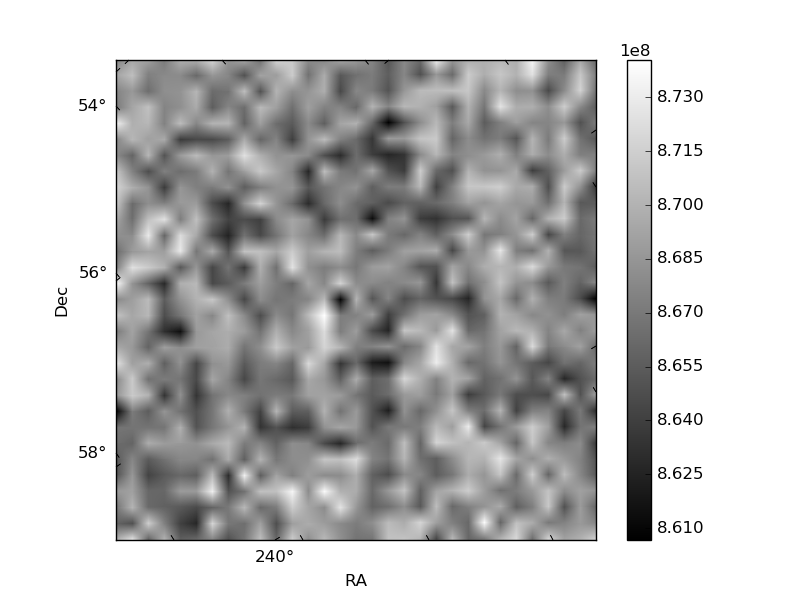
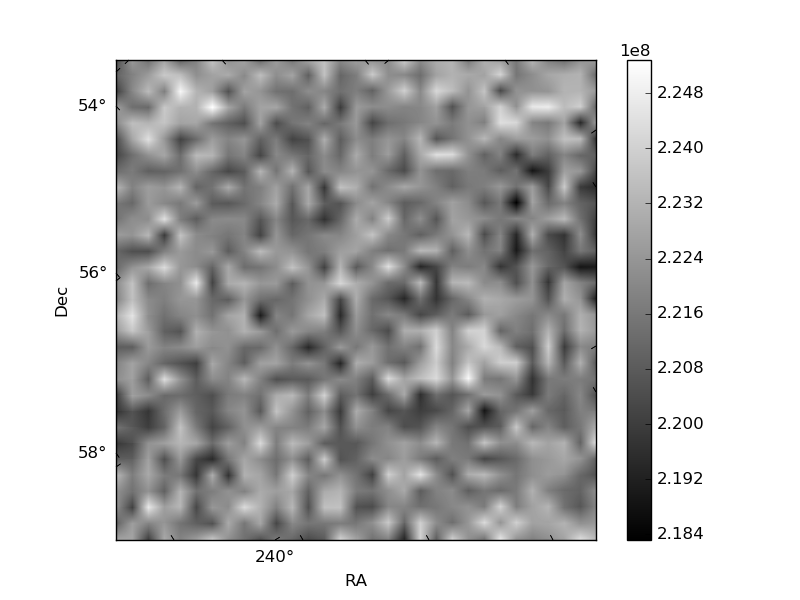
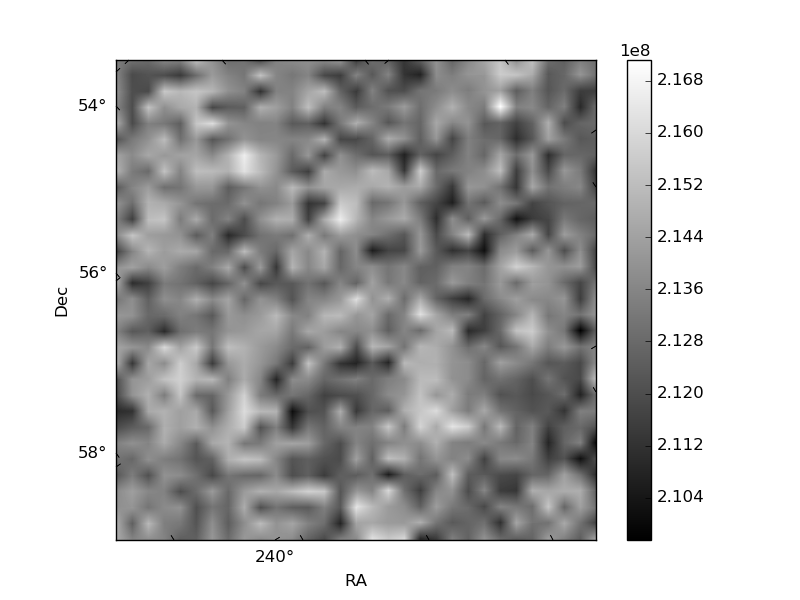
Histogram calculated using DETX and DETY for each event in the final _common_clean file
| Quadrant A | 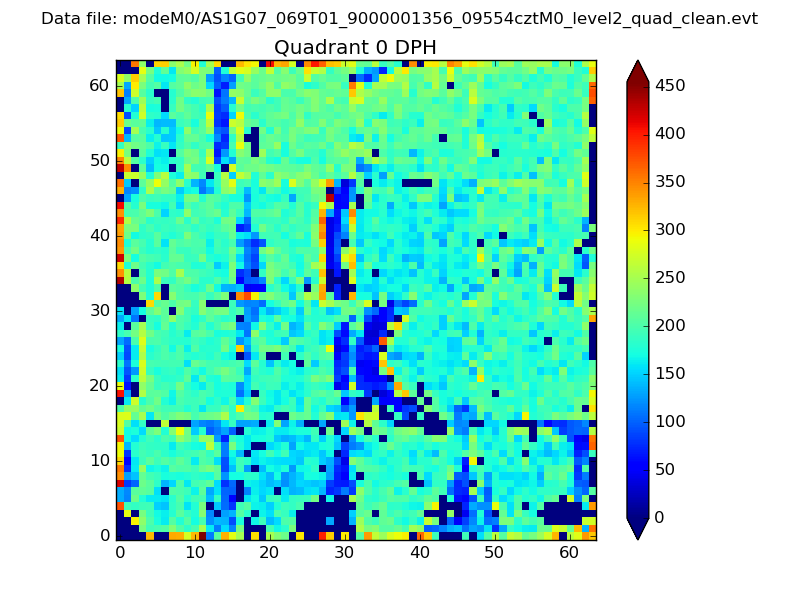 |
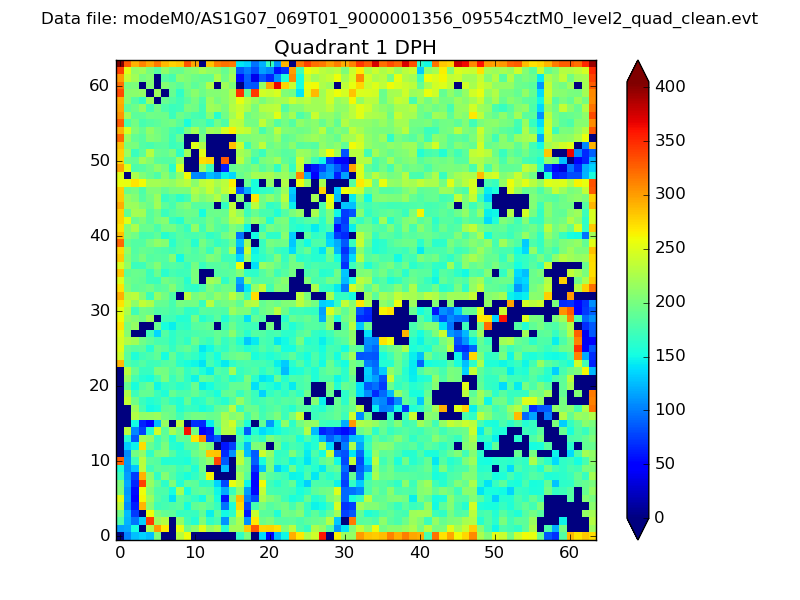 |
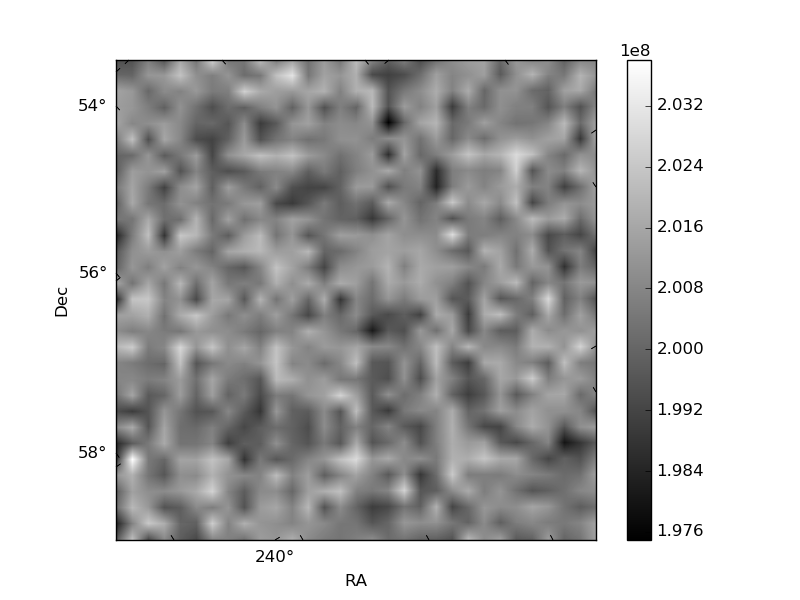
Quadrant B |
|---|---|---|---|
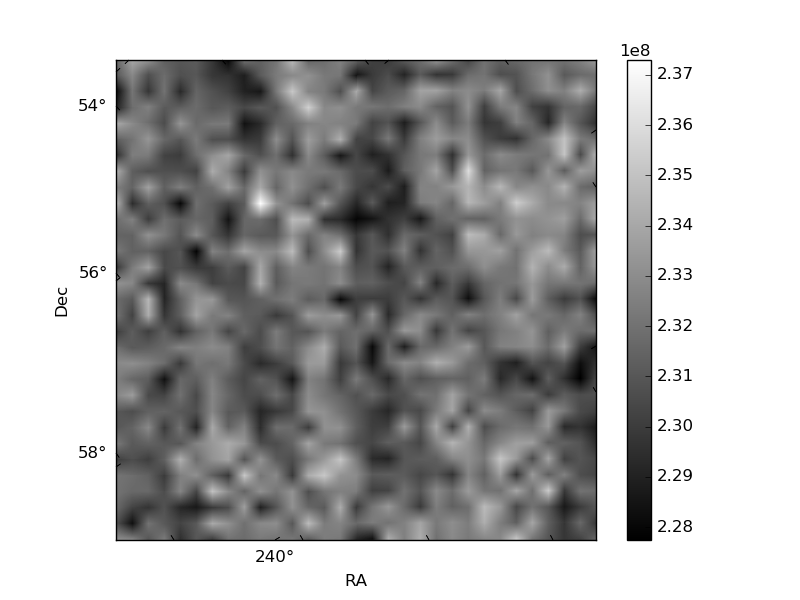
| Quadrant D | 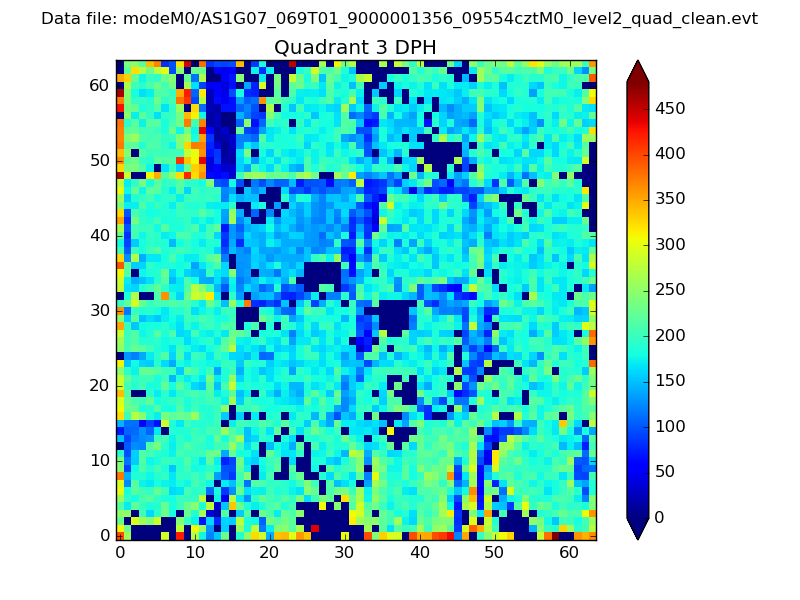 |
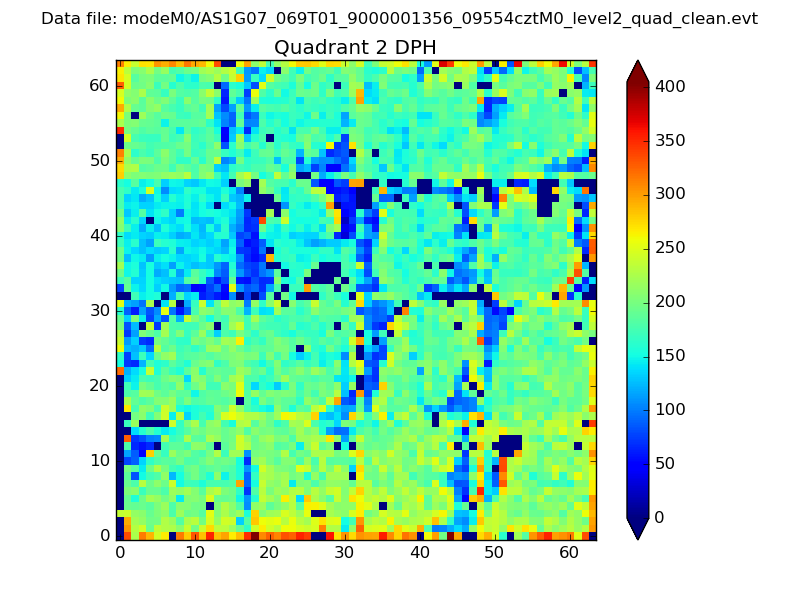 |
Quadrant C |
| Plot type | Count rate plots | Images |
|---|---|---|
| Comparison with Poisson distribution Blue bars denote a histogram of data divided into 1 sec bins. Red curve is a Poisson curve with rate = median count rate of data. |
 |
 |
| Quadrant-wise count rates Data is divided into 100 sec bins |
 |
|
| Module-wise count rates for Quadrant A Data is divided into 100 sec bins |
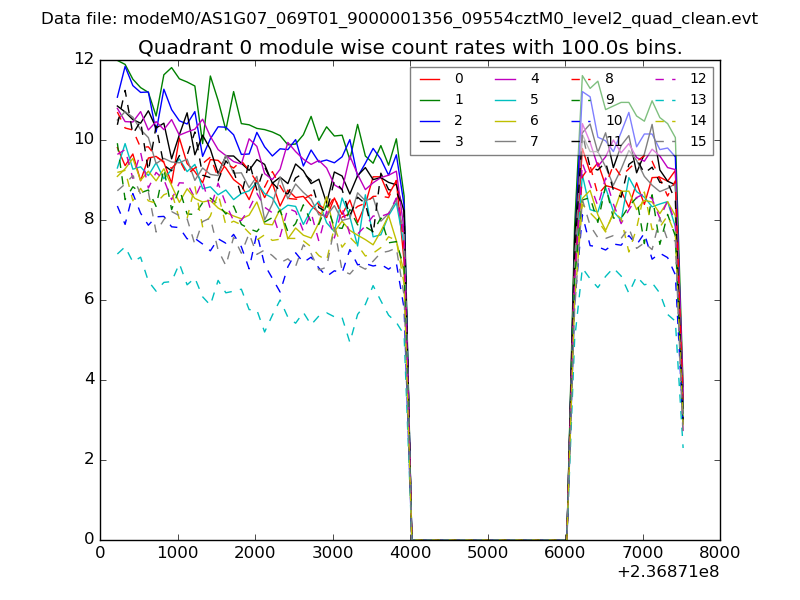 |
 |
| Module-wise count rates for Quadrant B Data is divided into 100 sec bins |
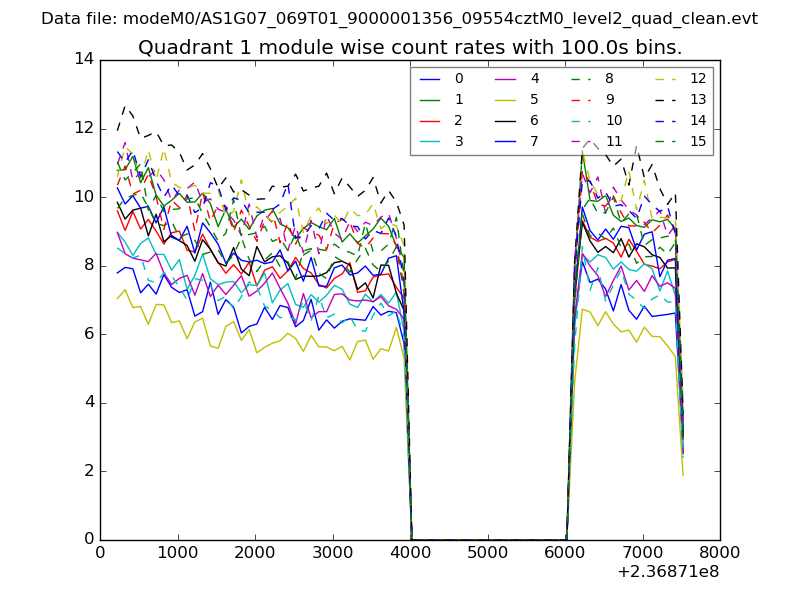 |
 |
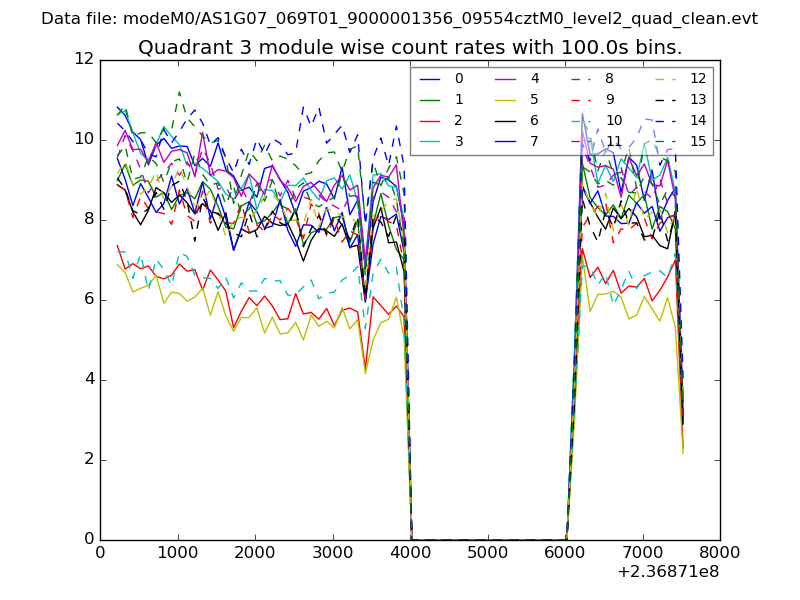
| Module-wise count rates for Quadrant C Data is divided into 100 sec bins |
 |
 |
| Module-wise count rates for Quadrant D Data is divided into 100 sec bins |
 |
 |
| Parameter | Plot |
|---|---|
| CZT HV Monitor |  |
| D_VDD | 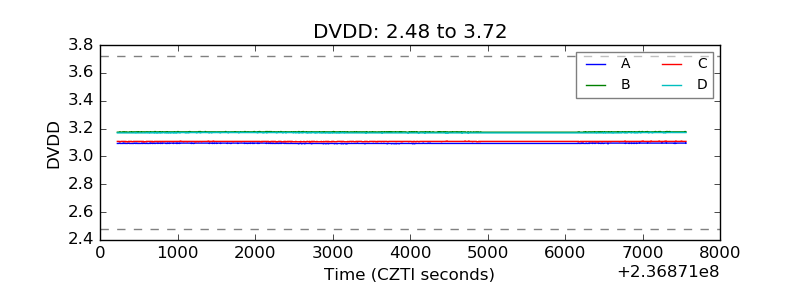 |
| Temperature 1 | 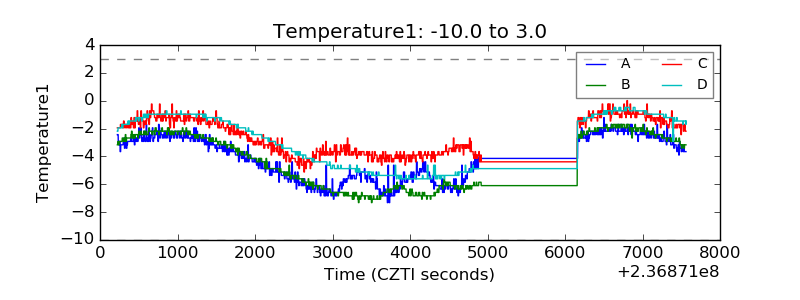 |
| Veto HV Monitor | 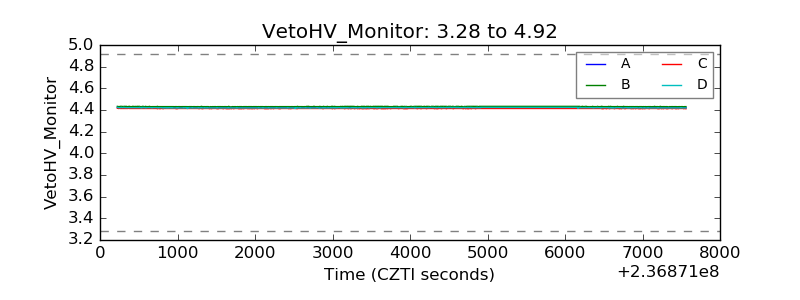 |
| Veto LLD | 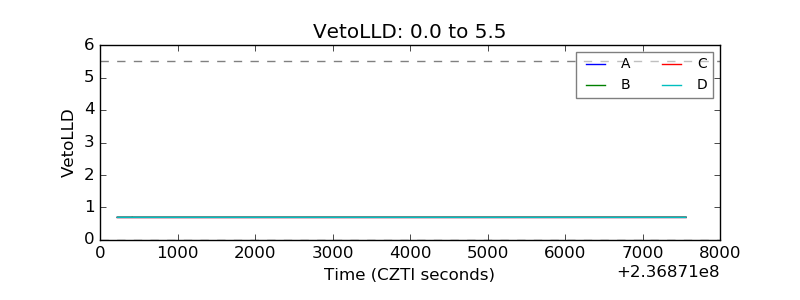 |
| Alpha Counter |  |
| _CPM_Rate | 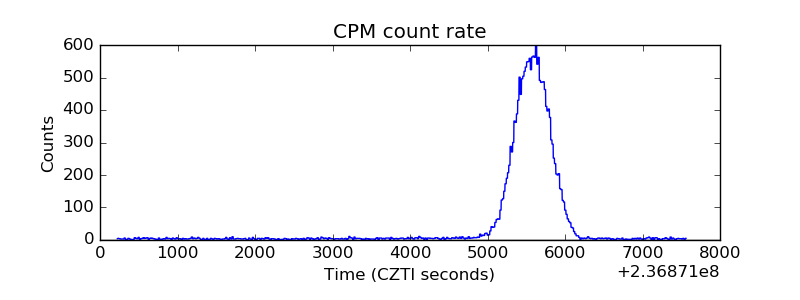 |
| CZT Counter | 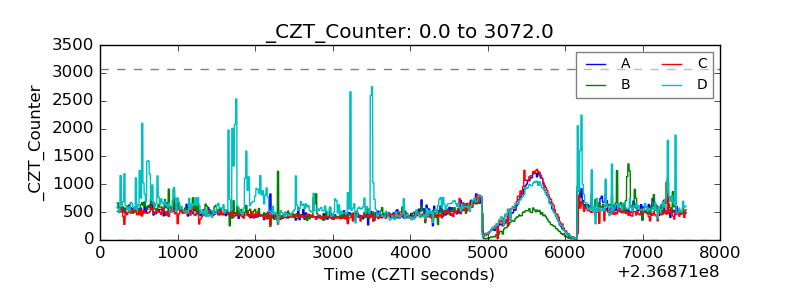 |
| +2.5 Volts monitor |  |
| +5 Volts monitor |  |
| _ROLL_ROT | 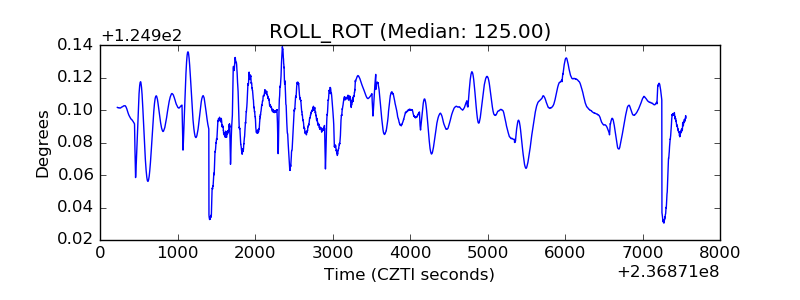 |
| _Roll_DEC | 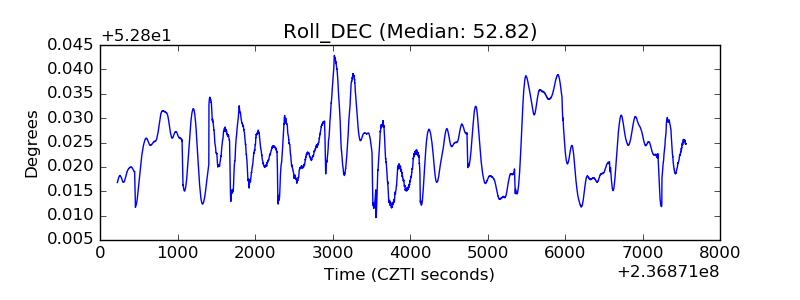 |
| _Roll_RA | 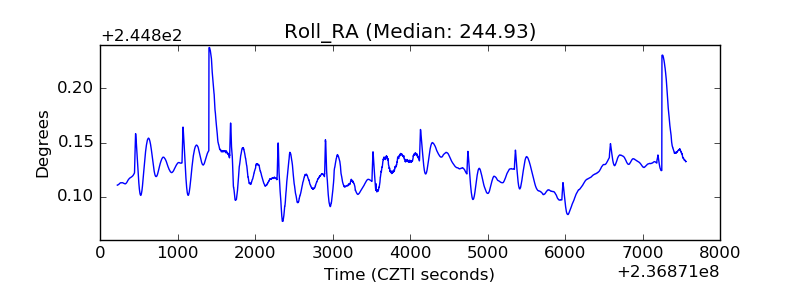 |
| Veto Counter | 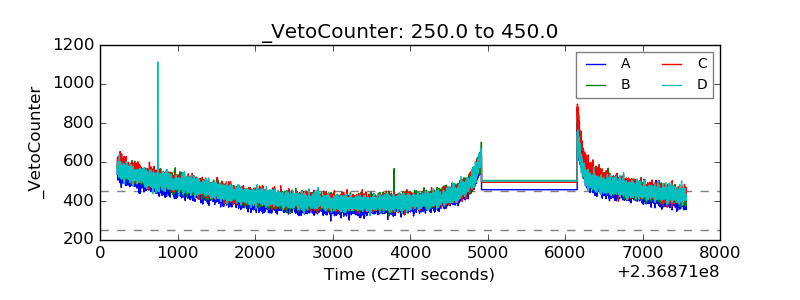 |