| Param | Original file | Final file |
|---|---|---|
| Filename | modeM0/AS1G07_069T01_9000001356_09555cztM0_level2.evt | modeM0/AS1G07_069T01_9000001356_09555cztM0_level2_quad_clean.evt |
| Size (bytes) | 460,477,440 | 92,433,600 |
| Size | 439.1 MB | 88.2 MB |
| Events in quadrant A | 3,227,184 | 597,452 |
| Events in quadrant B | 3,246,238 | 591,575 |
| Events in quadrant C | 2,863,410 | 599,018 |
| Events in quadrant D | 4,186,349 | 576,981 |
| Mode SS | |||
|---|---|---|---|
| Quadrant | BADHDUFLAG | Total packets | Discarded packets |
| A | 0 | 126 | 0 |
| B | 0 | 126 | 0 |
| C | 0 | 126 | 0 |
| D | 0 | 126 | 0 |
| Mode M9 | |||
|---|---|---|---|
| Quadrant | BADHDUFLAG | Total packets | Discarded packets |
| A | 0 | 9 | 0 |
| B | 0 | 9 | 0 |
| C | 0 | 9 | 0 |
| D | 0 | 9 | 0 |
| Mode M0 | |||
|---|---|---|---|
| Quadrant | BADHDUFLAG | Total packets | Discarded packets |
| A | 0 | 13712 | 27 |
| B | 0 | 13955 | 45 |
| C | 0 | 12781 | 33 |
| D | 0 | 16543 | 45 |
| Quadrant | Total seconds | Saturated seconds | Saturation percentage |
|---|---|---|---|
| A | 6227 | 95 | 1.525614% |
| B | 6221 | 73 | 1.173445% |
| C | 6223 | 57 | 0.915957% |
| D | 6222 | 76 | 1.221472% |
Noise dominated data is calculated using 1-second bins in cleaned event files. If a bin has >2000 counts, and if more than 50% of those come from <1% of pixels, then it is considered to be noise-dominated and hence unusable.
| Quadrant | # 1 sec bins | Bins with >0 counts | Bins with >2000 counts | High rate bins dominated by noise | Noise dominated (total time) | Noise dominated (detector-on time) | Marked lightcurve |
|---|---|---|---|---|---|---|---|
| A | 7169 | 6240 | 0 | 0 | 0.00% | 0.00% | 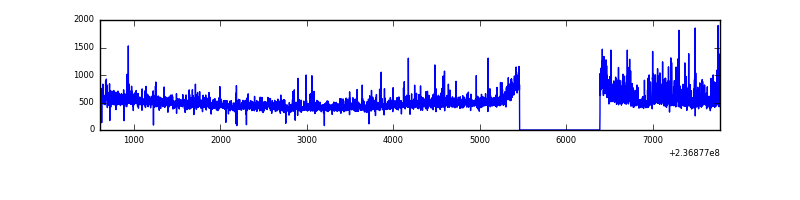 |
| B | 7169 | 6239 | 12 | 12 | 0.17% | 0.19% | 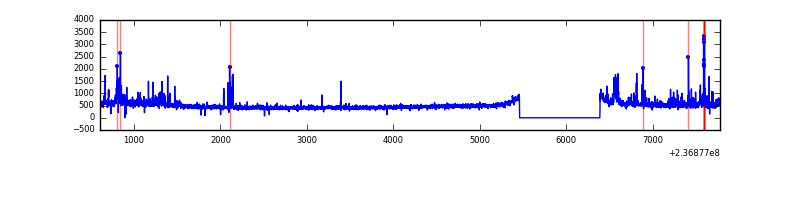 |
| C | 7169 | 6240 | 2 | 2 | 0.03% | 0.03% | 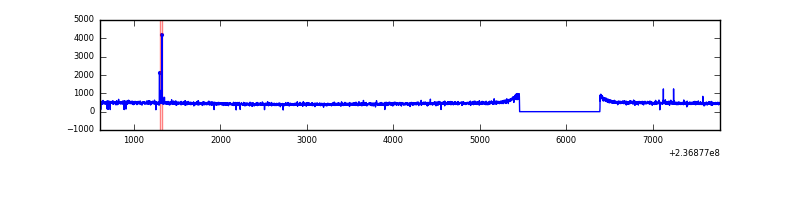 |
| D | 7169 | 6239 | 55 | 55 | 0.77% | 0.88% | 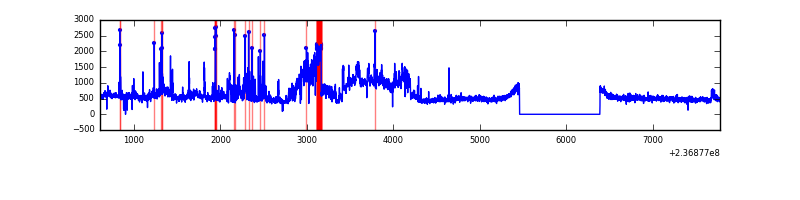 |
Top three noisy pixels from each quadrant. If the there are fewer than three noisy pixels in the level2.evt file, extra rows are filled as -1
| Pixel properties | Quadrant properties | ||||||
|---|---|---|---|---|---|---|---|
| Quadrant | DetID | PixID | Counts | Sigma | Mean | Median | Sigma |
| A | 1 | 162 | 167958 | 1113.2 | 740 | 724 | 150.2 |
| A | 1 | 178 | 67201 | 442.51 | 740 | 724 | 150.2 |
| A | 1 | 161 | 65620 | 431.98 | 740 | 724 | 150.2 |
| B | 4 | 80 | 192959 | 1389.71 | 738 | 721 | 138.3 |
| B | 0 | 214 | 72791 | 521.0 | 738 | 721 | 138.3 |
| B | 15 | 85 | 45970 | 327.11 | 738 | 721 | 138.3 |
| C | 14 | 234 | 18188 | 102.94 | 729 | 734 | 169.6 |
| C | 13 | 61 | 5446 | 27.79 | 729 | 734 | 169.6 |
| C | 3 | 202 | 1938 | 7.1 | 729 | 734 | 169.6 |
| D | 13 | 122 | 959489 | 5103.43 | 723 | 707 | 187.9 |
| D | 12 | 227 | 175736 | 931.65 | 723 | 707 | 187.9 |
| D | 1 | 52 | 160479 | 850.44 | 723 | 707 | 187.9 |
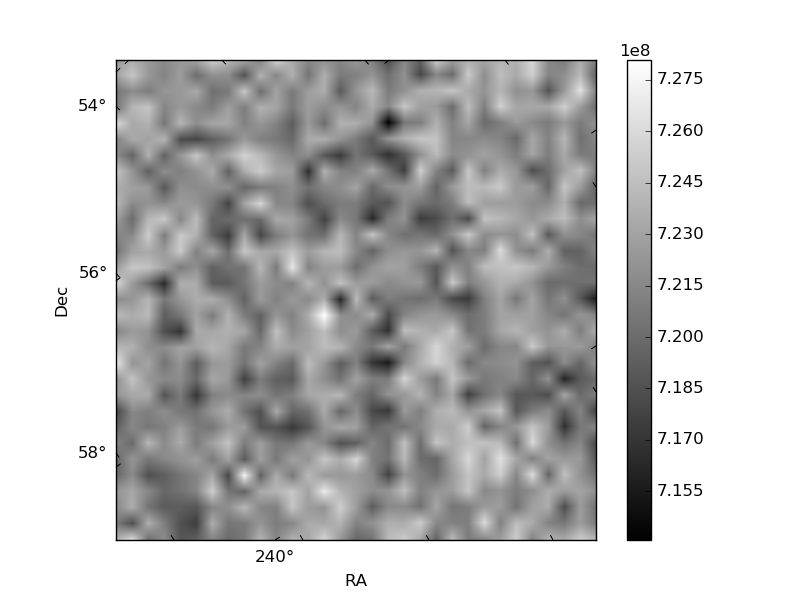
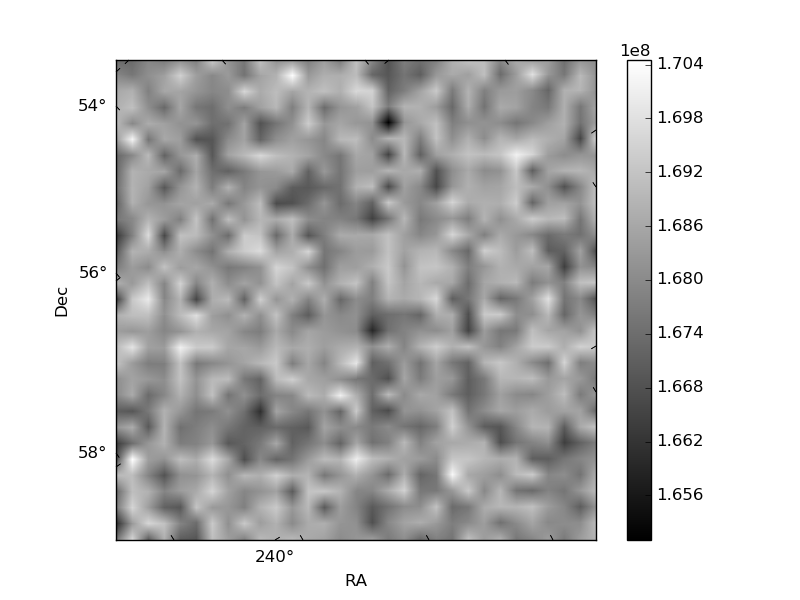
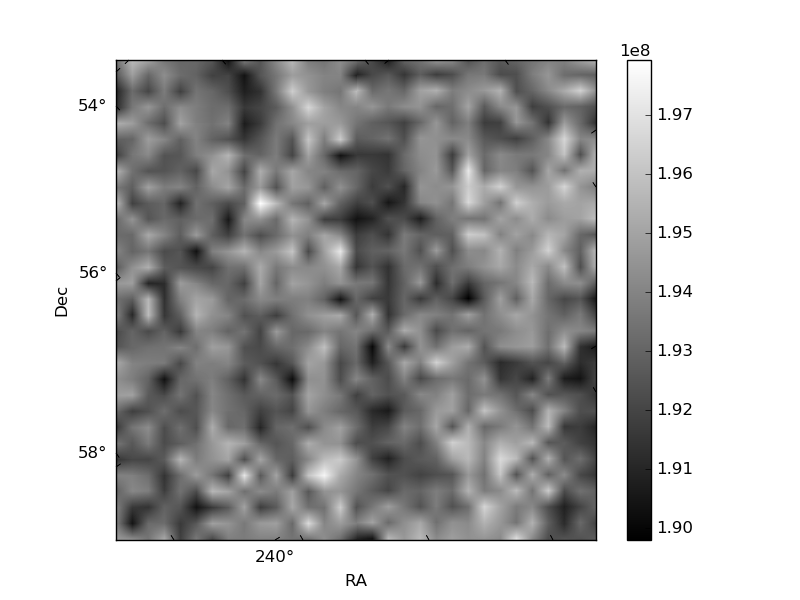
Histogram calculated using DETX and DETY for each event in the final _common_clean file
| Quadrant A | 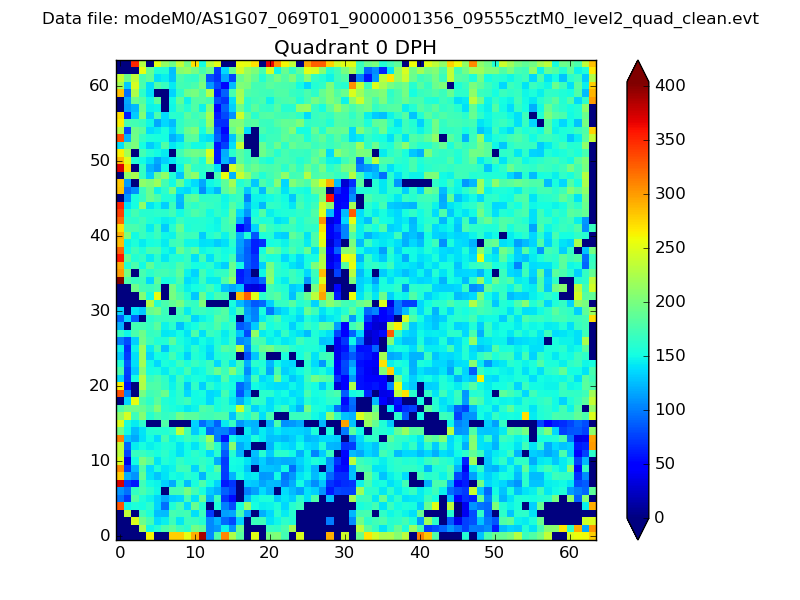 |
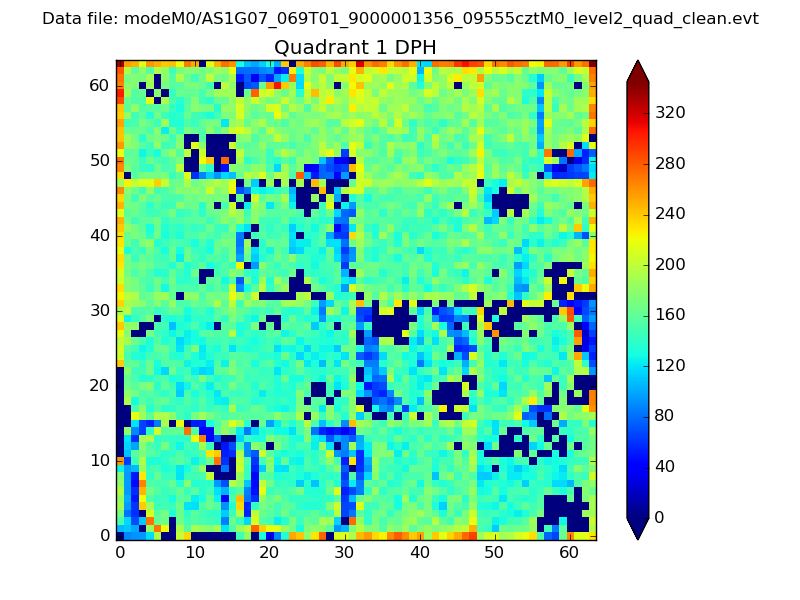 |
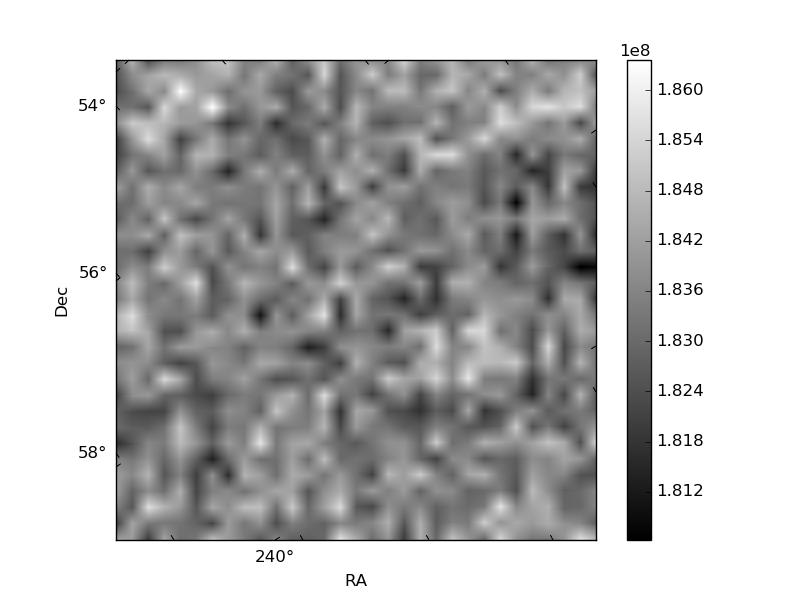
Quadrant B |
|---|---|---|---|
| Quadrant D | 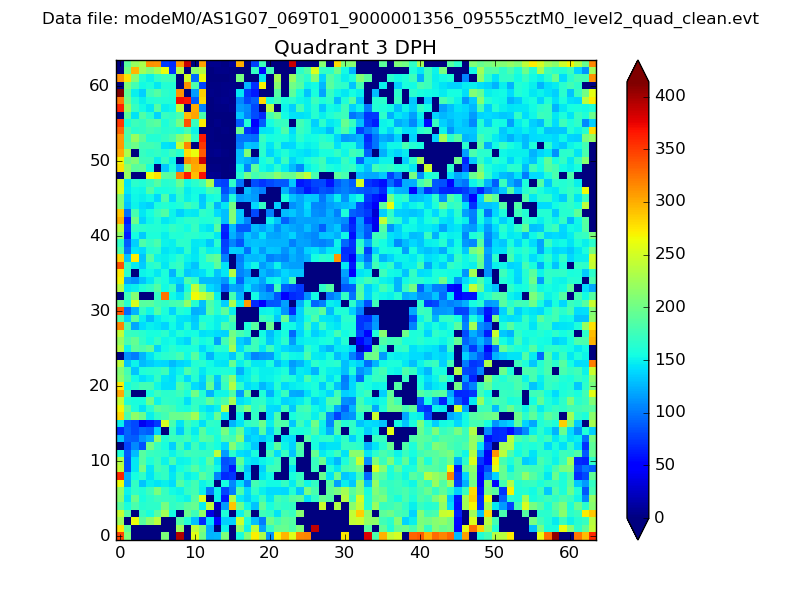 |
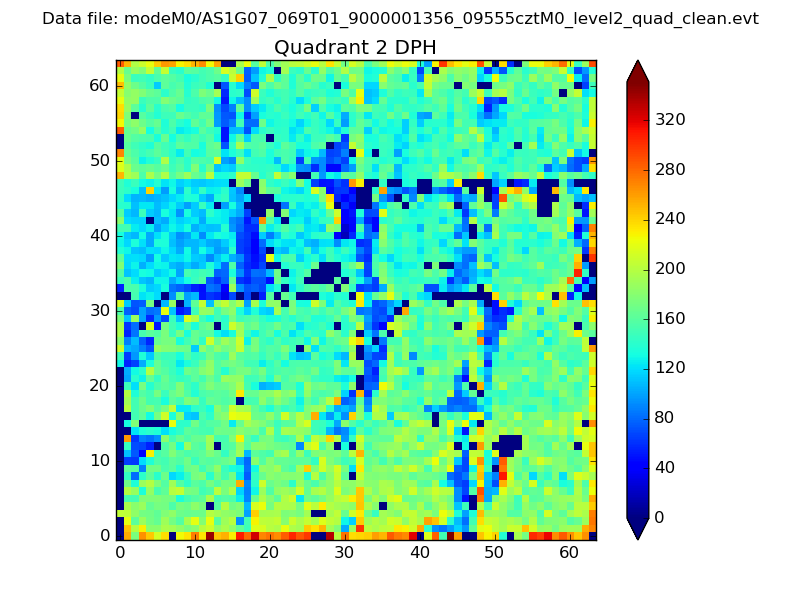 |
Quadrant C |
| Plot type | Count rate plots | Images |
|---|---|---|
| Comparison with Poisson distribution Blue bars denote a histogram of data divided into 1 sec bins. Red curve is a Poisson curve with rate = median count rate of data. |
 |
 |
| Quadrant-wise count rates Data is divided into 100 sec bins |
 |
|
| Module-wise count rates for Quadrant A Data is divided into 100 sec bins |
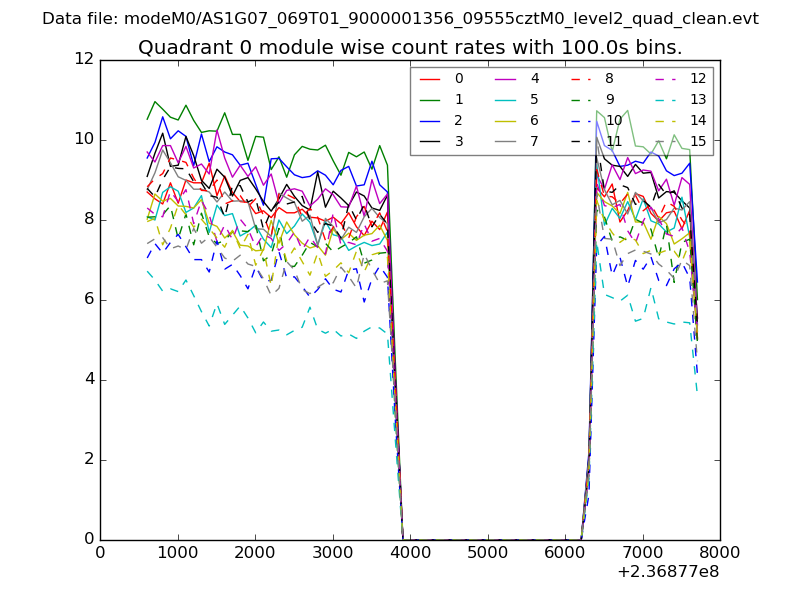 |
 |
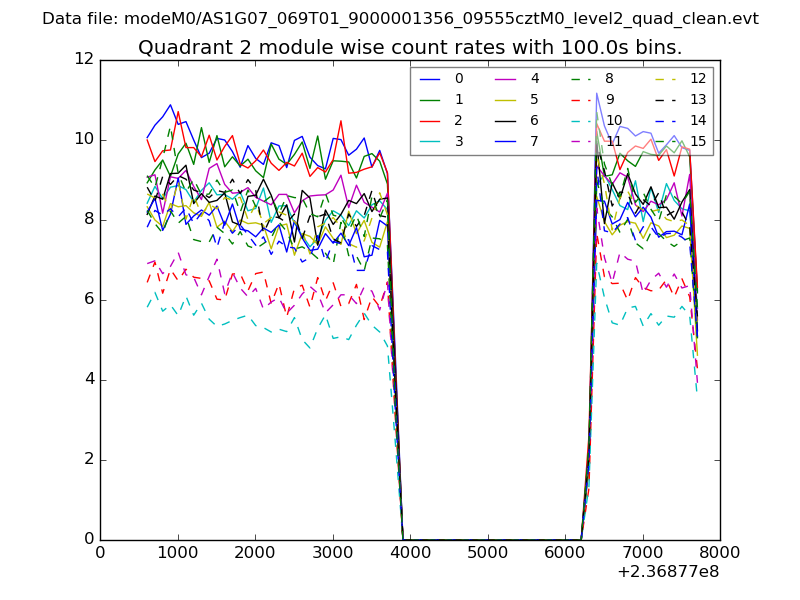
| Module-wise count rates for Quadrant B Data is divided into 100 sec bins |
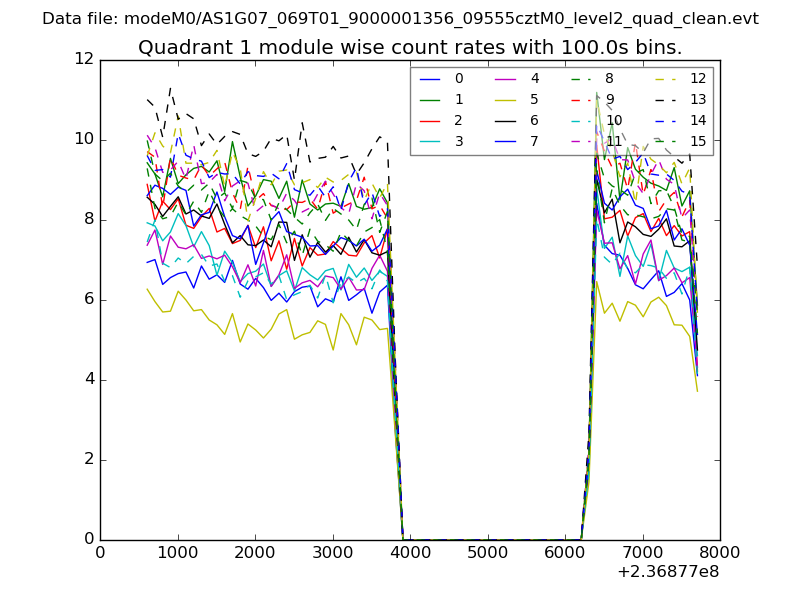 |
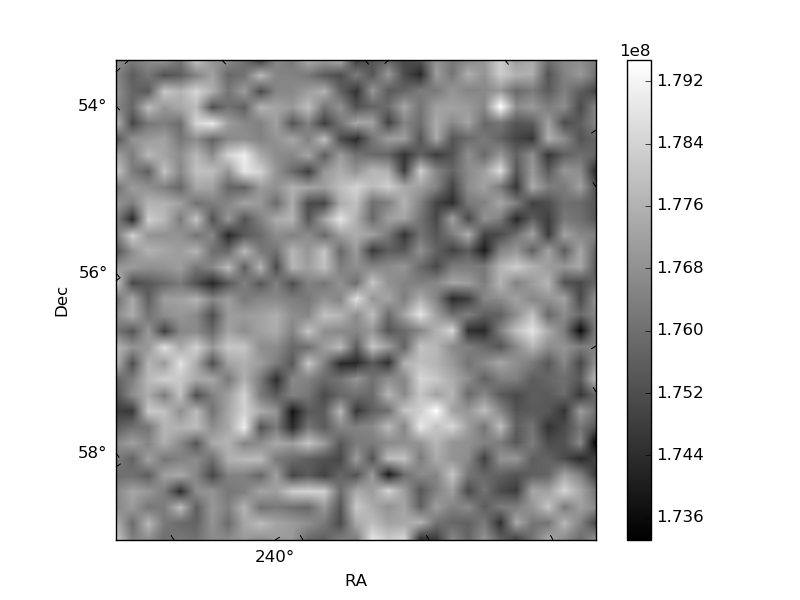 |
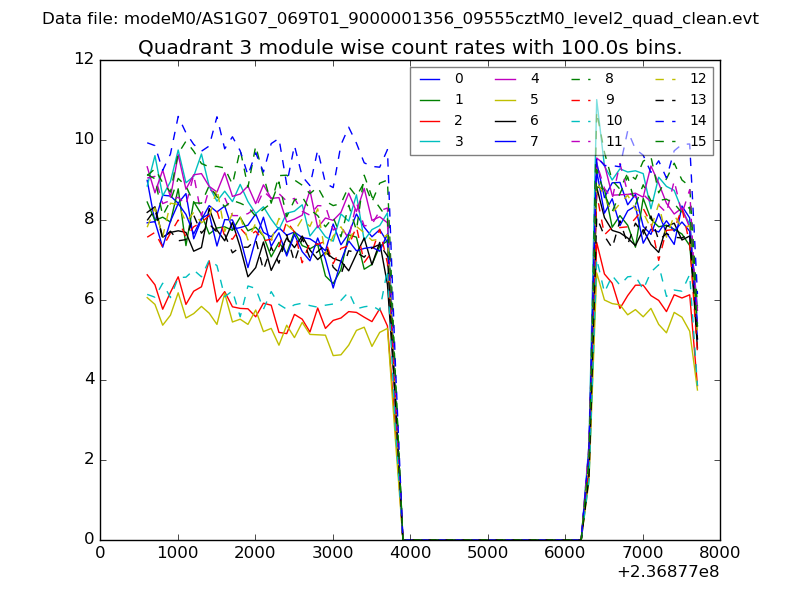
| Module-wise count rates for Quadrant C Data is divided into 100 sec bins |
 |
 |
| Module-wise count rates for Quadrant D Data is divided into 100 sec bins |
 |
 |
| Parameter | Plot |
|---|---|
| CZT HV Monitor | 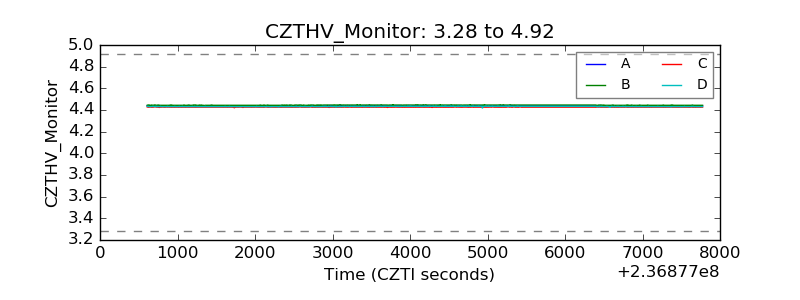 |
| D_VDD | 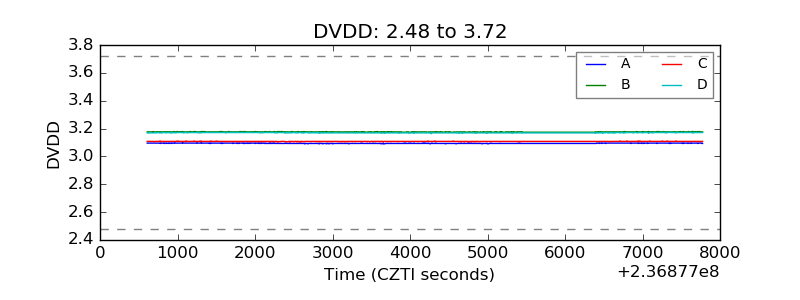 |
| Temperature 1 | 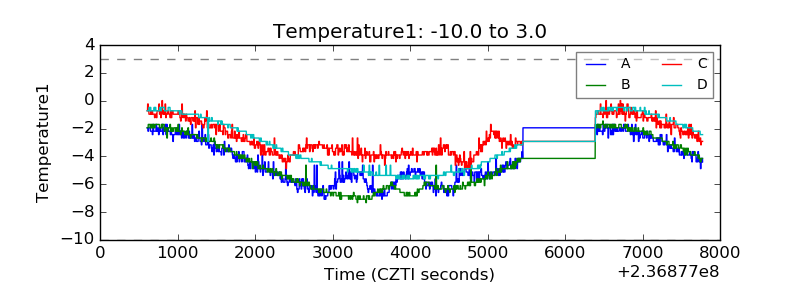 |
| Veto HV Monitor | 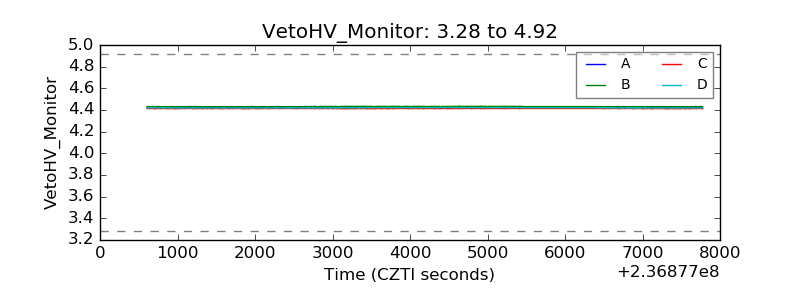 |
| Veto LLD | 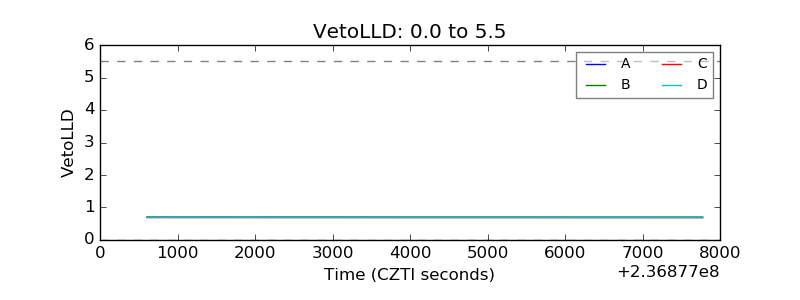 |
| Alpha Counter |  |
| _CPM_Rate | 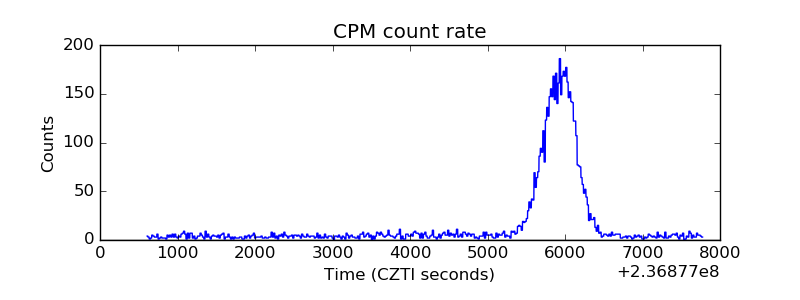 |
| CZT Counter | 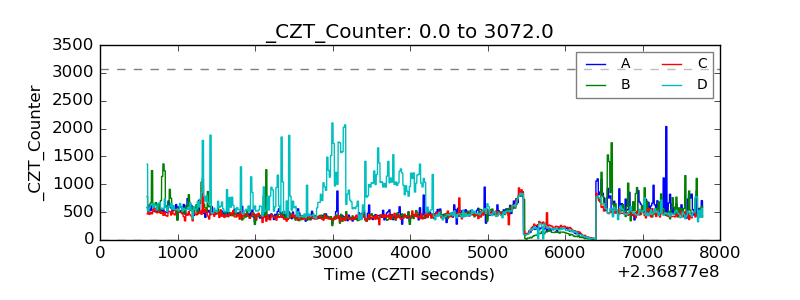 |
| +2.5 Volts monitor |  |
| +5 Volts monitor |  |
| _ROLL_ROT | 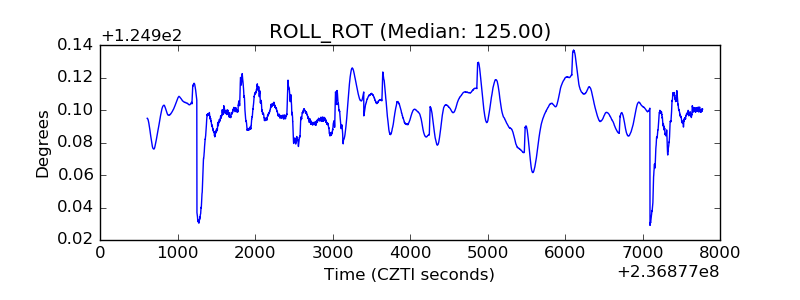 |
| _Roll_DEC | 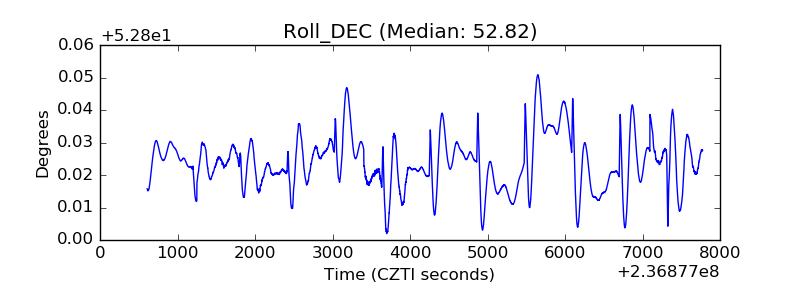 |
| _Roll_RA | 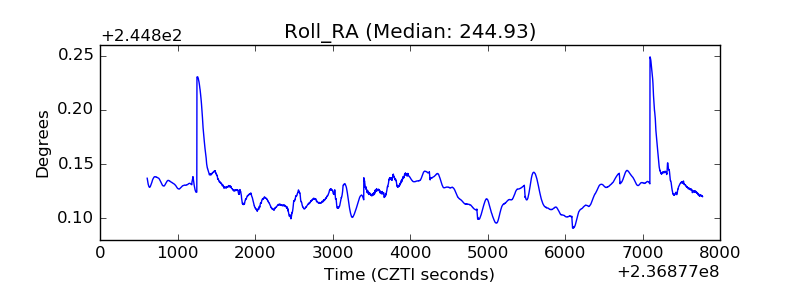 |
| Veto Counter | 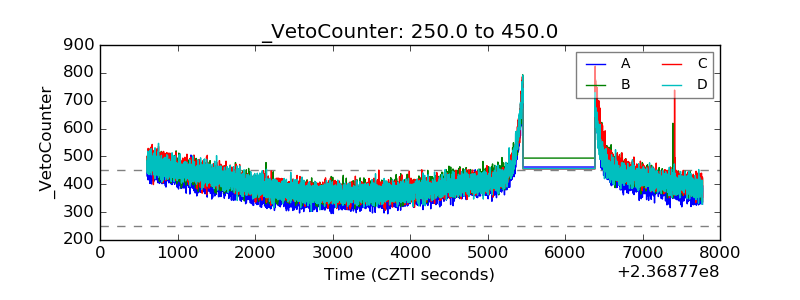 |