| Param | Original file | Final file |
|---|---|---|
| Filename | modeM0/AS1G07_069T01_9000001356_09556cztM0_level2.evt | modeM0/AS1G07_069T01_9000001356_09556cztM0_level2_quad_clean.evt |
| Size (bytes) | 801,100,800 | 154,739,520 |
| Size | 764.0 MB | 147.6 MB |
| Events in quadrant A | 5,836,276 | 978,790 |
| Events in quadrant B | 5,724,200 | 974,651 |
| Events in quadrant C | 5,141,935 | 990,830 |
| Events in quadrant D | 6,790,214 | 956,440 |
| Mode SS | |||
|---|---|---|---|
| Quadrant | BADHDUFLAG | Total packets | Discarded packets |
| A | 0 | 234 | 0 |
| B | 0 | 234 | 0 |
| C | 0 | 234 | 0 |
| D | 0 | 234 | 0 |
| Mode M9 | |||
|---|---|---|---|
| Quadrant | BADHDUFLAG | Total packets | Discarded packets |
| A | 0 | 13 | 0 |
| B | 0 | 13 | 0 |
| C | 0 | 13 | 0 |
| D | 0 | 13 | 0 |
| Mode M0 | |||
|---|---|---|---|
| Quadrant | BADHDUFLAG | Total packets | Discarded packets |
| A | 0 | 25075 | 3 |
| B | 0 | 24793 | 2 |
| C | 0 | 23339 | 2 |
| D | 0 | 27820 | 2 |
| Quadrant | Total seconds | Saturated seconds | Saturation percentage |
|---|---|---|---|
| A | 11345 | 232 | 2.044954% |
| B | 11345 | 182 | 1.604231% |
| C | 11345 | 120 | 1.057735% |
| D | 11345 | 153 | 1.348612% |
Noise dominated data is calculated using 1-second bins in cleaned event files. If a bin has >2000 counts, and if more than 50% of those come from <1% of pixels, then it is considered to be noise-dominated and hence unusable.
| Quadrant | # 1 sec bins | Bins with >0 counts | Bins with >2000 counts | High rate bins dominated by noise | Noise dominated (total time) | Noise dominated (detector-on time) | Marked lightcurve |
|---|---|---|---|---|---|---|---|
| A | 12755 | 11346 | 5 | 5 | 0.04% | 0.04% | 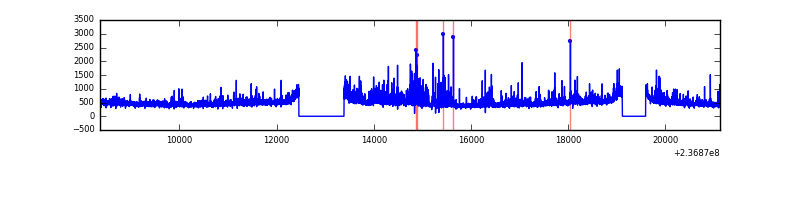 |
| B | 12755 | 11346 | 19 | 19 | 0.15% | 0.17% | 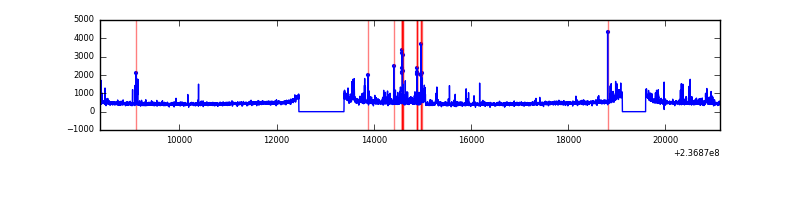 |
| C | 12755 | 11346 | 0 | 0 | 0.00% | 0.00% | 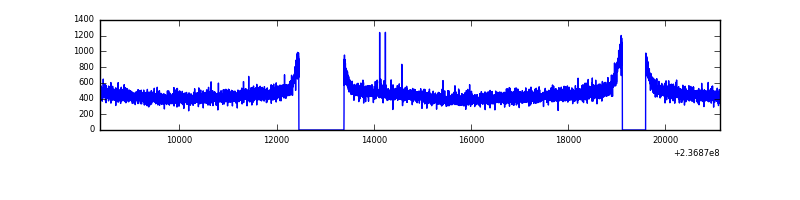 |
| D | 12755 | 11346 | 75 | 75 | 0.59% | 0.66% | 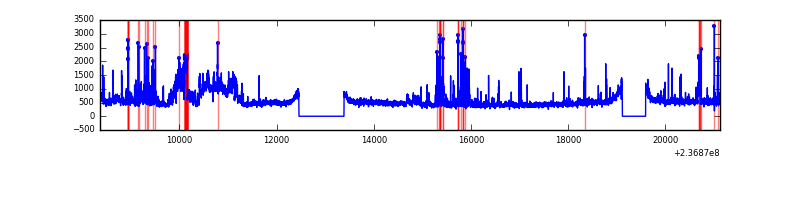 |
Top three noisy pixels from each quadrant. If the there are fewer than three noisy pixels in the level2.evt file, extra rows are filled as -1
| Pixel properties | Quadrant properties | ||||||
|---|---|---|---|---|---|---|---|
| Quadrant | DetID | PixID | Counts | Sigma | Mean | Median | Sigma |
| A | 1 | 162 | 307876 | 1141.18 | 1330 | 1300 | 268.6 |
| A | 1 | 178 | 136260 | 502.36 | 1330 | 1300 | 268.6 |
| A | 1 | 161 | 130552 | 481.12 | 1330 | 1300 | 268.6 |
| B | 4 | 80 | 259303 | 1029.82 | 1334 | 1303 | 250.5 |
| B | 15 | 85 | 82548 | 324.29 | 1334 | 1303 | 250.5 |
| B | 0 | 214 | 68149 | 266.82 | 1334 | 1303 | 250.5 |
| C | 13 | 61 | 9958 | 28.26 | 1317 | 1324 | 305.5 |
| C | 14 | 234 | 4437 | 10.19 | 1317 | 1324 | 305.5 |
| C | 9 | 68 | 3994 | 8.74 | 1317 | 1324 | 305.5 |
| D | 13 | 122 | 972189 | 2887.85 | 1305 | 1271 | 336.2 |
| D | 1 | 52 | 307529 | 910.92 | 1305 | 1271 | 336.2 |
| D | 12 | 227 | 175554 | 518.38 | 1305 | 1271 | 336.2 |
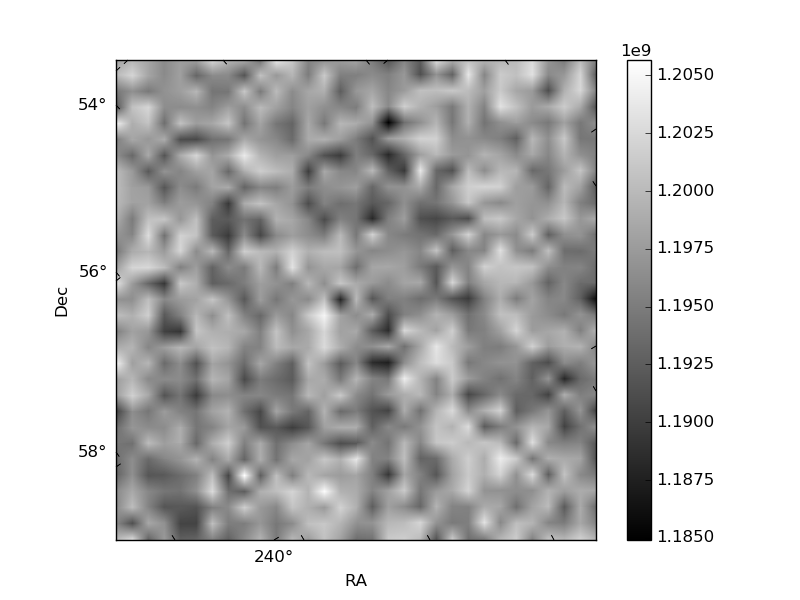
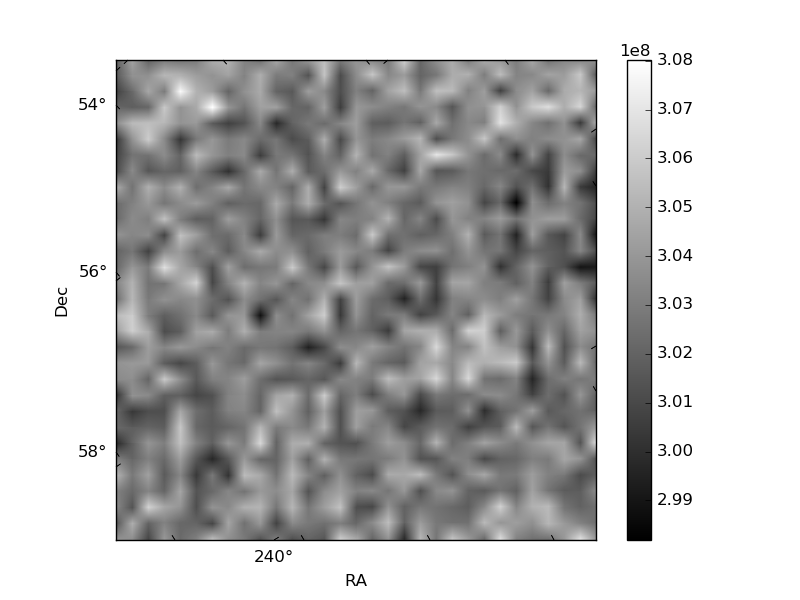
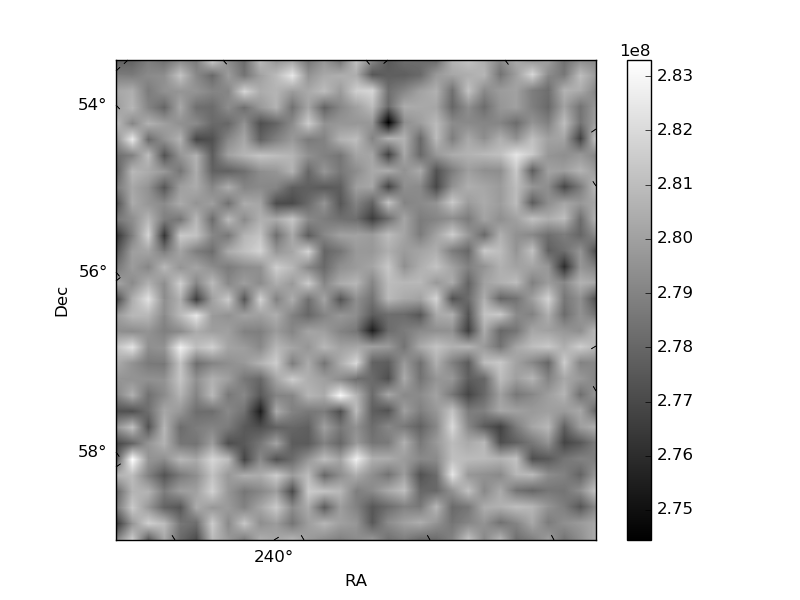
Histogram calculated using DETX and DETY for each event in the final _common_clean file
| Quadrant A | 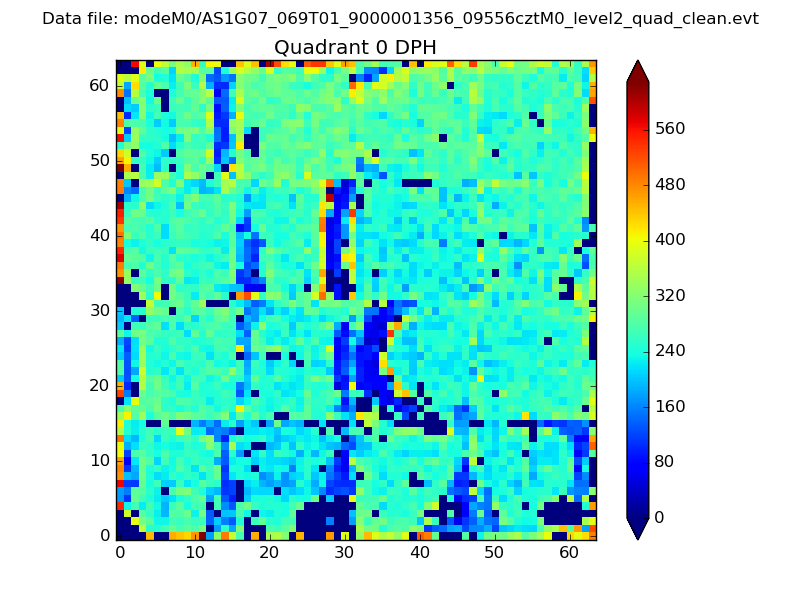 |
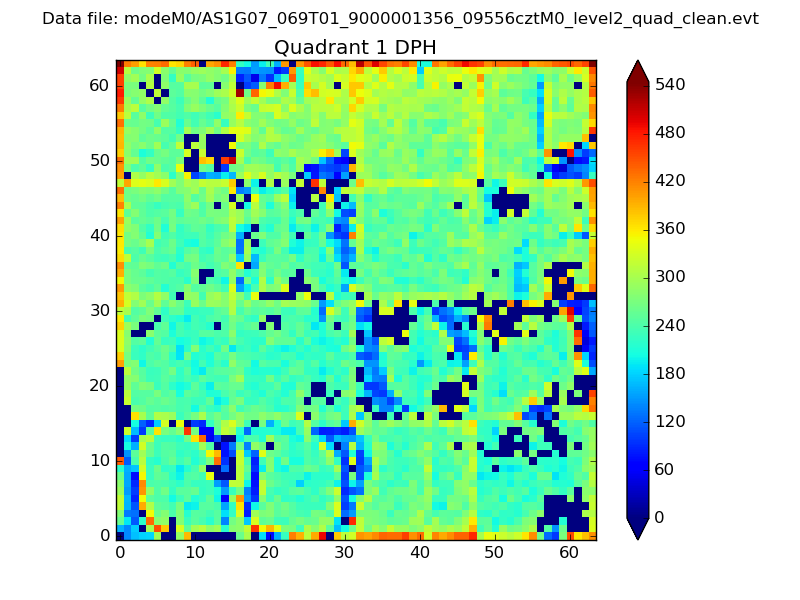 |
Quadrant B |
|---|---|---|---|
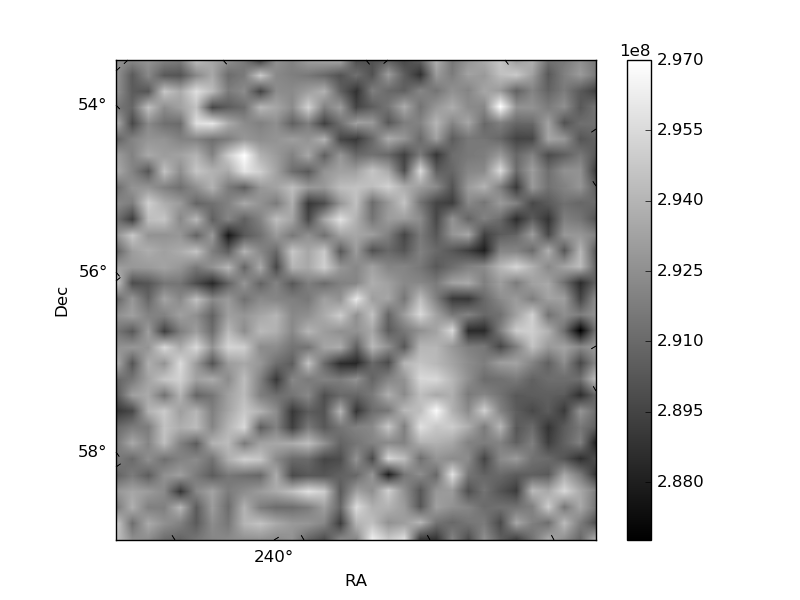
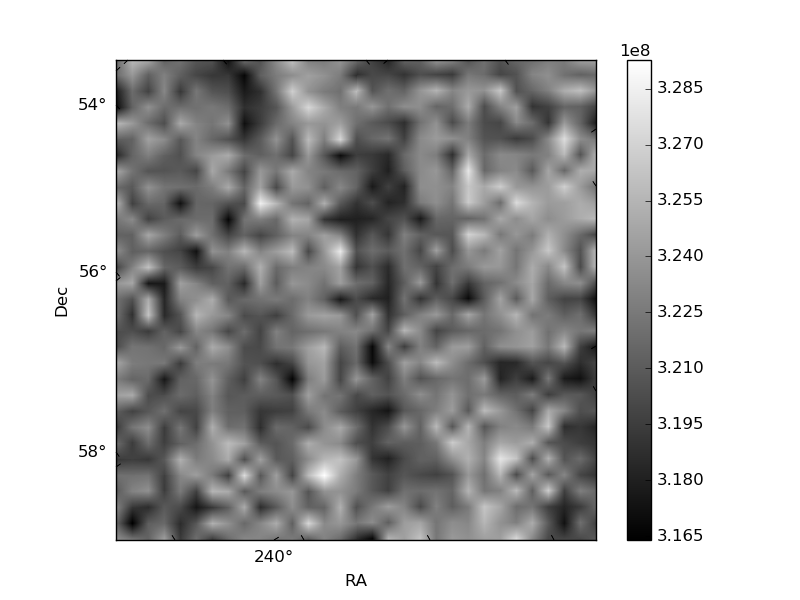
| Quadrant D | 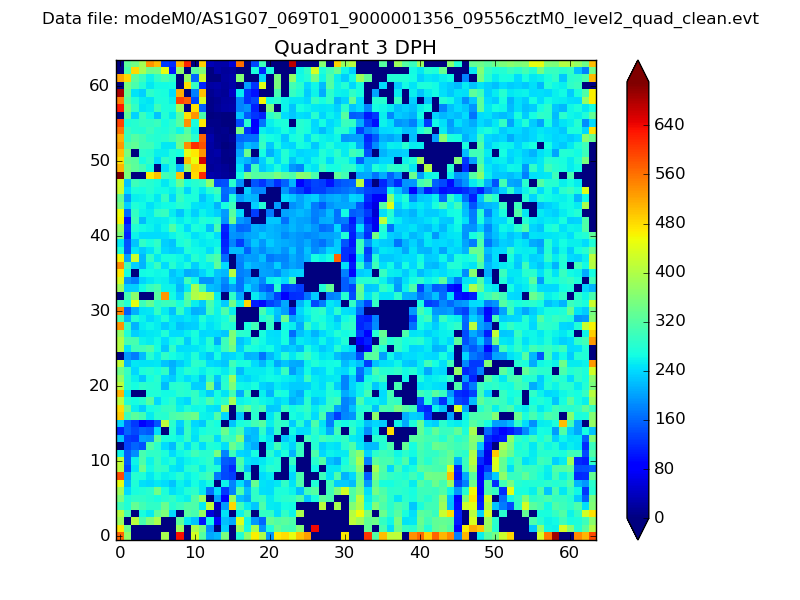 |
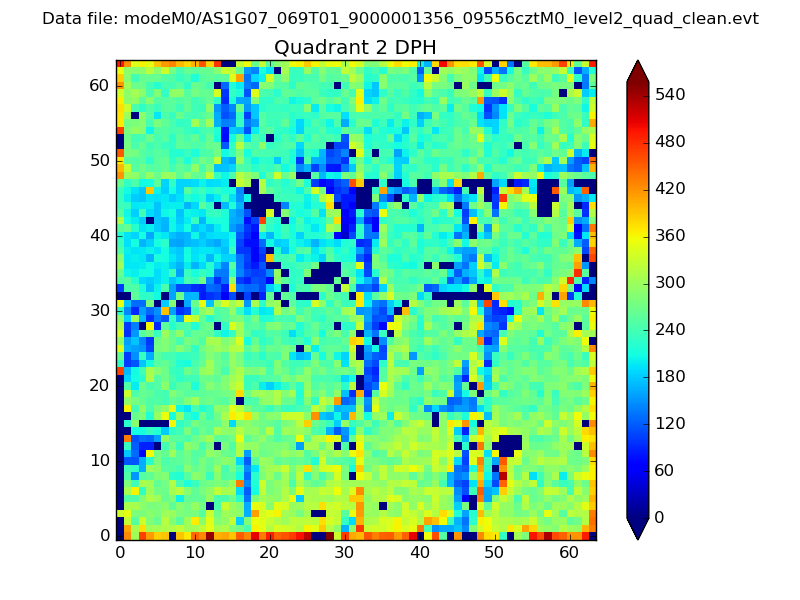 |
Quadrant C |
| Plot type | Count rate plots | Images |
|---|---|---|
| Comparison with Poisson distribution Blue bars denote a histogram of data divided into 1 sec bins. Red curve is a Poisson curve with rate = median count rate of data. |
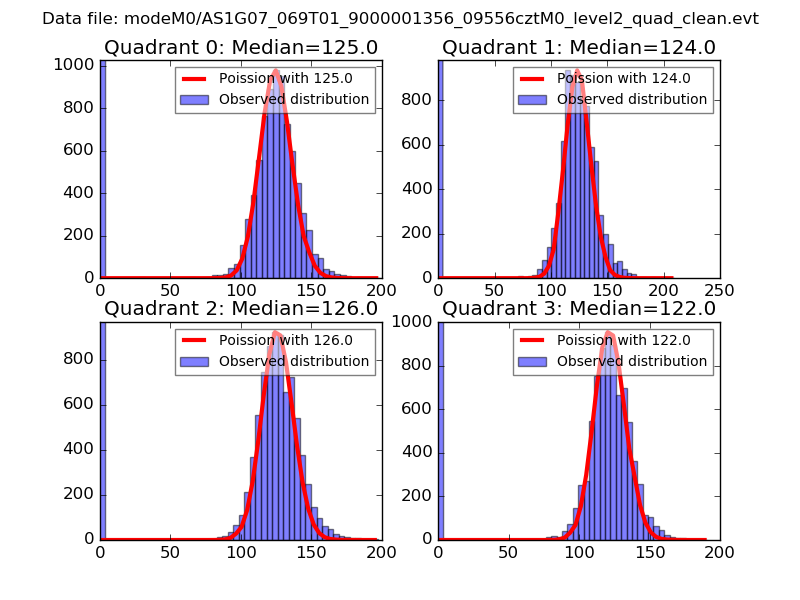 |
 |
| Quadrant-wise count rates Data is divided into 100 sec bins |
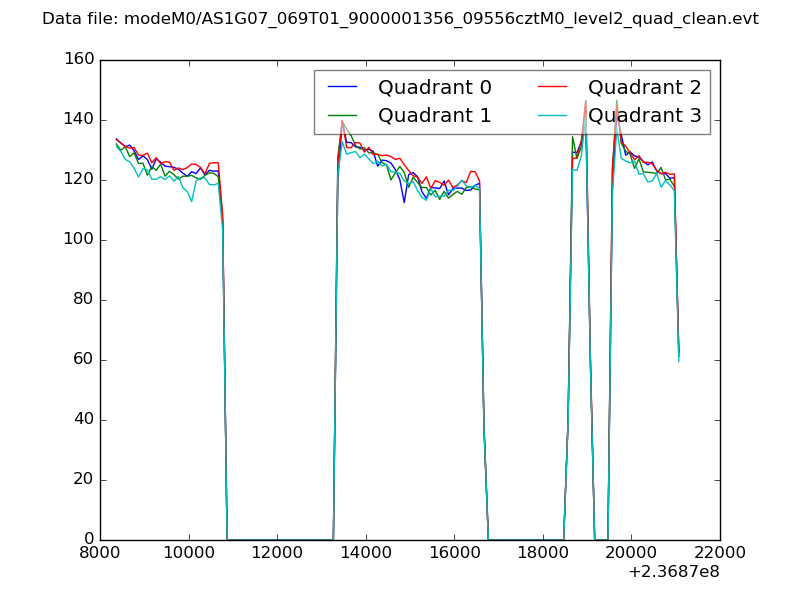 |
|
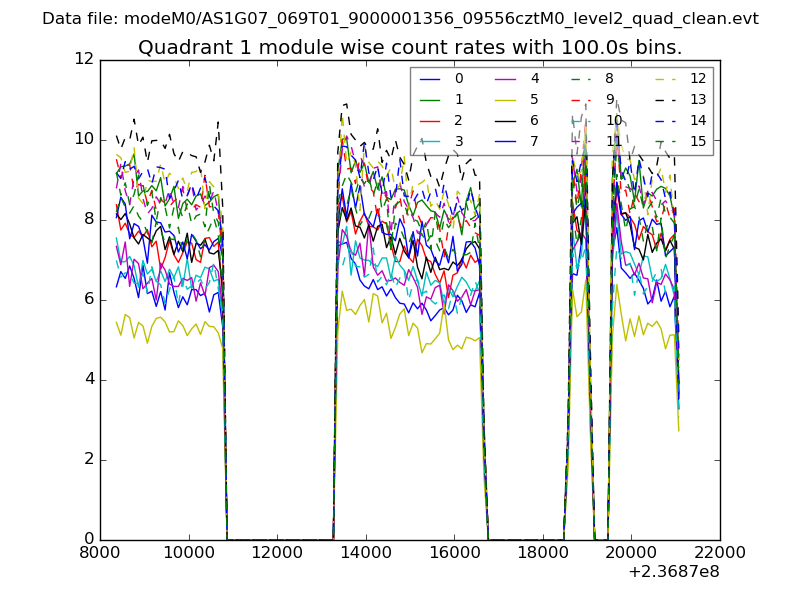
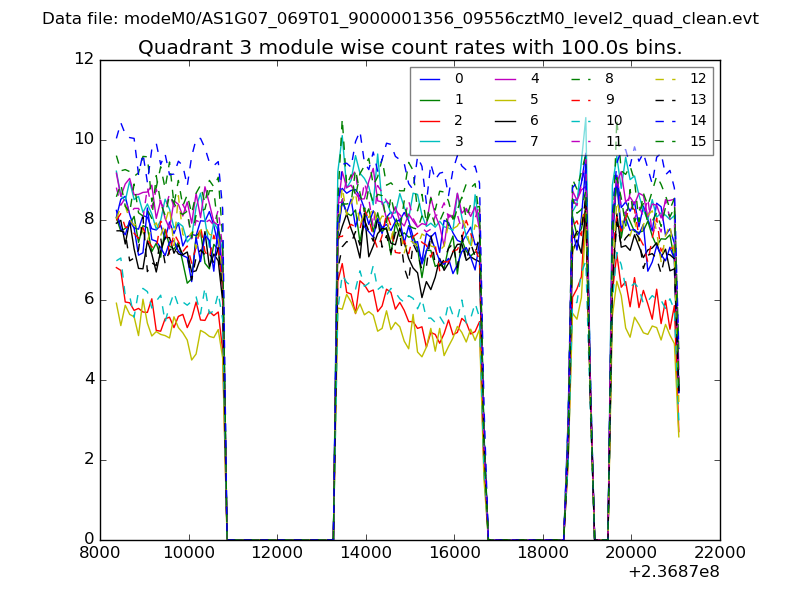
| Module-wise count rates for Quadrant A Data is divided into 100 sec bins |
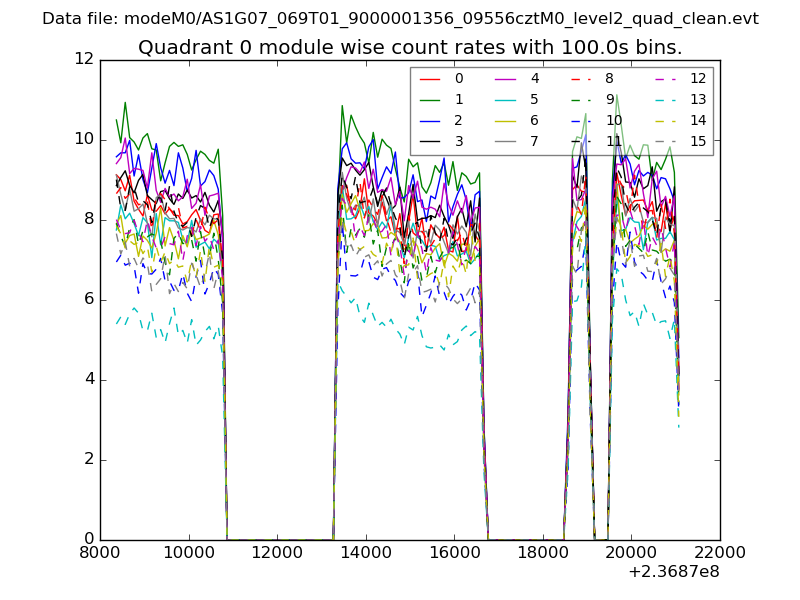 |
 |
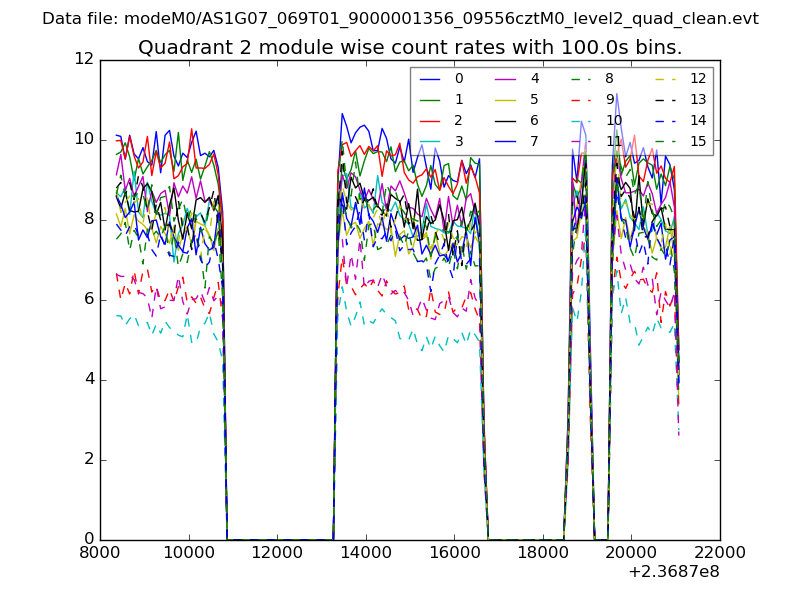
| Module-wise count rates for Quadrant B Data is divided into 100 sec bins |
 |
 |
| Module-wise count rates for Quadrant C Data is divided into 100 sec bins |
 |
 |
| Module-wise count rates for Quadrant D Data is divided into 100 sec bins |
 |
 |
| Parameter | Plot |
|---|---|
| CZT HV Monitor | 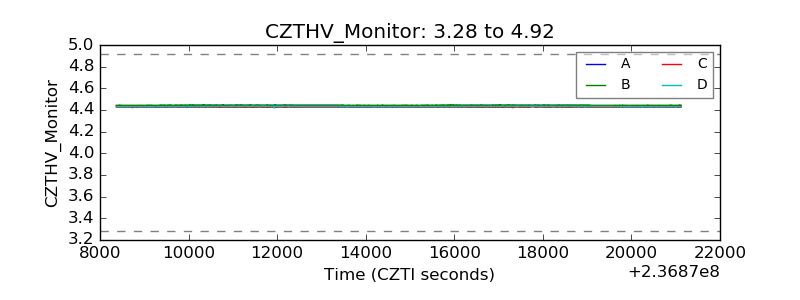 |
| D_VDD | 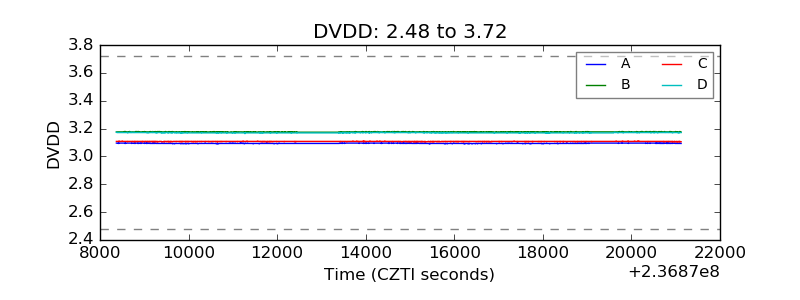 |
| Temperature 1 | 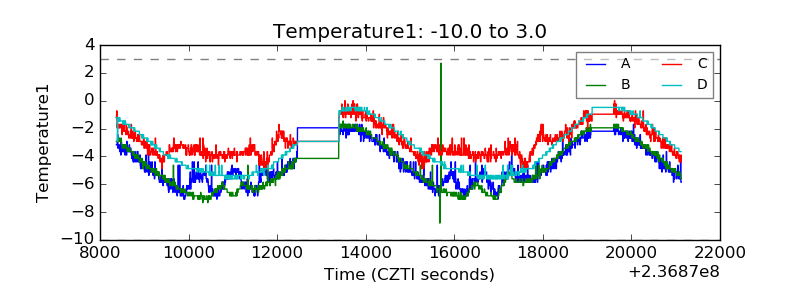 |
| Veto HV Monitor | 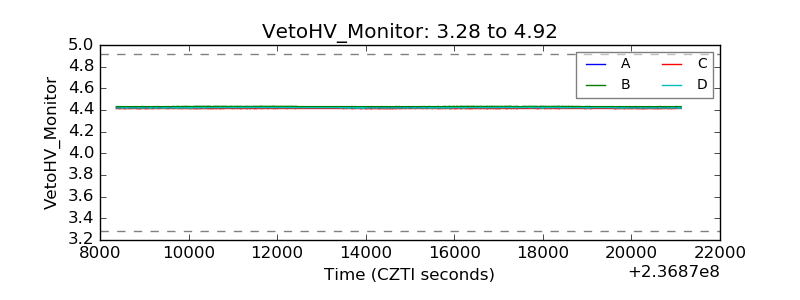 |
| Veto LLD | 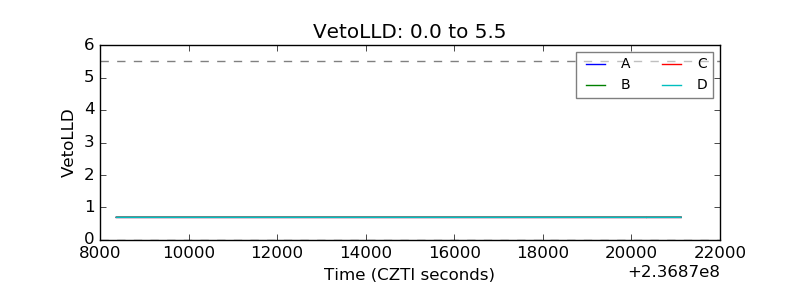 |
| Alpha Counter | 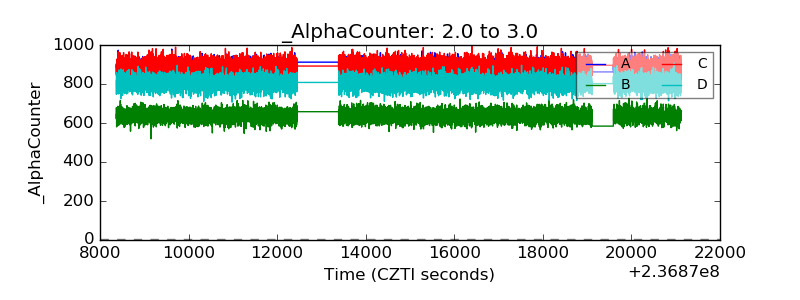 |
| _CPM_Rate | 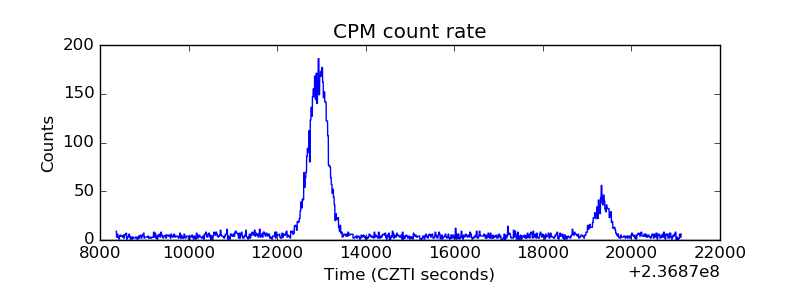 |
| CZT Counter | 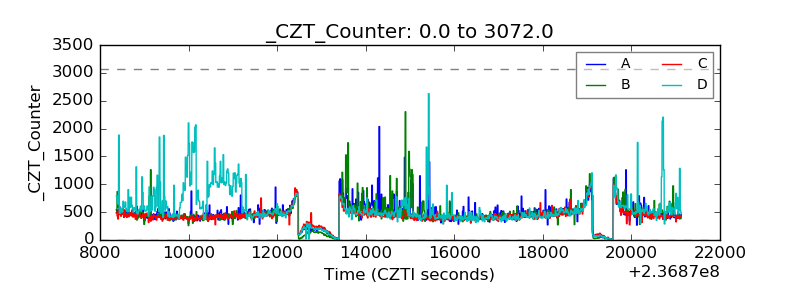 |
| +2.5 Volts monitor |  |
| +5 Volts monitor |  |
| _ROLL_ROT | 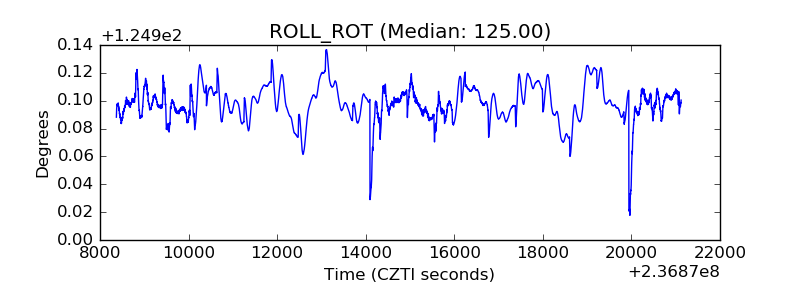 |
| _Roll_DEC | 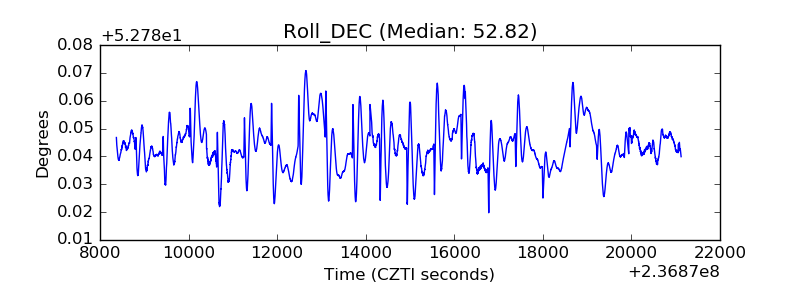 |
| _Roll_RA | 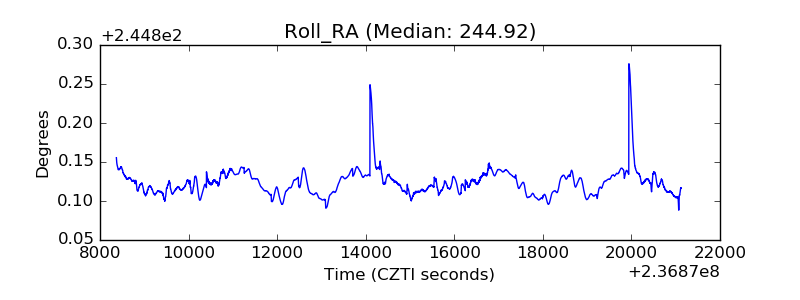 |
| Veto Counter | 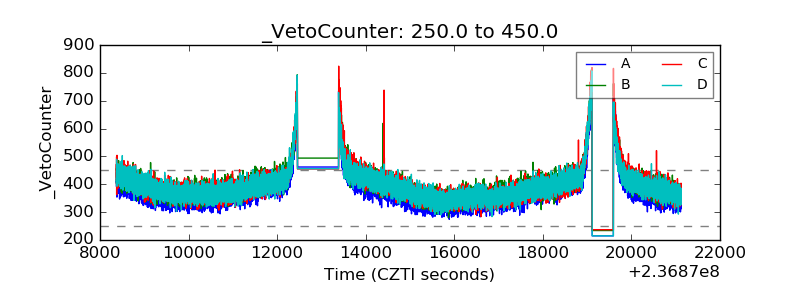 |