| Param | Original file | Final file |
|---|---|---|
| Filename | modeM0/AS1G07_069T01_9000001356_09557cztM0_level2.evt | modeM0/AS1G07_069T01_9000001356_09557cztM0_level2_quad_clean.evt |
| Size (bytes) | 532,042,560 | 111,332,160 |
| Size | 507.4 MB | 106.2 MB |
| Events in quadrant A | 4,102,631 | 711,153 |
| Events in quadrant B | 3,869,709 | 712,591 |
| Events in quadrant C | 3,473,927 | 719,317 |
| Events in quadrant D | 4,146,008 | 695,096 |
| Mode SS | |||
|---|---|---|---|
| Quadrant | BADHDUFLAG | Total packets | Discarded packets |
| A | 0 | 154 | 0 |
| B | 0 | 154 | 0 |
| C | 0 | 154 | 0 |
| D | 0 | 154 | 0 |
| Mode M9 | |||
|---|---|---|---|
| Quadrant | BADHDUFLAG | Total packets | Discarded packets |
| A | 0 | 4 | 0 |
| B | 0 | 4 | 0 |
| C | 0 | 4 | 0 |
| D | 0 | 5 | 0 |
| Mode M0 | |||
|---|---|---|---|
| Quadrant | BADHDUFLAG | Total packets | Discarded packets |
| A | 0 | 17563 | 3 |
| B | 0 | 16811 | 2 |
| C | 0 | 15835 | 2 |
| D | 0 | 17601 | 2 |
| Quadrant | Total seconds | Saturated seconds | Saturation percentage |
|---|---|---|---|
| A | 7676 | 164 | 2.136529% |
| B | 7676 | 81 | 1.055237% |
| C | 7676 | 31 | 0.403856% |
| D | 7676 | 80 | 1.042209% |
Noise dominated data is calculated using 1-second bins in cleaned event files. If a bin has >2000 counts, and if more than 50% of those come from <1% of pixels, then it is considered to be noise-dominated and hence unusable.
| Quadrant | # 1 sec bins | Bins with >0 counts | Bins with >2000 counts | High rate bins dominated by noise | Noise dominated (total time) | Noise dominated (detector-on time) | Marked lightcurve |
|---|---|---|---|---|---|---|---|
| A | 7890 | 7676 | 4 | 4 | 0.05% | 0.05% | 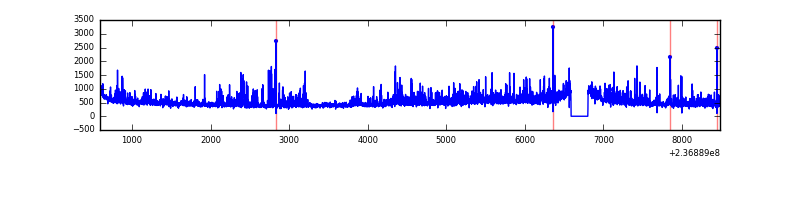 |
| B | 7890 | 7676 | 3 | 3 | 0.04% | 0.04% | 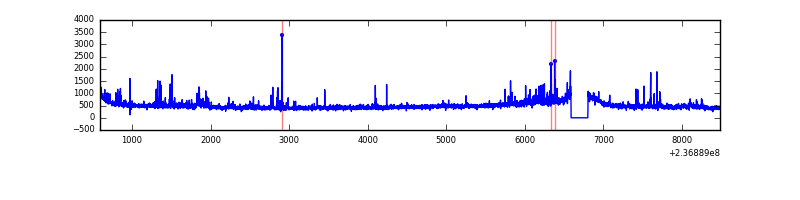 |
| C | 7890 | 7676 | 0 | 0 | 0.00% | 0.00% | 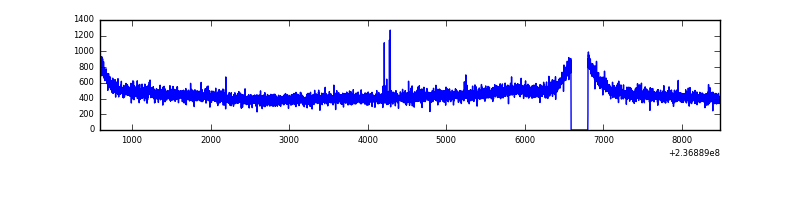 |
| D | 7890 | 7676 | 23 | 23 | 0.29% | 0.30% | 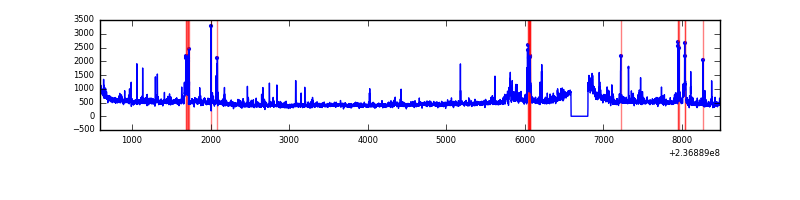 |
Top three noisy pixels from each quadrant. If the there are fewer than three noisy pixels in the level2.evt file, extra rows are filled as -1
| Pixel properties | Quadrant properties | ||||||
|---|---|---|---|---|---|---|---|
| Quadrant | DetID | PixID | Counts | Sigma | Mean | Median | Sigma |
| A | 1 | 162 | 262250 | 1418.83 | 900 | 881 | 184.2 |
| A | 1 | 178 | 126462 | 681.71 | 900 | 881 | 184.2 |
| A | 1 | 161 | 122388 | 659.59 | 900 | 881 | 184.2 |
| B | 4 | 80 | 130638 | 752.18 | 906 | 883 | 172.5 |
| B | 0 | 214 | 91573 | 525.73 | 906 | 883 | 172.5 |
| B | 15 | 204 | 51481 | 293.31 | 906 | 883 | 172.5 |
| C | 13 | 61 | 6614 | 27.76 | 889 | 890 | 206.2 |
| C | 14 | 234 | 5025 | 20.05 | 889 | 890 | 206.2 |
| C | 3 | 202 | 2262 | 6.65 | 889 | 890 | 206.2 |
| D | 1 | 52 | 275052 | 1181.42 | 883 | 863 | 232.1 |
| D | 8 | 195 | 157137 | 673.35 | 883 | 863 | 232.1 |
| D | 12 | 227 | 80172 | 341.72 | 883 | 863 | 232.1 |
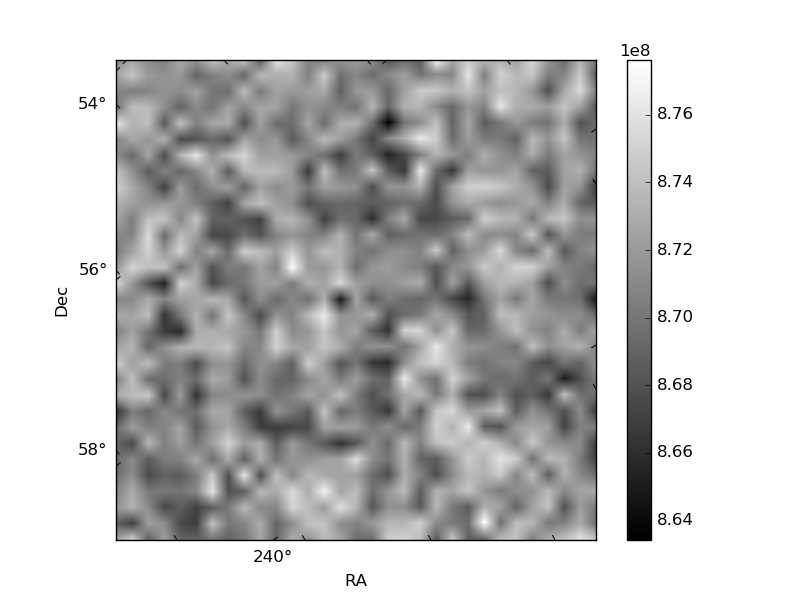
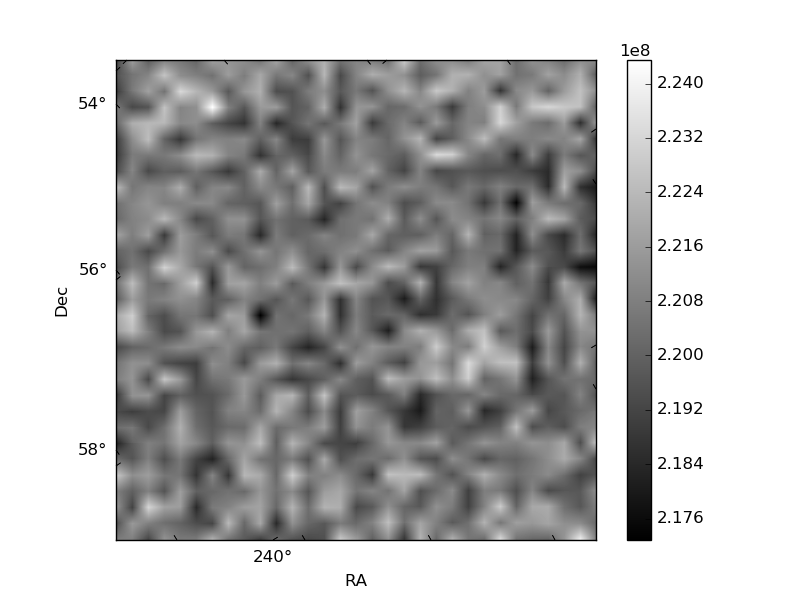
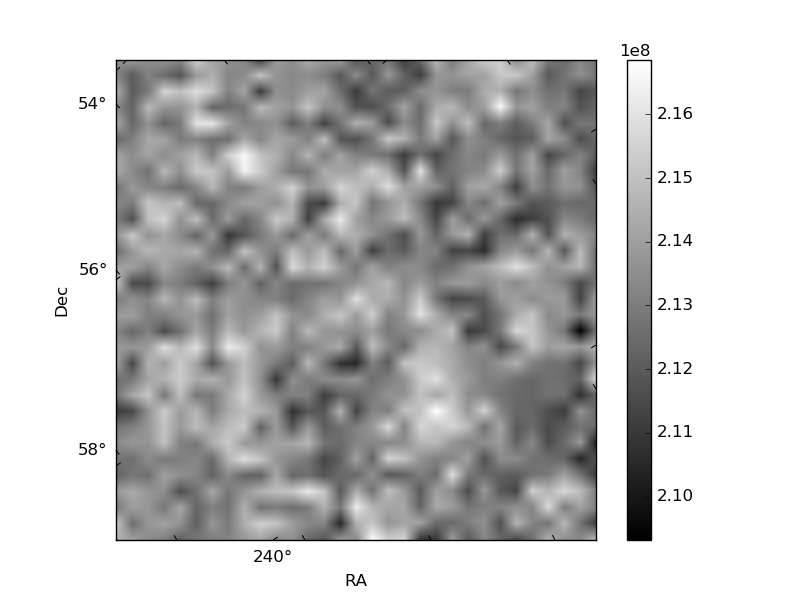
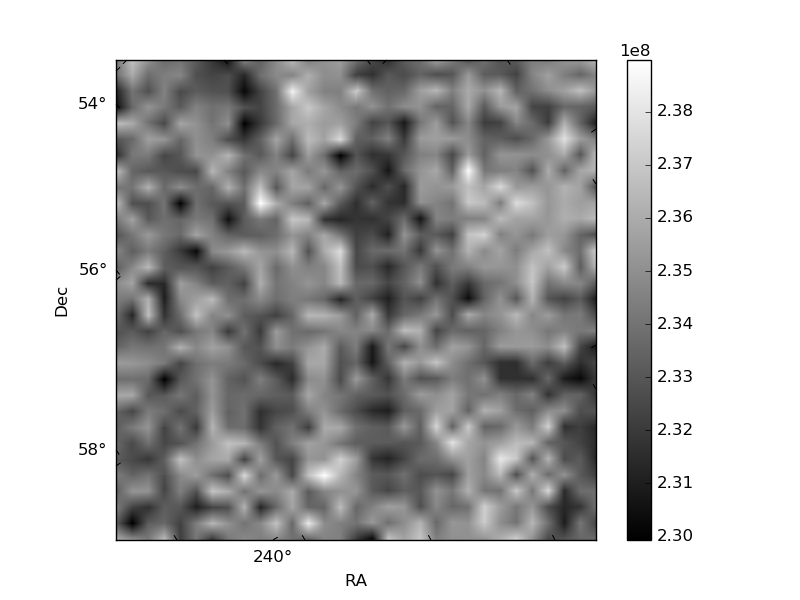
Histogram calculated using DETX and DETY for each event in the final _common_clean file
| Quadrant A | 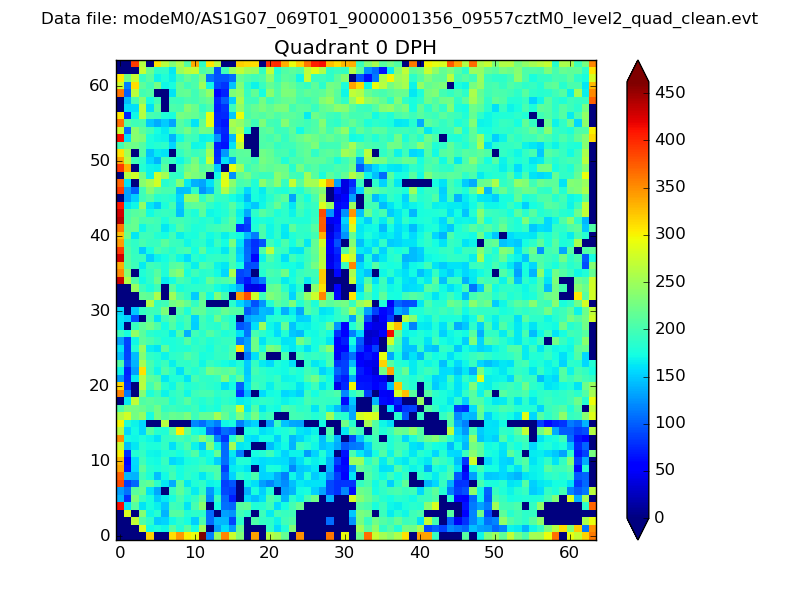 |
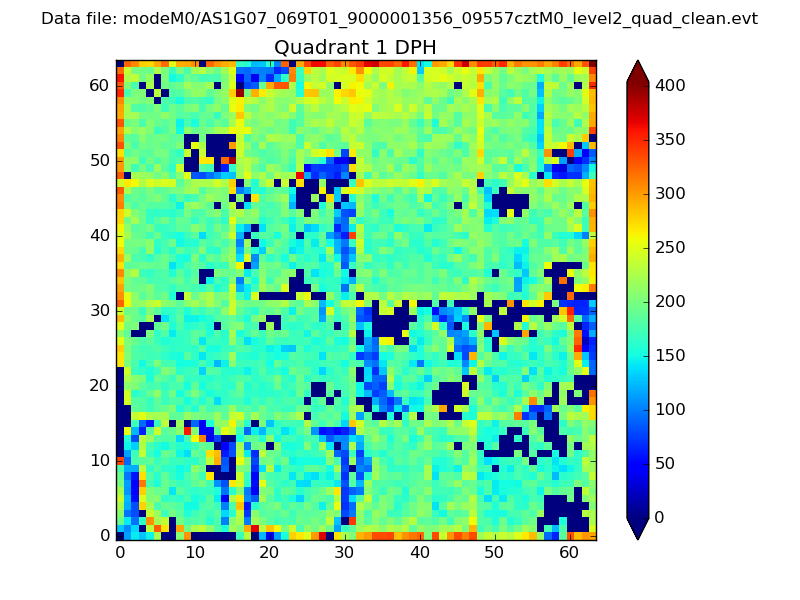 |
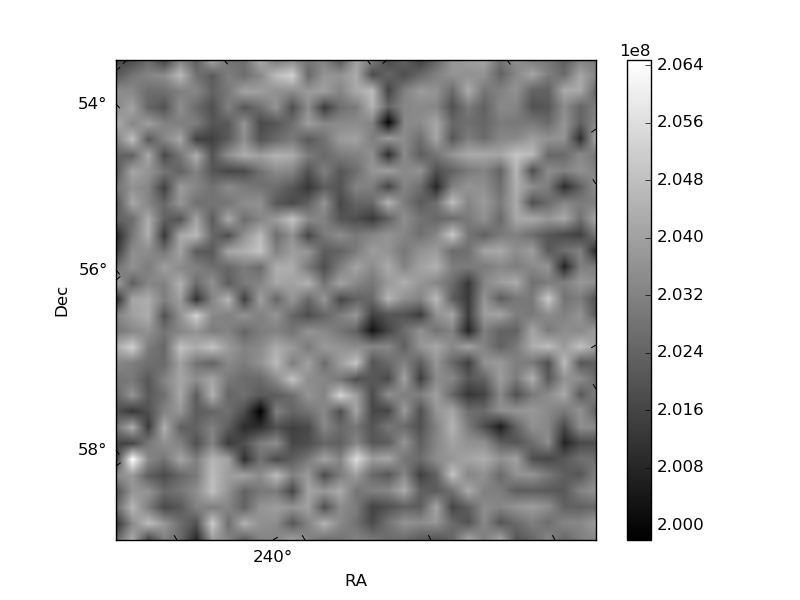
Quadrant B |
|---|---|---|---|
| Quadrant D | 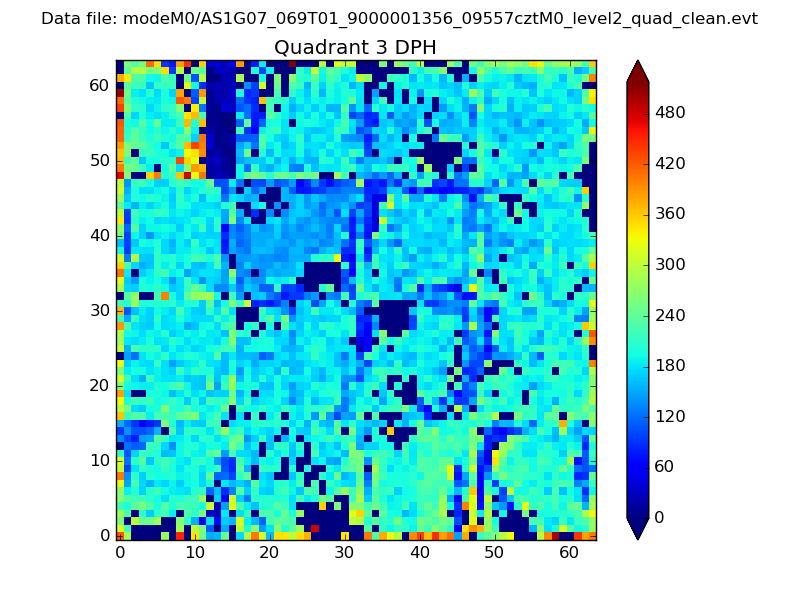 |
 |
Quadrant C |
| Plot type | Count rate plots | Images |
|---|---|---|
| Comparison with Poisson distribution Blue bars denote a histogram of data divided into 1 sec bins. Red curve is a Poisson curve with rate = median count rate of data. |
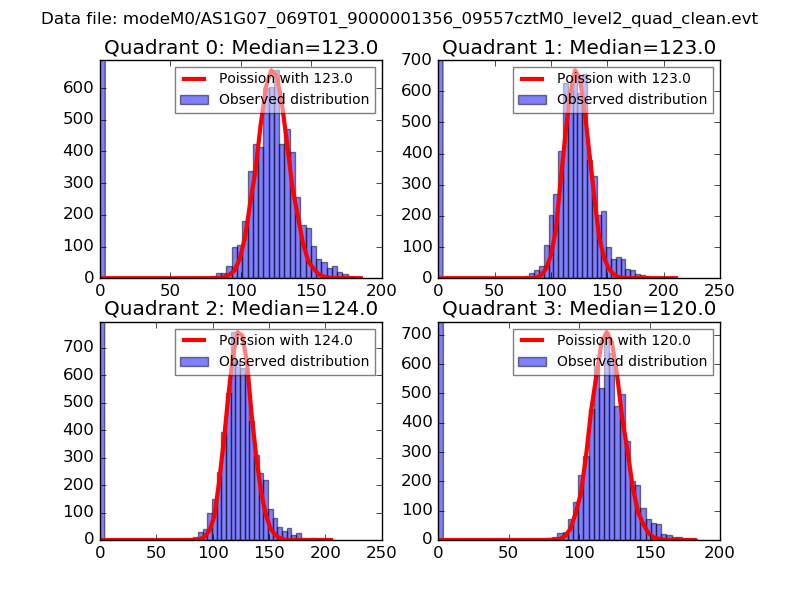 |
 |
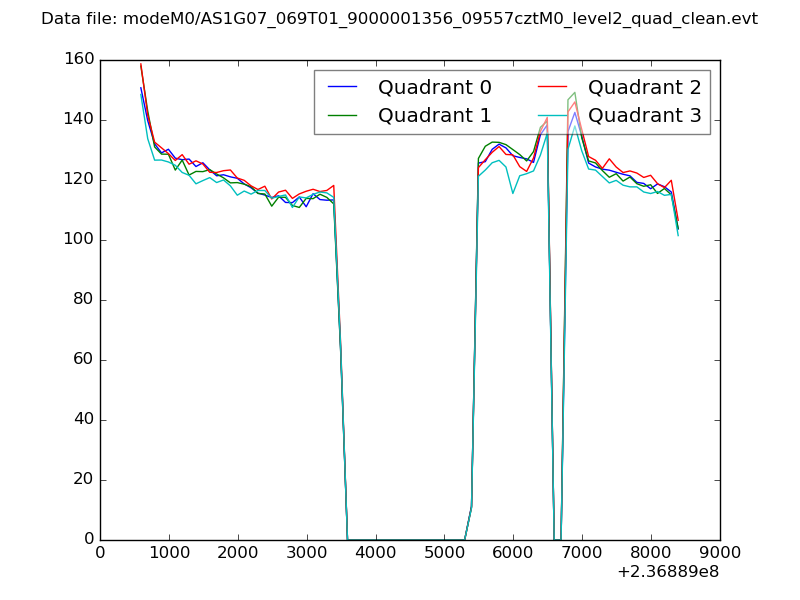
| Quadrant-wise count rates Data is divided into 100 sec bins |
 |
|
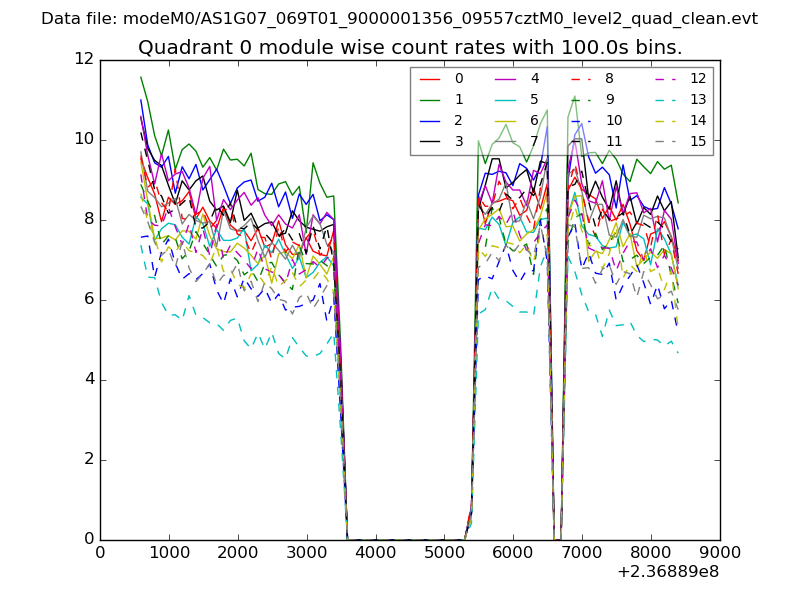
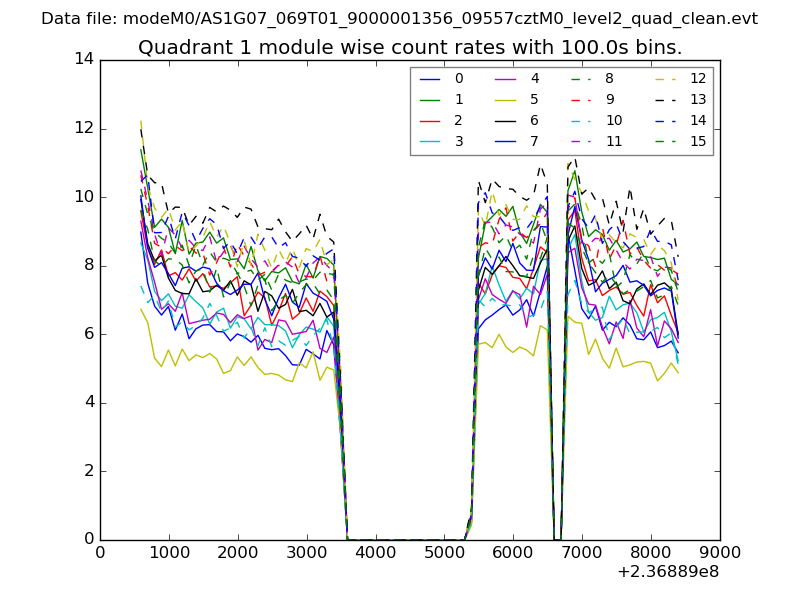
| Module-wise count rates for Quadrant A Data is divided into 100 sec bins |
 |
 |
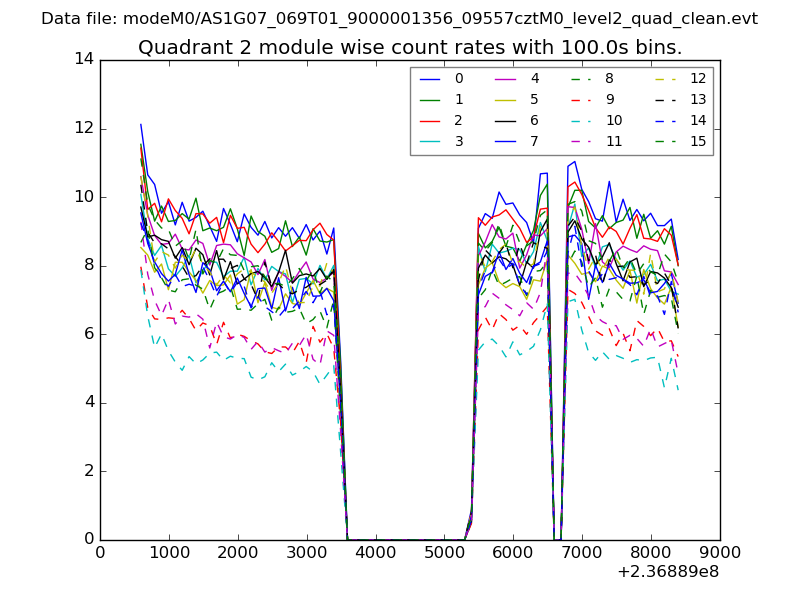
| Module-wise count rates for Quadrant B Data is divided into 100 sec bins |
 |
 |
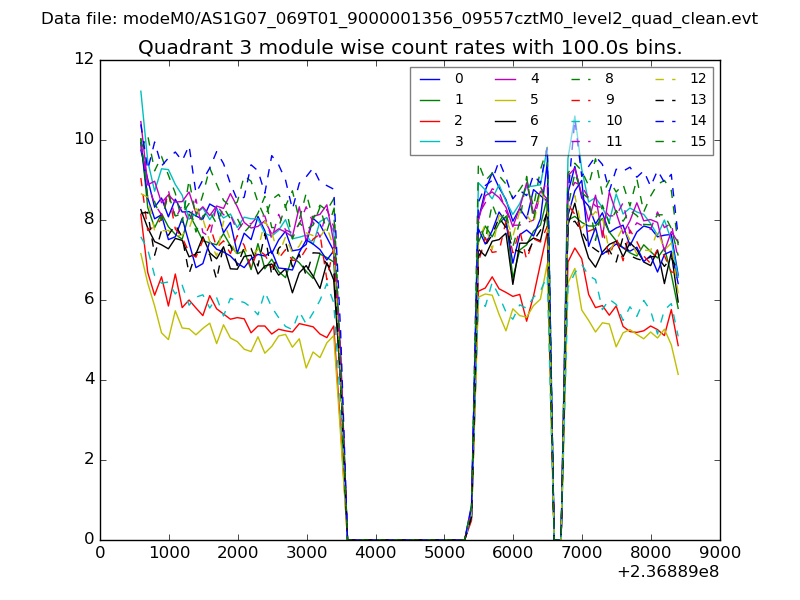
| Module-wise count rates for Quadrant C Data is divided into 100 sec bins |
 |
 |
| Module-wise count rates for Quadrant D Data is divided into 100 sec bins |
 |
 |
| Parameter | Plot |
|---|---|
| CZT HV Monitor | 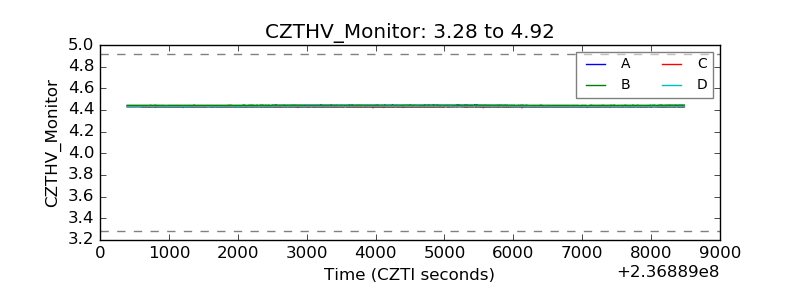 |
| D_VDD | 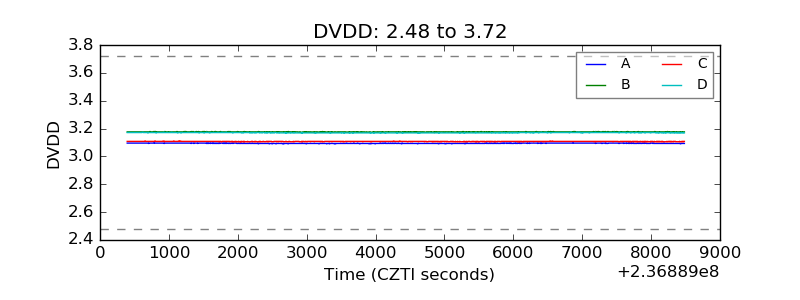 |
| Temperature 1 | 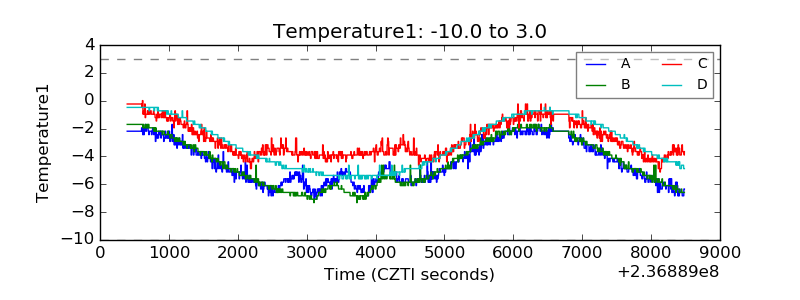 |
| Veto HV Monitor | 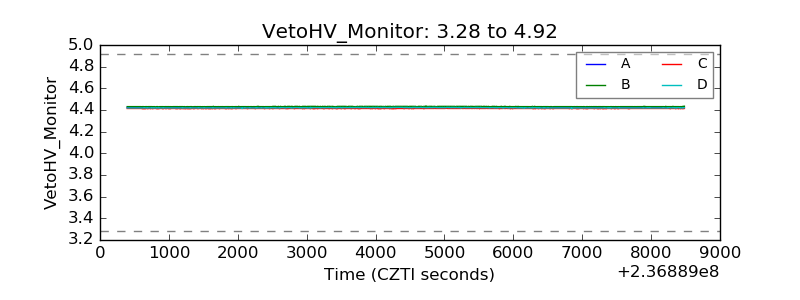 |
| Veto LLD | 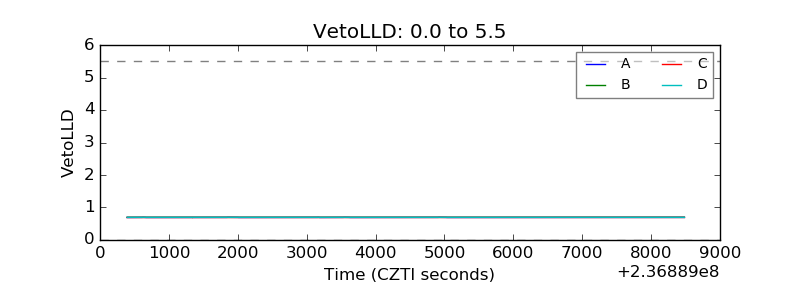 |
| Alpha Counter | 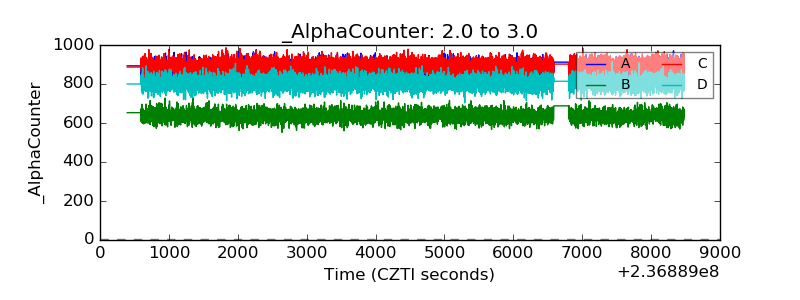 |
| _CPM_Rate | 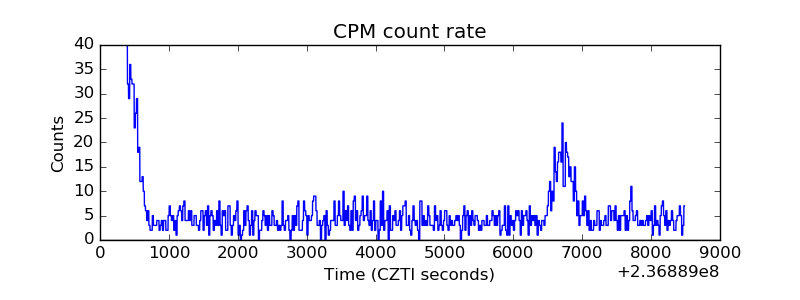 |
| CZT Counter |  |
| +2.5 Volts monitor |  |
| +5 Volts monitor |  |
| _ROLL_ROT | 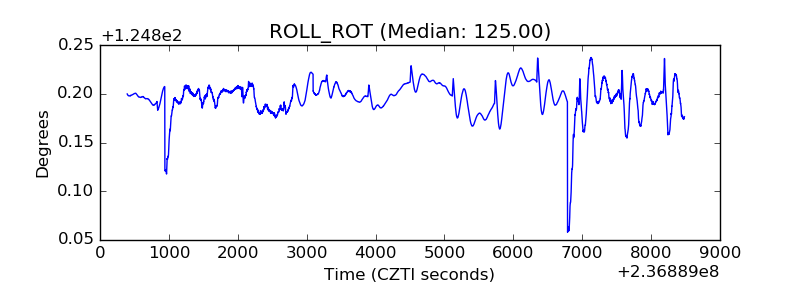 |
| _Roll_DEC | 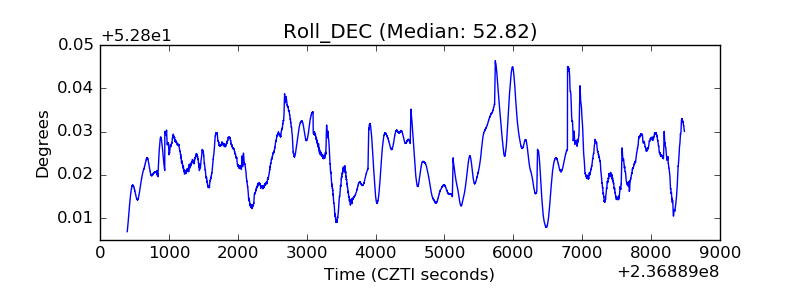 |
| _Roll_RA |  |
| Veto Counter | 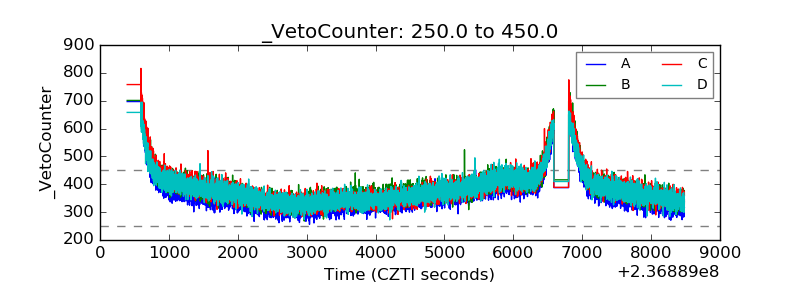 |