| Param | Original file | Final file |
|---|---|---|
| Filename | modeM0/AS1G07_069T01_9000001356_09561cztM0_level2.evt | modeM0/AS1G07_069T01_9000001356_09561cztM0_level2_quad_clean.evt |
| Size (bytes) | 1,176,269,760 | 236,900,160 |
| Size | 1.1 GB | 225.9 MB |
| Events in quadrant A | 8,610,739 | 1,483,573 |
| Events in quadrant B | 8,804,196 | 1,483,106 |
| Events in quadrant C | 8,109,804 | 1,487,956 |
| Events in quadrant D | 8,852,405 | 1,452,096 |
| Mode SS | |||
|---|---|---|---|
| Quadrant | BADHDUFLAG | Total packets | Discarded packets |
| A | 0 | 384 | 8 |
| B | 0 | 384 | 12 |
| C | 0 | 384 | 2 |
| D | 0 | 384 | 14 |
| Mode M9 | |||
|---|---|---|---|
| Quadrant | BADHDUFLAG | Total packets | Discarded packets |
| A | 0 | 21 | 0 |
| B | 0 | 21 | 0 |
| C | 0 | 21 | 0 |
| D | 0 | 21 | 0 |
| Mode M0 | |||
|---|---|---|---|
| Quadrant | BADHDUFLAG | Total packets | Discarded packets |
| A | 0 | 38624 | 395 |
| B | 0 | 39481 | 438 |
| C | 0 | 37751 | 413 |
| D | 0 | 39956 | 476 |
| Quadrant | Total seconds | Saturated seconds | Saturation percentage |
|---|---|---|---|
| A | 18436 | 86 | 0.466479% |
| B | 18404 | 115 | 0.624864% |
| C | 18415 | 29 | 0.157480% |
| D | 18394 | 107 | 0.581711% |
Noise dominated data is calculated using 1-second bins in cleaned event files. If a bin has >2000 counts, and if more than 50% of those come from <1% of pixels, then it is considered to be noise-dominated and hence unusable.
| Quadrant | # 1 sec bins | Bins with >0 counts | Bins with >2000 counts | High rate bins dominated by noise | Noise dominated (total time) | Noise dominated (detector-on time) | Marked lightcurve |
|---|---|---|---|---|---|---|---|
| A | 20836 | 18597 | 0 | 0 | 0.00% | 0.00% | 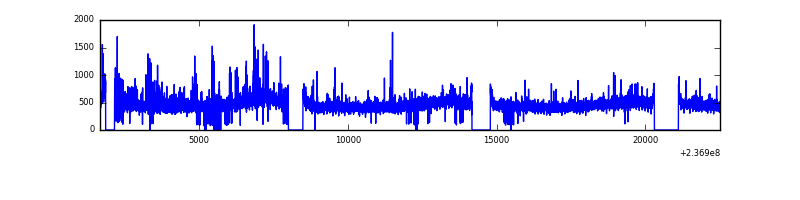 |
| B | 20836 | 18590 | 28 | 28 | 0.13% | 0.15% | 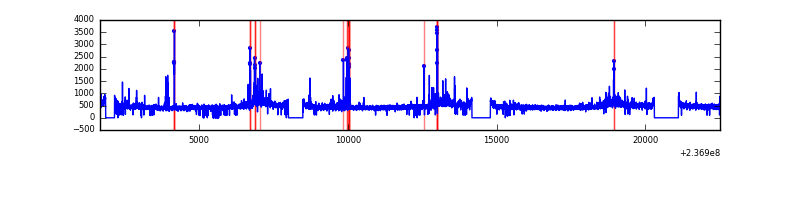 |
| C | 20836 | 18597 | 0 | 0 | 0.00% | 0.00% | 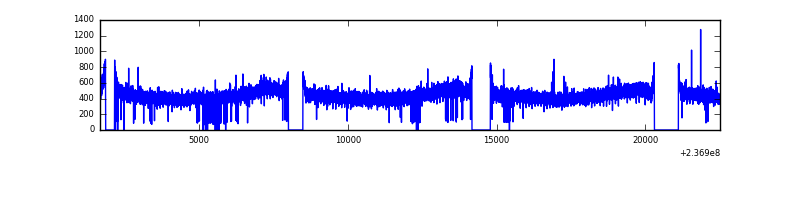 |
| D | 20836 | 18593 | 68 | 68 | 0.33% | 0.37% | 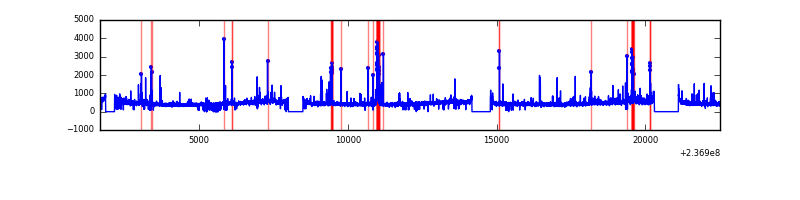 |
Top three noisy pixels from each quadrant. If the there are fewer than three noisy pixels in the level2.evt file, extra rows are filled as -1
| Pixel properties | Quadrant properties | ||||||
|---|---|---|---|---|---|---|---|
| Quadrant | DetID | PixID | Counts | Sigma | Mean | Median | Sigma |
| A | 1 | 162 | 226471 | 516.55 | 2124 | 2069 | 434.4 |
| A | 1 | 178 | 78609 | 176.19 | 2124 | 2069 | 434.4 |
| A | 1 | 161 | 78406 | 175.72 | 2124 | 2069 | 434.4 |
| B | 0 | 214 | 135690 | 333.03 | 2122 | 2068 | 401.2 |
| B | 4 | 80 | 109327 | 267.32 | 2122 | 2068 | 401.2 |
| B | 0 | 187 | 84949 | 206.57 | 2122 | 2068 | 401.2 |
| C | 13 | 61 | 15477 | 27.82 | 2077 | 2084 | 481.4 |
| C | 9 | 68 | 8731 | 13.81 | 2077 | 2084 | 481.4 |
| C | 12 | 4 | 6177 | 8.5 | 2077 | 2084 | 481.4 |
| D | 1 | 52 | 340330 | 672.71 | 2056 | 2007 | 502.9 |
| D | 12 | 233 | 258562 | 510.12 | 2056 | 2007 | 502.9 |
| D | 8 | 195 | 152252 | 298.74 | 2056 | 2007 | 502.9 |
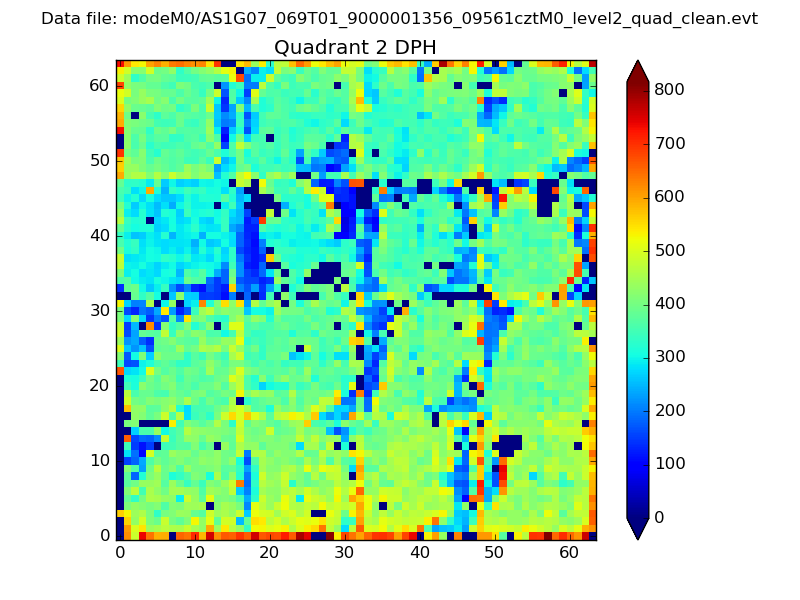
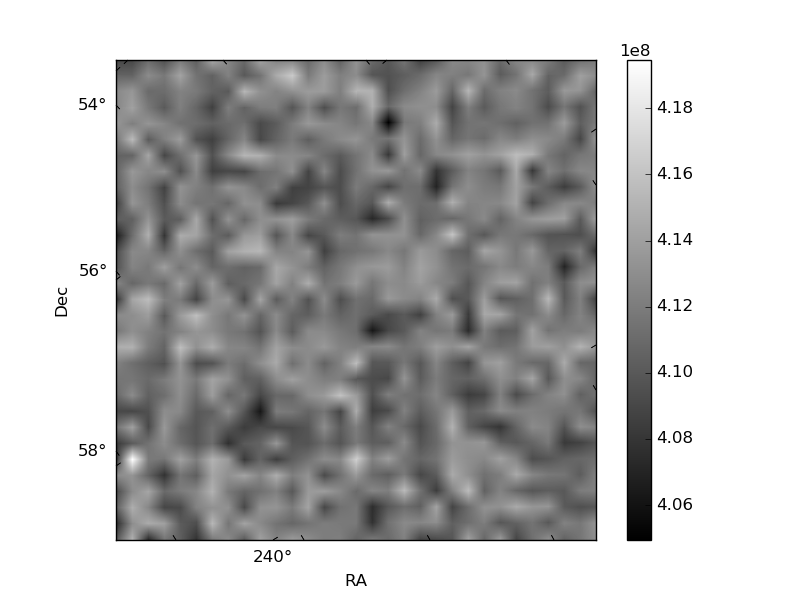
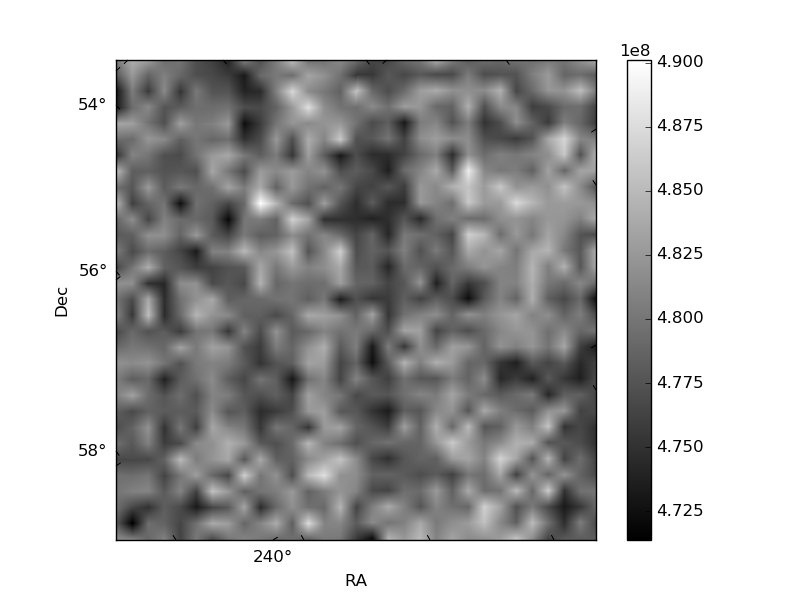
Histogram calculated using DETX and DETY for each event in the final _common_clean file
| Quadrant A |  |
 |
Quadrant B |
|---|---|---|---|
| Quadrant D | 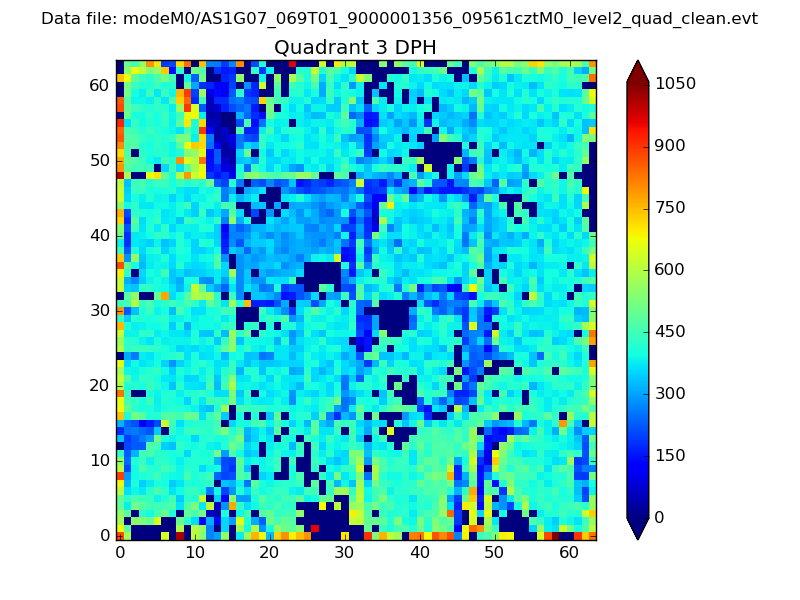 |
 |
Quadrant C |
| Plot type | Count rate plots | Images |
|---|---|---|
| Comparison with Poisson distribution Blue bars denote a histogram of data divided into 1 sec bins. Red curve is a Poisson curve with rate = median count rate of data. |
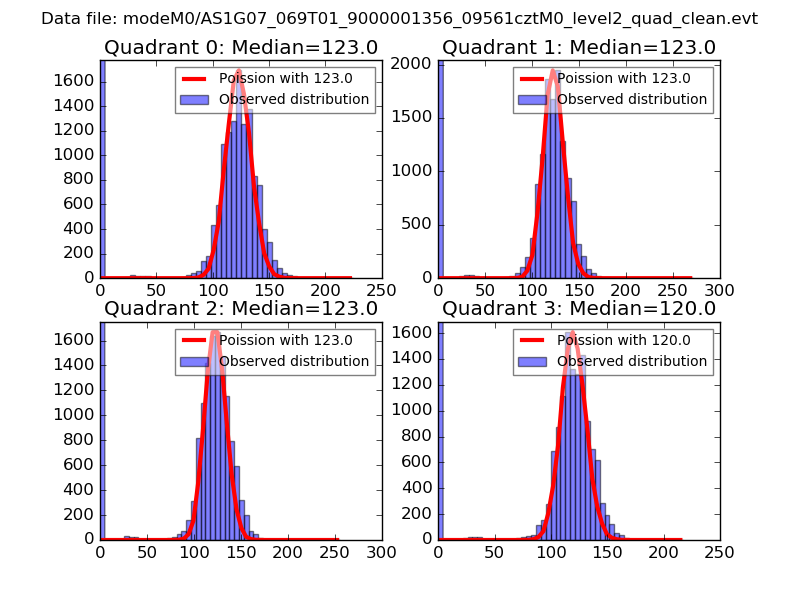 |
 |
| Quadrant-wise count rates Data is divided into 100 sec bins |
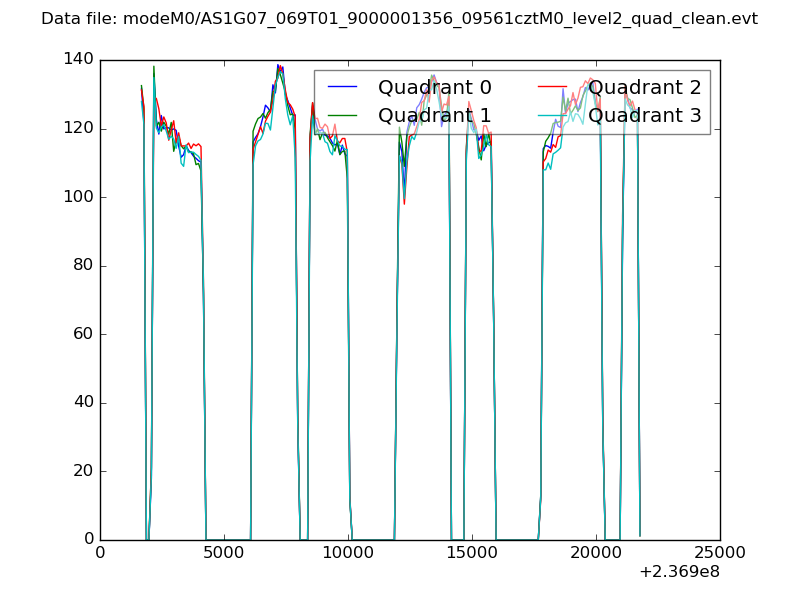 |
|
| Module-wise count rates for Quadrant A Data is divided into 100 sec bins |
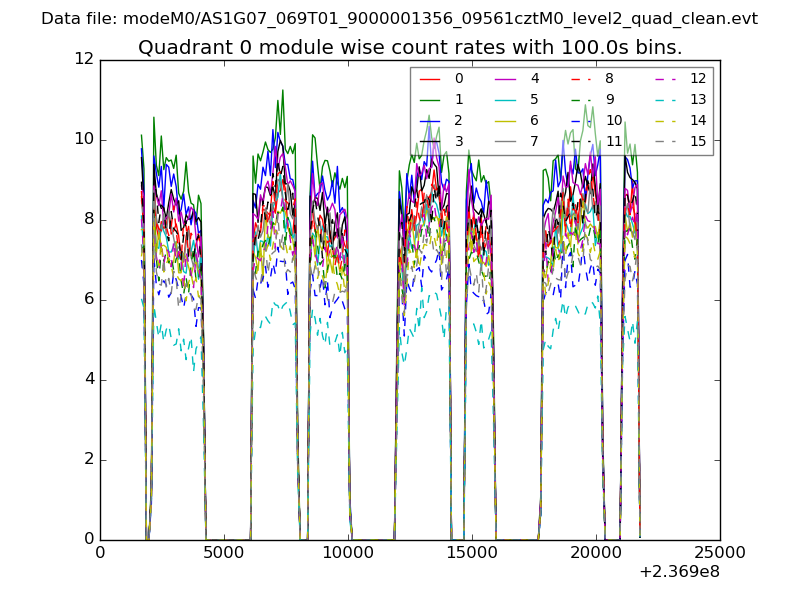 |
 |
| Module-wise count rates for Quadrant B Data is divided into 100 sec bins |
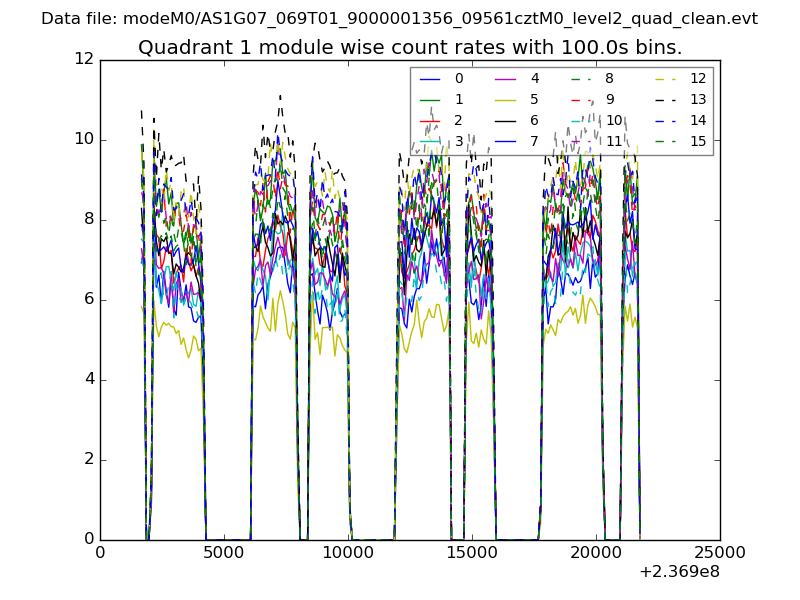 |
 |
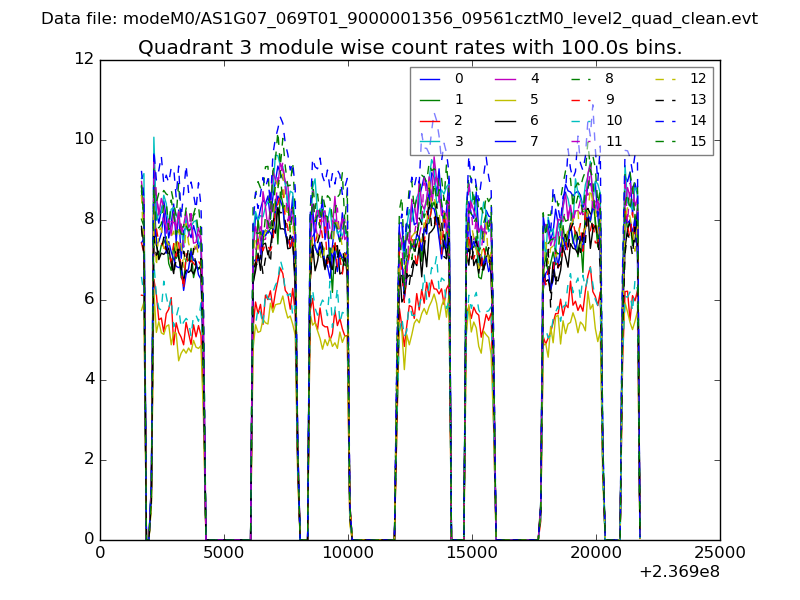
| Module-wise count rates for Quadrant C Data is divided into 100 sec bins |
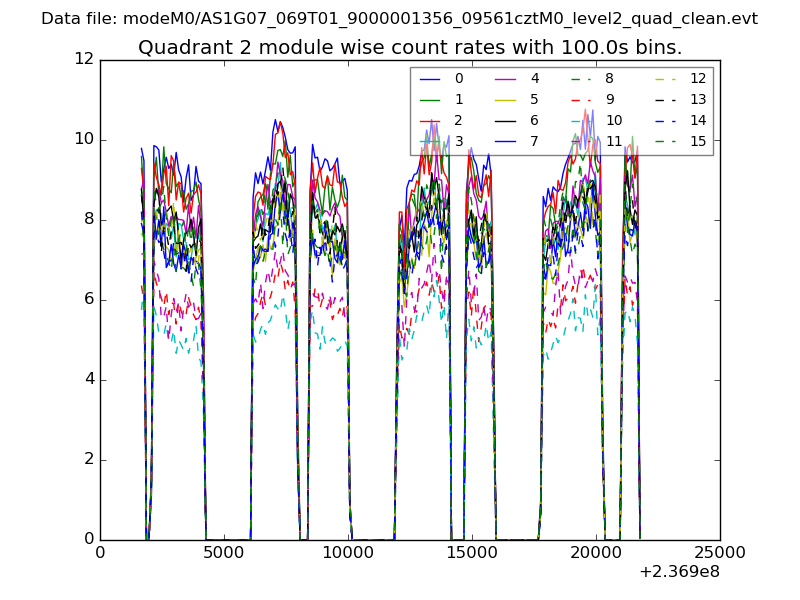 |
 |
| Module-wise count rates for Quadrant D Data is divided into 100 sec bins |
 |
 |
| Parameter | Plot |
|---|---|
| CZT HV Monitor | 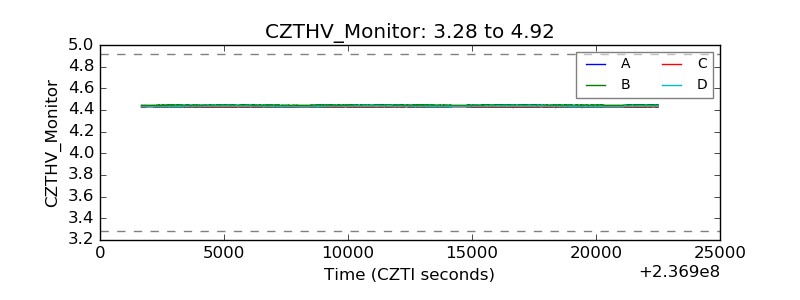 |
| D_VDD | 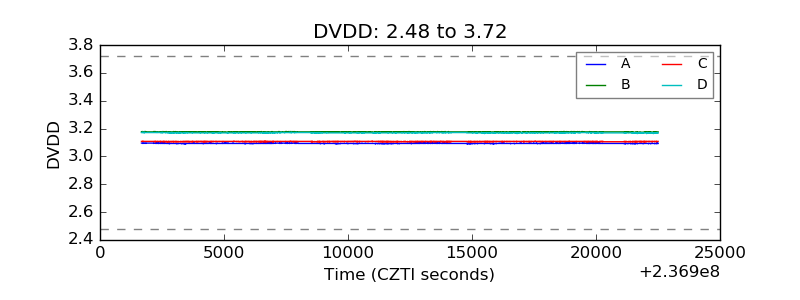 |
| Temperature 1 | 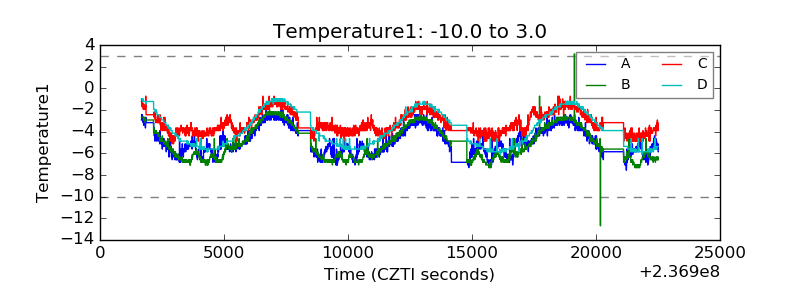 |
| Veto HV Monitor | 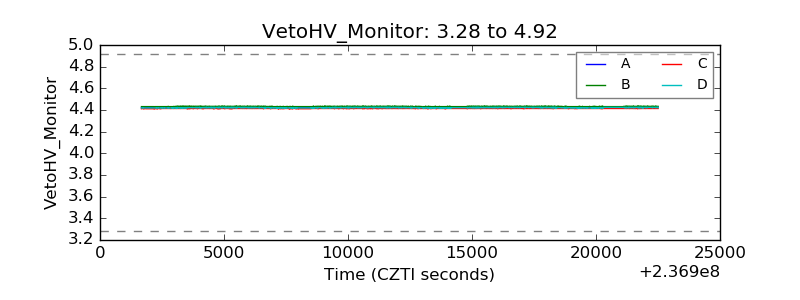 |
| Veto LLD | 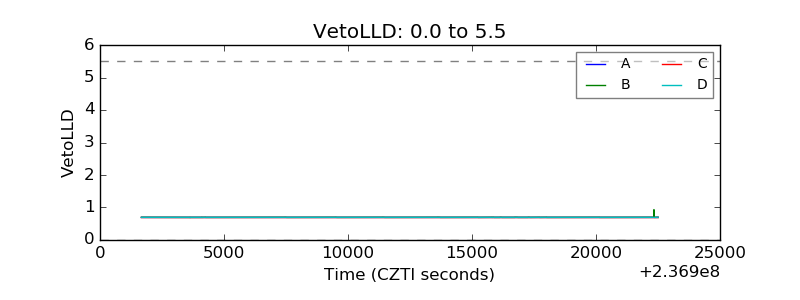 |
| Alpha Counter | 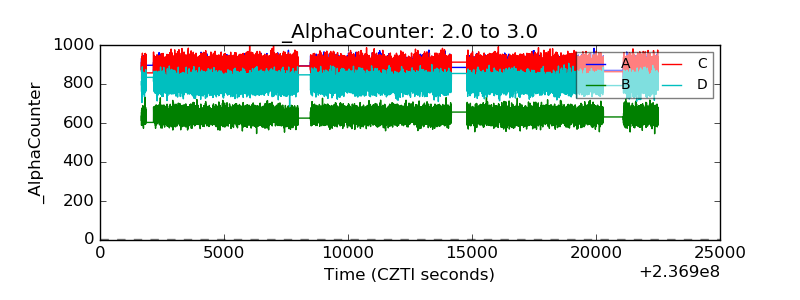 |
| _CPM_Rate | 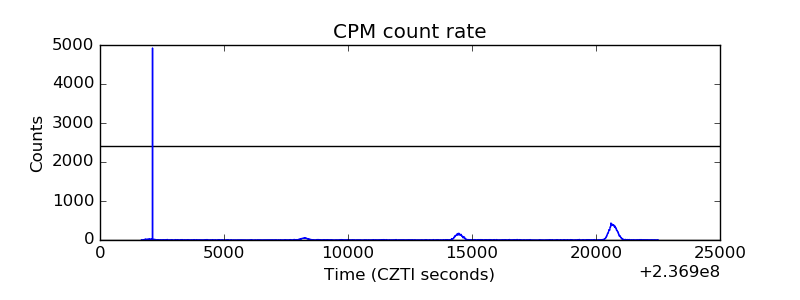 |
| CZT Counter | 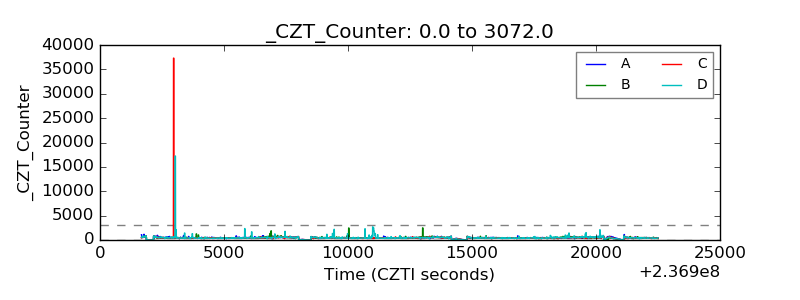 |
| +2.5 Volts monitor |  |
| +5 Volts monitor |  |
| _ROLL_ROT | 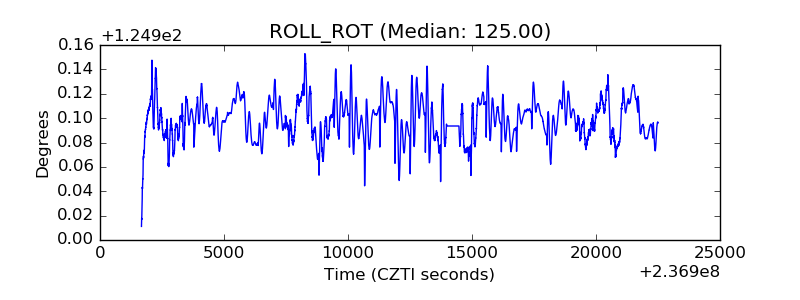 |
| _Roll_DEC | 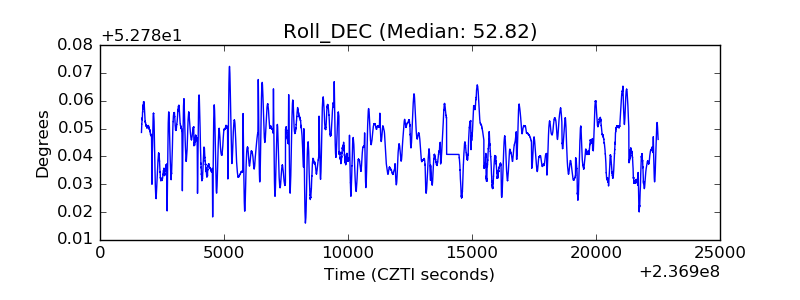 |
| _Roll_RA |  |
| Veto Counter | 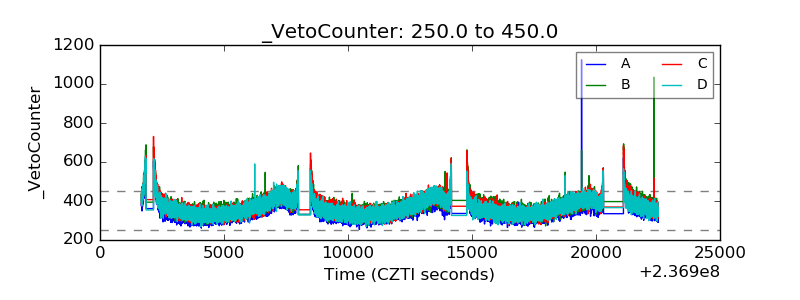 |