| Param | Original file | Final file |
|---|---|---|
| Filename | modeM0/AS1G07_069T01_9000001356_09562cztM0_level2.evt | modeM0/AS1G07_069T01_9000001356_09562cztM0_level2_quad_clean.evt |
| Size (bytes) | 386,484,480 | 68,276,160 |
| Size | 368.6 MB | 65.1 MB |
| Events in quadrant A | 2,716,542 | 424,835 |
| Events in quadrant B | 2,735,826 | 424,132 |
| Events in quadrant C | 2,595,340 | 424,452 |
| Events in quadrant D | 3,269,996 | 397,169 |
| Mode SS | |||
|---|---|---|---|
| Quadrant | BADHDUFLAG | Total packets | Discarded packets |
| A | 0 | 138 | 26 |
| B | 0 | 137 | 16 |
| C | 0 | 138 | 22 |
| D | 0 | 138 | 26 |
| Mode M9 | |||
|---|---|---|---|
| Quadrant | BADHDUFLAG | Total packets | Discarded packets |
| A | 0 | 18 | 2 |
| B | 0 | 18 | 0 |
| C | 0 | 18 | 3 |
| D | 0 | 18 | 0 |
| Mode M0 | |||
|---|---|---|---|
| Quadrant | BADHDUFLAG | Total packets | Discarded packets |
| A | 0 | 13875 | 2136 |
| B | 0 | 14007 | 2211 |
| C | 0 | 13741 | 2121 |
| D | 0 | 16316 | 2867 |
| Quadrant | Total seconds | Saturated seconds | Saturation percentage |
|---|---|---|---|
| A | 5714 | 69 | 1.207560% |
| B | 5678 | 73 | 1.285664% |
| C | 5711 | 48 | 0.840483% |
| D | 5583 | 152 | 2.722551% |
Noise dominated data is calculated using 1-second bins in cleaned event files. If a bin has >2000 counts, and if more than 50% of those come from <1% of pixels, then it is considered to be noise-dominated and hence unusable.
| Quadrant | # 1 sec bins | Bins with >0 counts | Bins with >2000 counts | High rate bins dominated by noise | Noise dominated (total time) | Noise dominated (detector-on time) | Marked lightcurve |
|---|---|---|---|---|---|---|---|
| A | 8525 | 6281 | 0 | 0 | 0.00% | 0.00% | 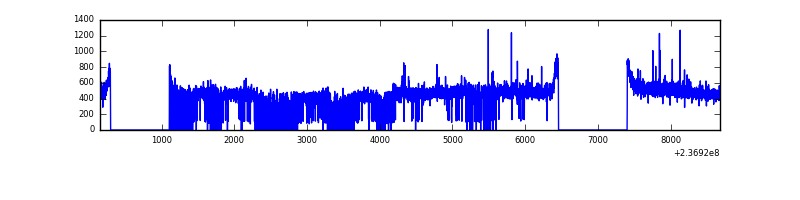 |
| B | 8525 | 6268 | 1 | 1 | 0.01% | 0.02% | 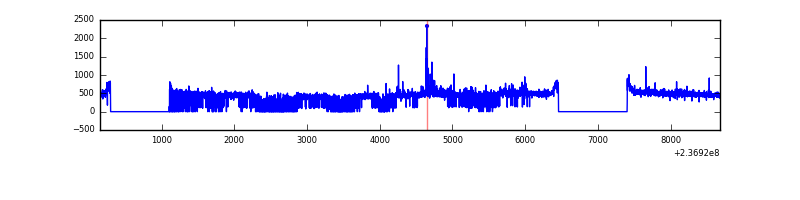 |
| C | 8525 | 6283 | 0 | 0 | 0.00% | 0.00% | 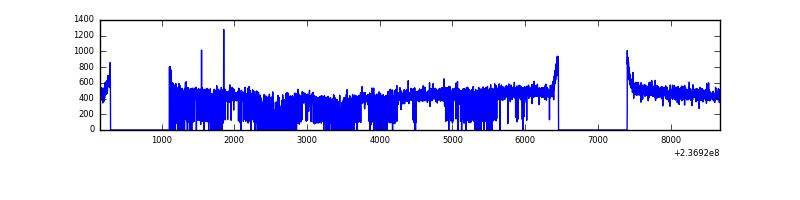 |
| D | 8525 | 6196 | 85 | 85 | 1.00% | 1.37% | 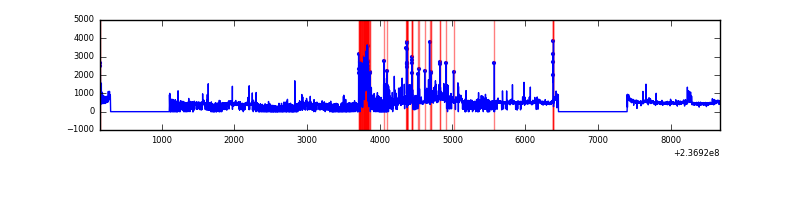 |
Top three noisy pixels from each quadrant. If the there are fewer than three noisy pixels in the level2.evt file, extra rows are filled as -1
| Pixel properties | Quadrant properties | ||||||
|---|---|---|---|---|---|---|---|
| Quadrant | DetID | PixID | Counts | Sigma | Mean | Median | Sigma |
| A | 1 | 162 | 53352 | 376.51 | 683 | 668 | 139.9 |
| A | 1 | 178 | 15002 | 102.44 | 683 | 668 | 139.9 |
| A | 1 | 161 | 14662 | 100.01 | 683 | 668 | 139.9 |
| B | 0 | 214 | 40316 | 304.84 | 679 | 661 | 130.1 |
| B | 4 | 80 | 16361 | 120.69 | 679 | 661 | 130.1 |
| B | 12 | 111 | 14844 | 109.03 | 679 | 661 | 130.1 |
| C | 13 | 61 | 5006 | 28.25 | 664 | 667 | 153.6 |
| C | 12 | 4 | 2019 | 8.8 | 664 | 667 | 153.6 |
| C | 3 | 202 | 1558 | 5.8 | 664 | 667 | 153.6 |
| D | 1 | 52 | 357992 | 2290.66 | 641 | 626 | 156.0 |
| D | 2 | 16 | 270530 | 1730.04 | 641 | 626 | 156.0 |
| D | 7 | 71 | 83905 | 533.81 | 641 | 626 | 156.0 |
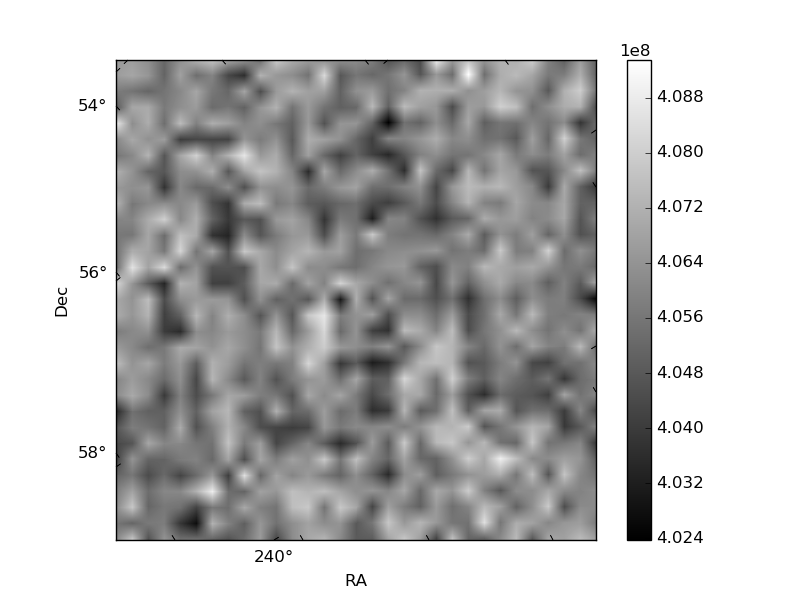
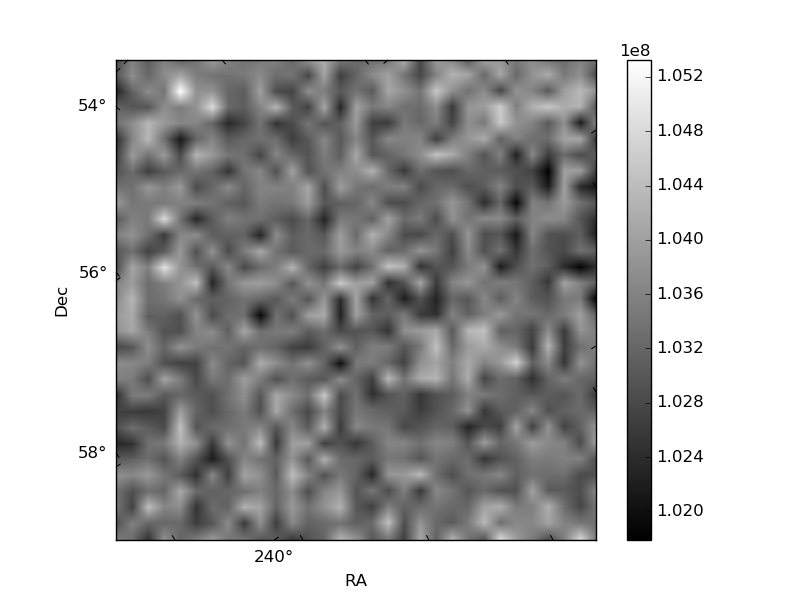
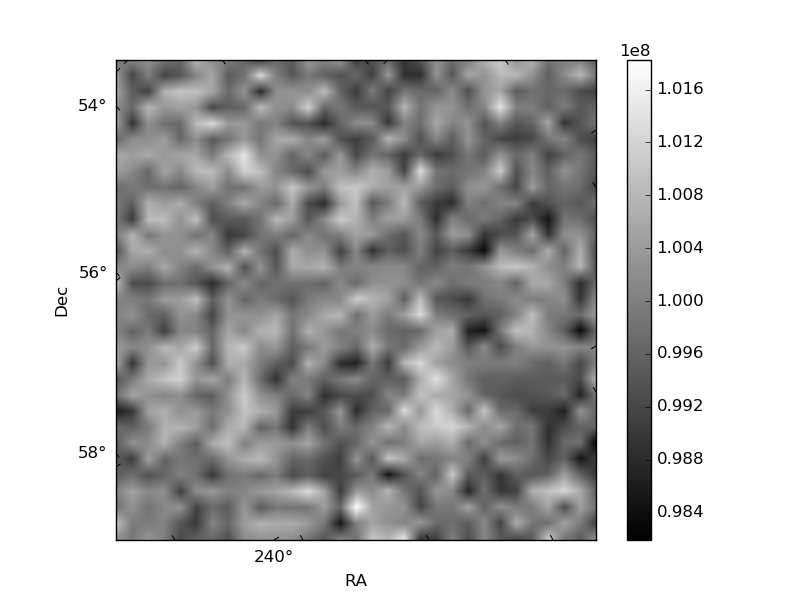
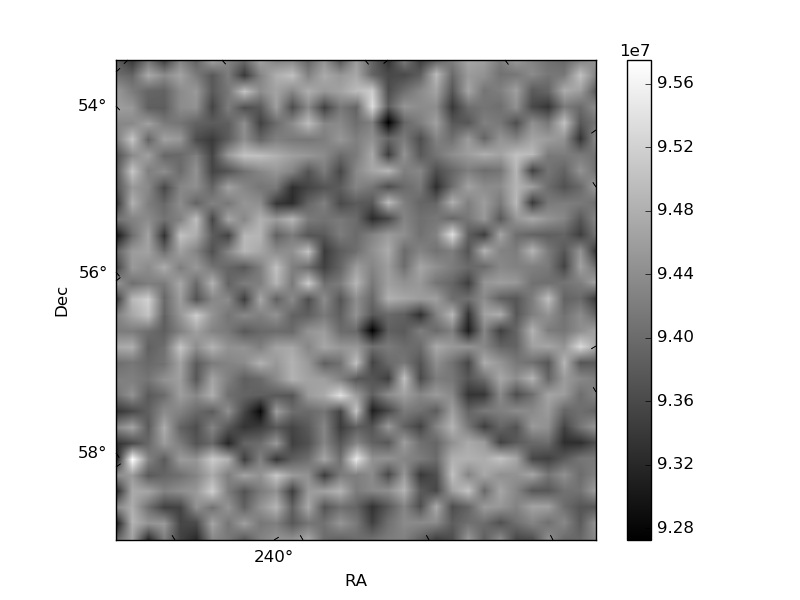
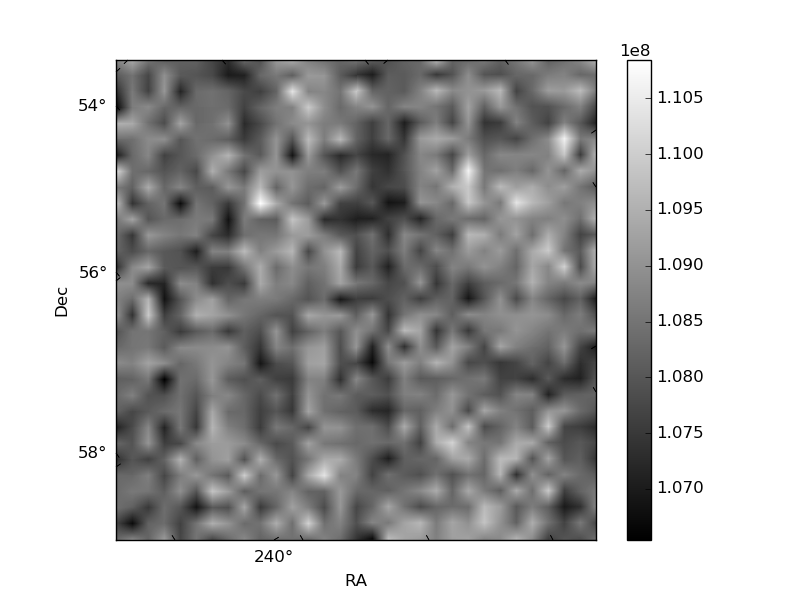
Histogram calculated using DETX and DETY for each event in the final _common_clean file
| Quadrant A | 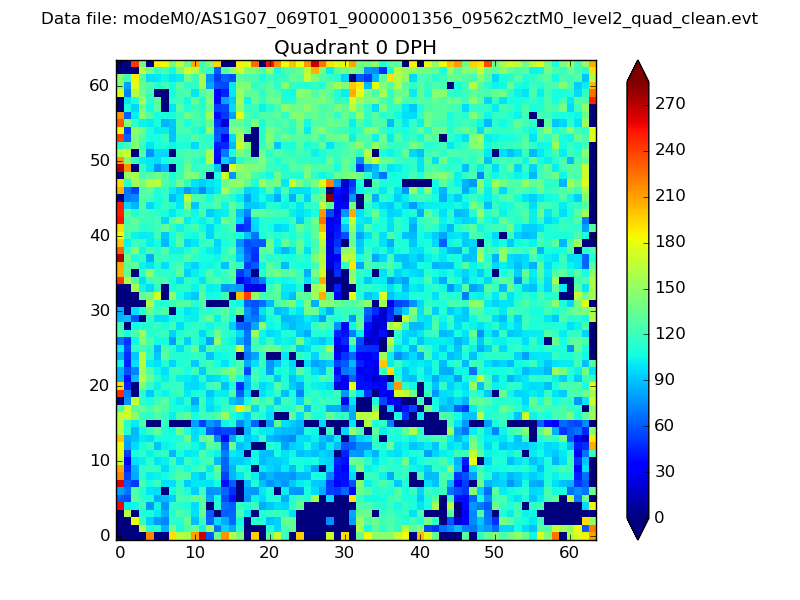 |
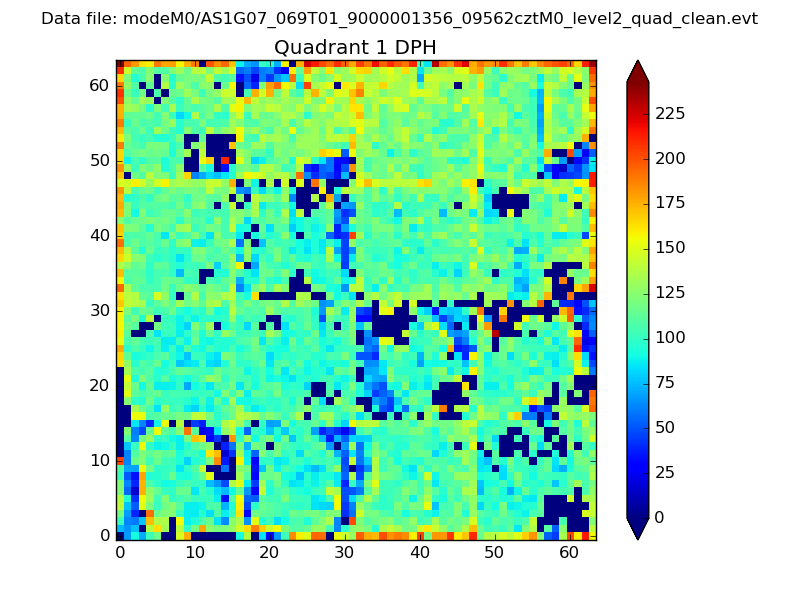 |
Quadrant B |
|---|---|---|---|
| Quadrant D |  |
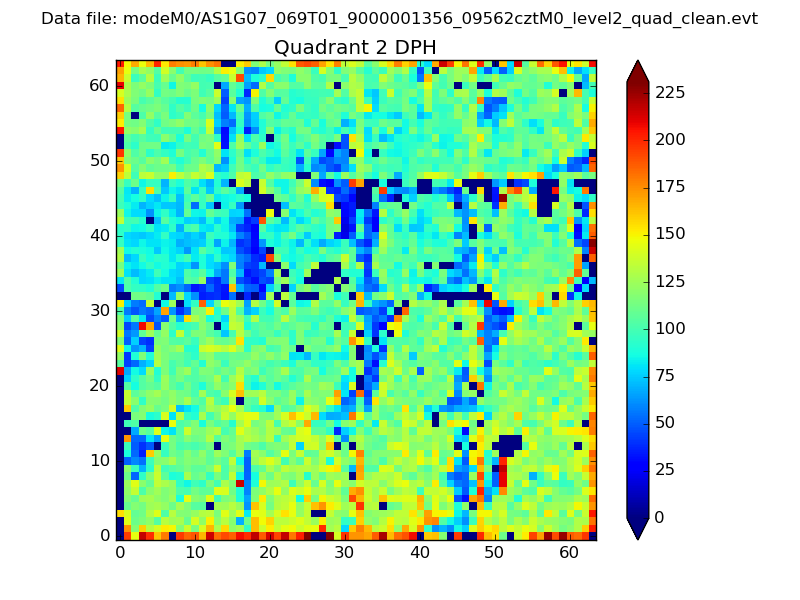 |
Quadrant C |
| Plot type | Count rate plots | Images |
|---|---|---|
| Comparison with Poisson distribution Blue bars denote a histogram of data divided into 1 sec bins. Red curve is a Poisson curve with rate = median count rate of data. |
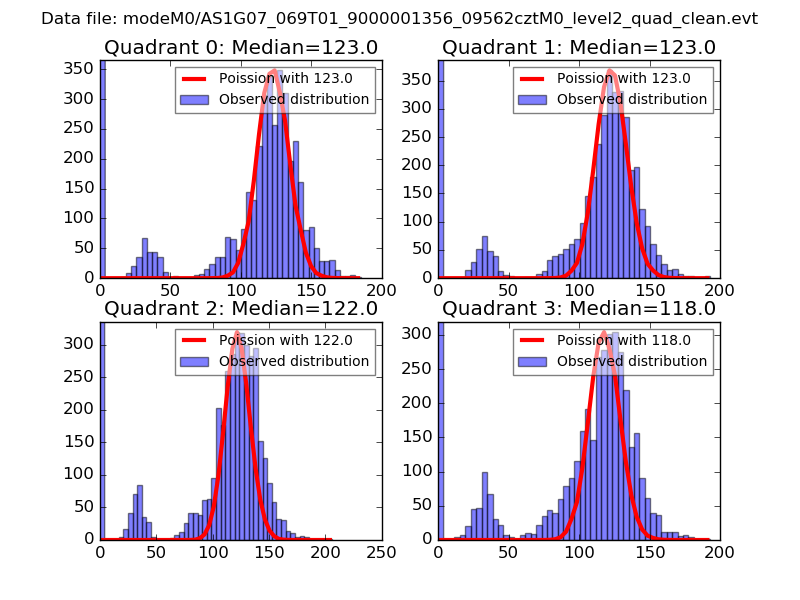 |
 |
| Quadrant-wise count rates Data is divided into 100 sec bins |
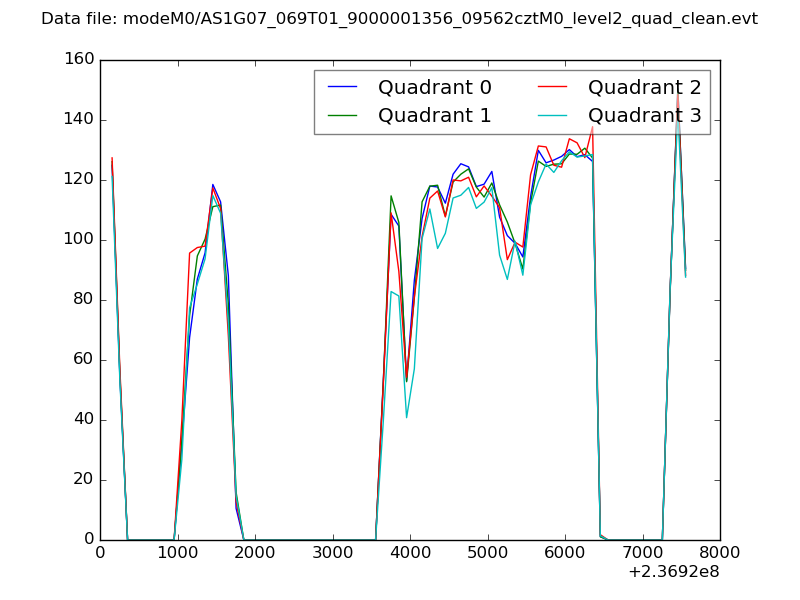 |
|
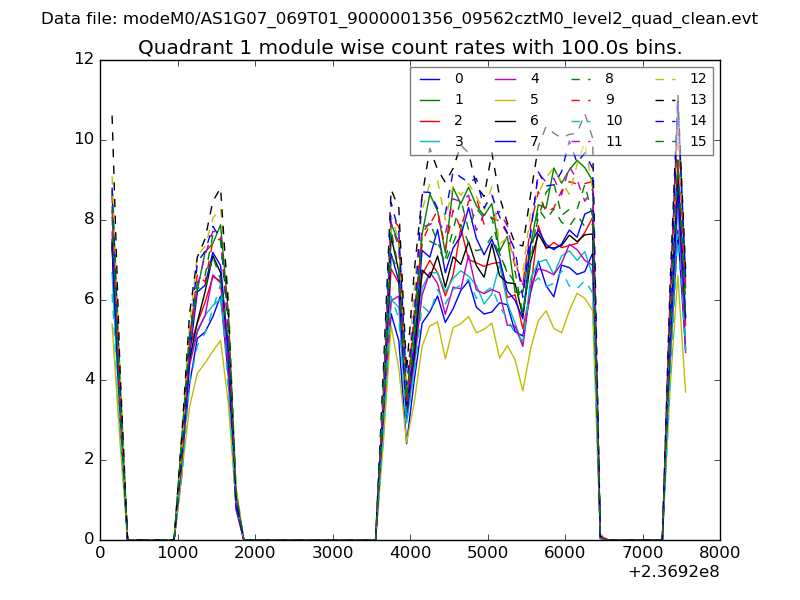
| Module-wise count rates for Quadrant A Data is divided into 100 sec bins |
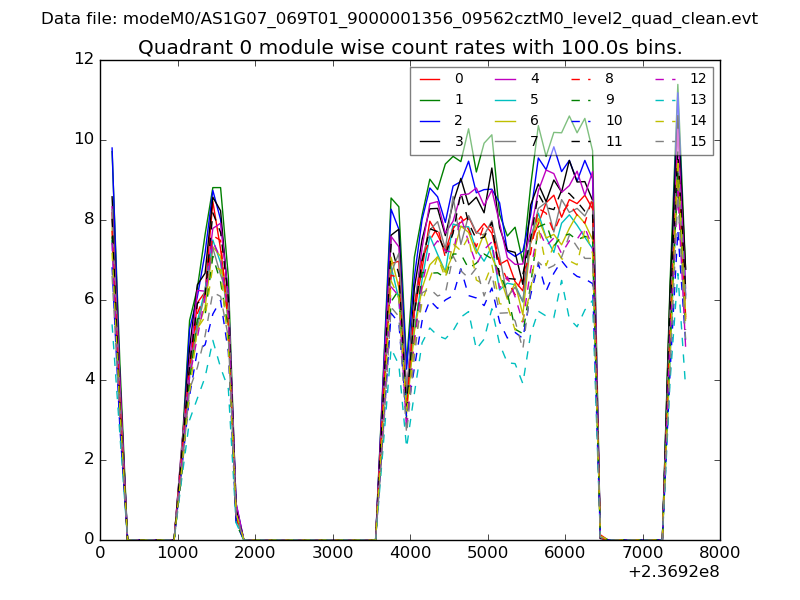 |
 |
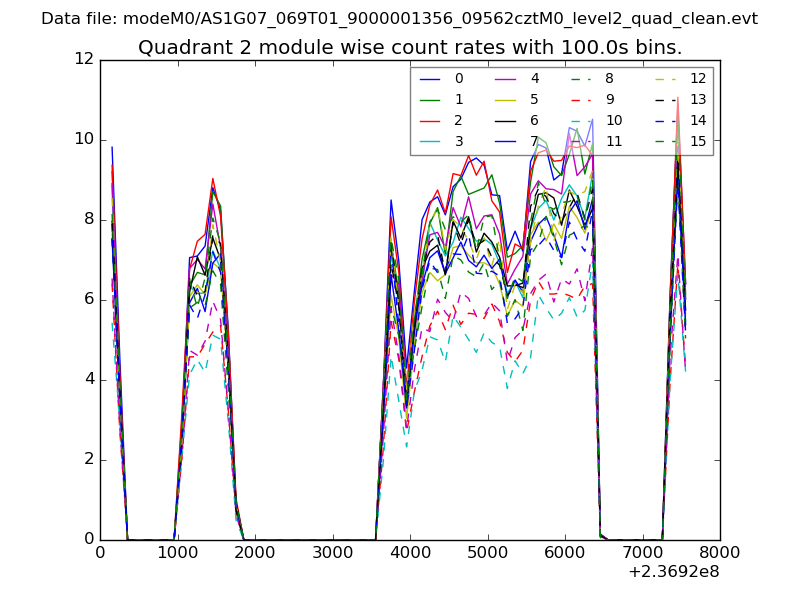
| Module-wise count rates for Quadrant B Data is divided into 100 sec bins |
 |
 |
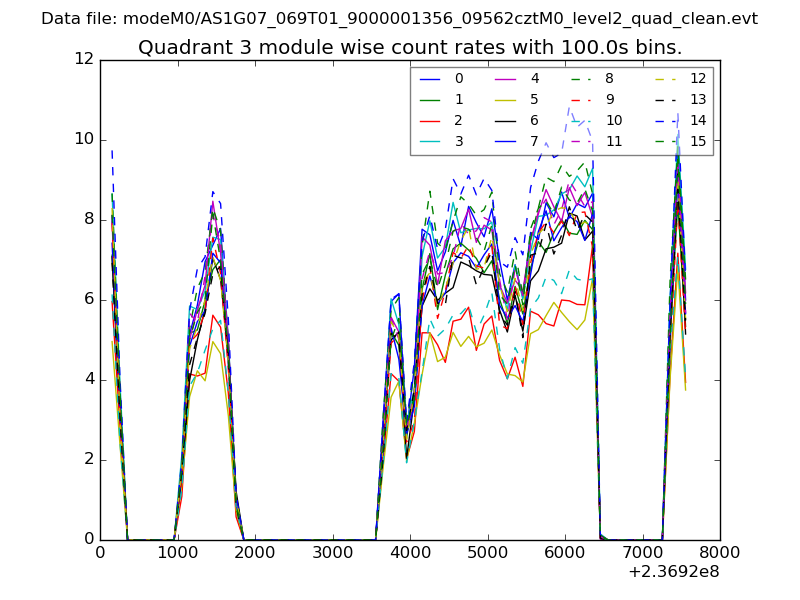
| Module-wise count rates for Quadrant C Data is divided into 100 sec bins |
 |
 |
| Module-wise count rates for Quadrant D Data is divided into 100 sec bins |
 |
 |
| Parameter | Plot |
|---|---|
| CZT HV Monitor | 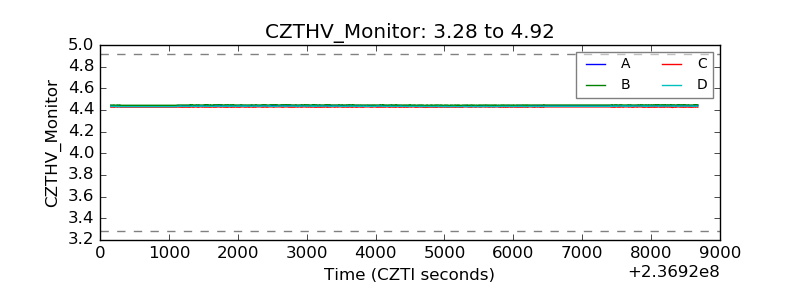 |
| D_VDD | 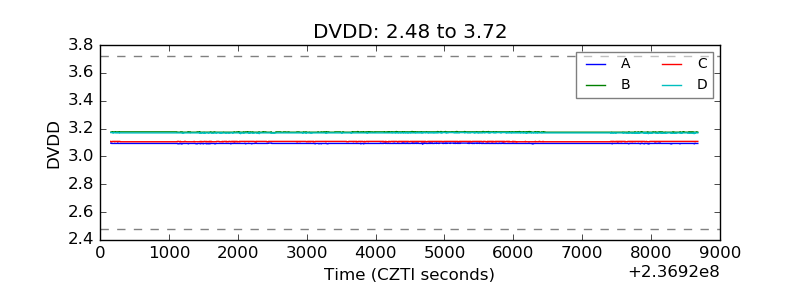 |
| Temperature 1 | 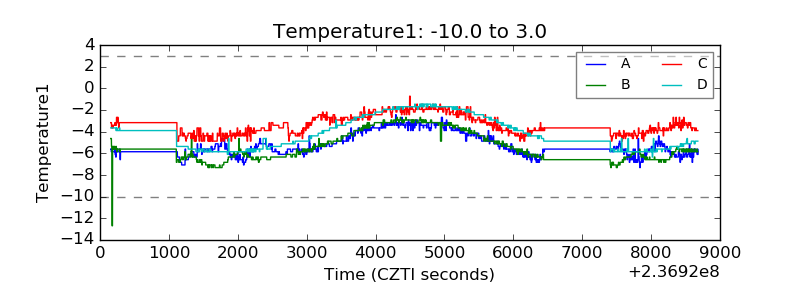 |
| Veto HV Monitor | 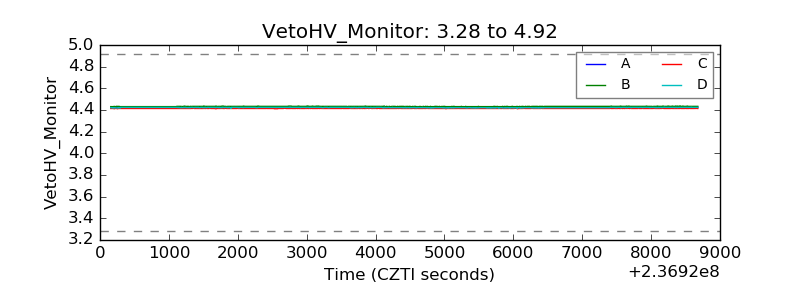 |
| Veto LLD | 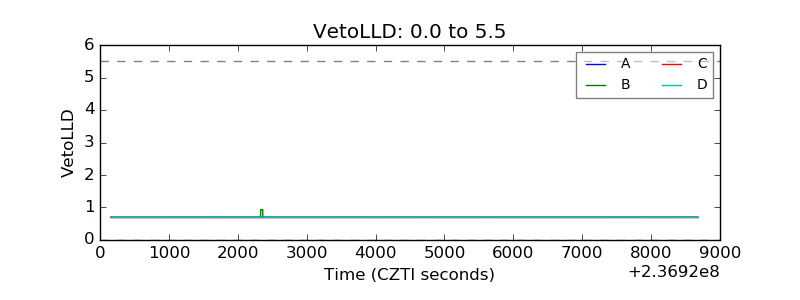 |
| Alpha Counter | 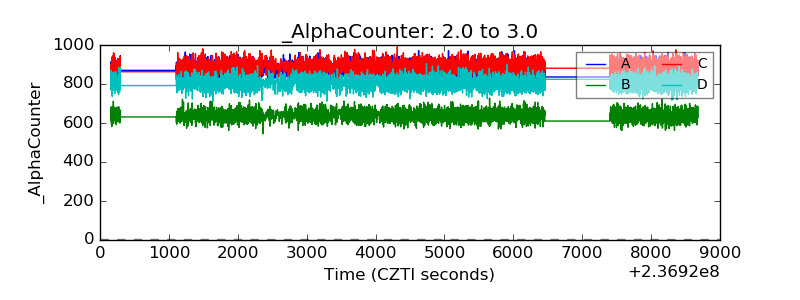 |
| _CPM_Rate | 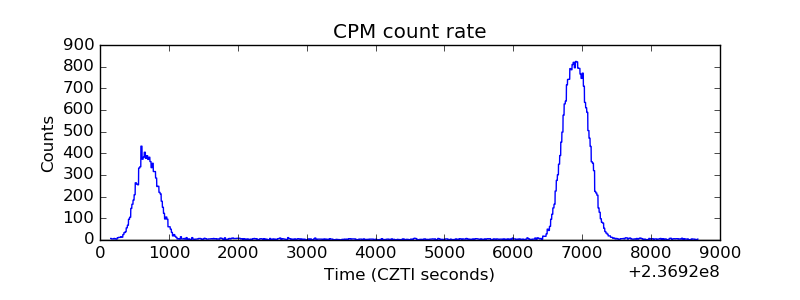 |
| CZT Counter | 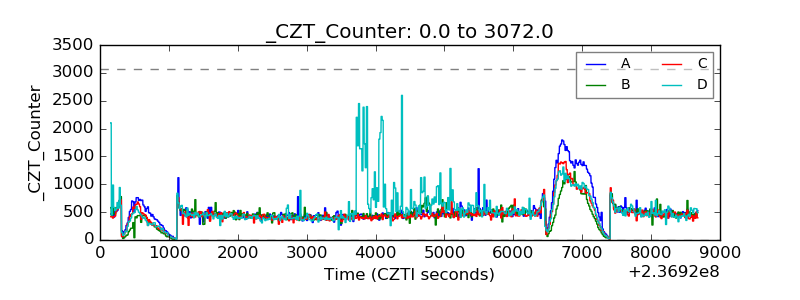 |
| +2.5 Volts monitor |  |
| +5 Volts monitor |  |
| _ROLL_ROT | 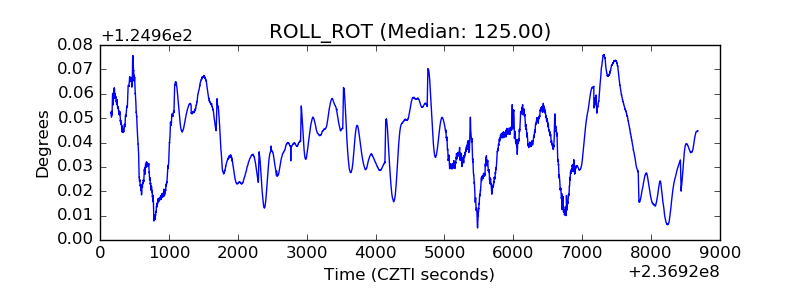 |
| _Roll_DEC | 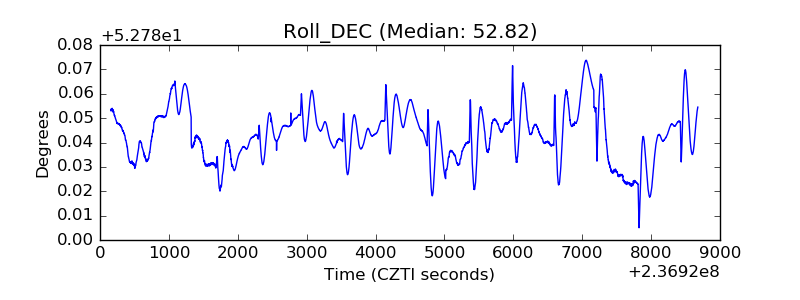 |
| _Roll_RA | 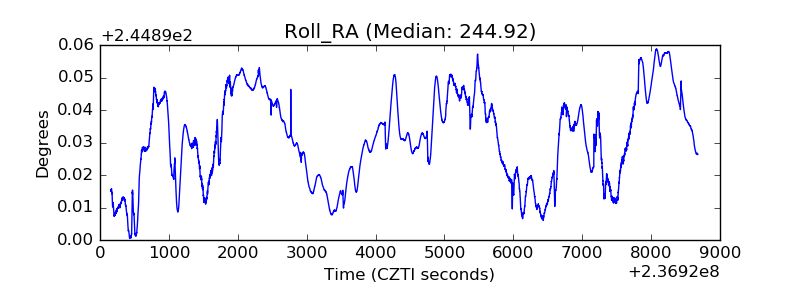 |
| Veto Counter | 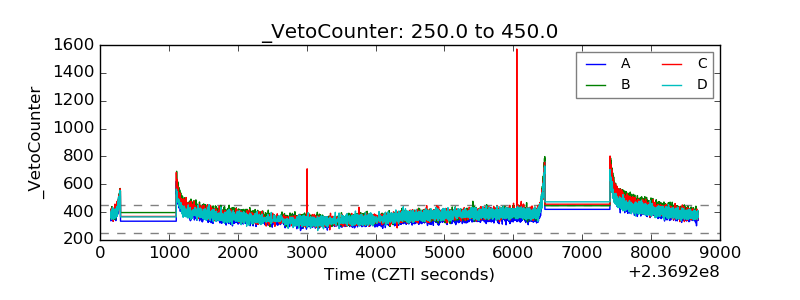 |