| Param | Original file | Final file |
|---|---|---|
| Filename | modeM0/AS1G07_069T01_9000001356_09564cztM0_level2.evt | modeM0/AS1G07_069T01_9000001356_09564cztM0_level2_quad_clean.evt |
| Size (bytes) | 748,278,720 | 122,950,080 |
| Size | 713.6 MB | 117.3 MB |
| Events in quadrant A | 5,359,277 | 747,848 |
| Events in quadrant B | 5,327,518 | 747,230 |
| Events in quadrant C | 5,009,348 | 743,083 |
| Events in quadrant D | 6,210,622 | 714,303 |
| Mode SS | |||
|---|---|---|---|
| Quadrant | BADHDUFLAG | Total packets | Discarded packets |
| A | 0 | 226 | 0 |
| B | 0 | 226 | 0 |
| C | 0 | 226 | 0 |
| D | 0 | 226 | 0 |
| Mode M9 | |||
|---|---|---|---|
| Quadrant | BADHDUFLAG | Total packets | Discarded packets |
| A | 0 | 21 | 0 |
| B | 0 | 21 | 0 |
| C | 0 | 21 | 0 |
| D | 0 | 21 | 0 |
| Mode M0 | |||
|---|---|---|---|
| Quadrant | BADHDUFLAG | Total packets | Discarded packets |
| A | 0 | 23253 | 51 |
| B | 0 | 23142 | 58 |
| C | 0 | 22707 | 52 |
| D | 0 | 26021 | 111 |
| Quadrant | Total seconds | Saturated seconds | Saturation percentage |
|---|---|---|---|
| A | 11142 | 119 | 1.068031% |
| B | 11138 | 123 | 1.104328% |
| C | 11141 | 80 | 0.718068% |
| D | 11138 | 259 | 2.325373% |
Noise dominated data is calculated using 1-second bins in cleaned event files. If a bin has >2000 counts, and if more than 50% of those come from <1% of pixels, then it is considered to be noise-dominated and hence unusable.
| Quadrant | # 1 sec bins | Bins with >0 counts | Bins with >2000 counts | High rate bins dominated by noise | Noise dominated (total time) | Noise dominated (detector-on time) | Marked lightcurve |
|---|---|---|---|---|---|---|---|
| A | 13201 | 11159 | 1 | 1 | 0.01% | 0.01% | 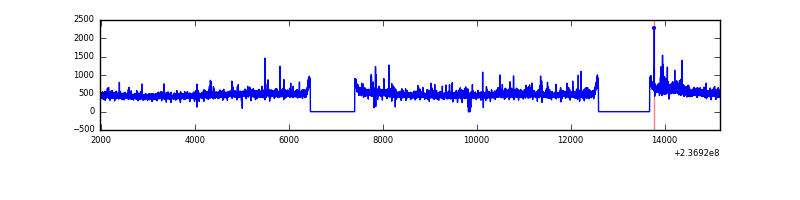 |
| B | 13201 | 11152 | 1 | 1 | 0.01% | 0.01% | 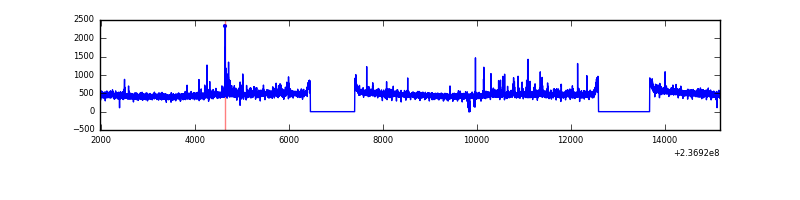 |
| C | 13201 | 11156 | 1 | 1 | 0.01% | 0.01% | 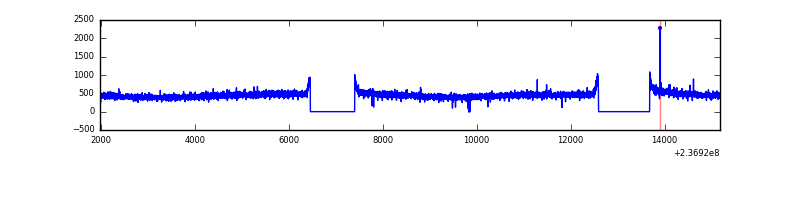 |
| D | 13201 | 11149 | 149 | 149 | 1.13% | 1.34% | 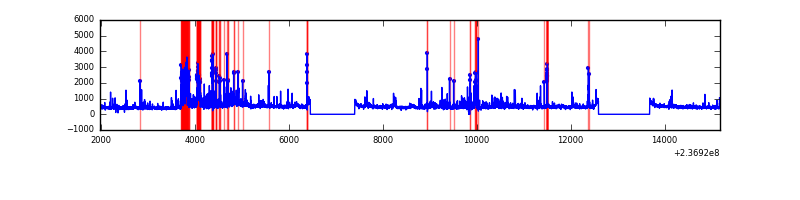 |
Top three noisy pixels from each quadrant. If the there are fewer than three noisy pixels in the level2.evt file, extra rows are filled as -1
| Pixel properties | Quadrant properties | ||||||
|---|---|---|---|---|---|---|---|
| Quadrant | DetID | PixID | Counts | Sigma | Mean | Median | Sigma |
| A | 1 | 162 | 137393 | 501.25 | 1331 | 1304 | 271.5 |
| A | 1 | 178 | 41575 | 148.33 | 1331 | 1304 | 271.5 |
| A | 1 | 161 | 40873 | 145.74 | 1331 | 1304 | 271.5 |
| B | 0 | 214 | 90100 | 355.31 | 1324 | 1291 | 249.9 |
| B | 12 | 111 | 28560 | 109.1 | 1324 | 1291 | 249.9 |
| B | 0 | 187 | 25626 | 97.36 | 1324 | 1291 | 249.9 |
| C | 13 | 61 | 9665 | 28.47 | 1283 | 1289 | 294.2 |
| C | 12 | 4 | 5082 | 12.89 | 1283 | 1289 | 294.2 |
| C | 3 | 202 | 3086 | 6.11 | 1283 | 1289 | 294.2 |
| D | 1 | 52 | 591411 | 1922.82 | 1274 | 1244 | 306.9 |
| D | 2 | 16 | 330768 | 1073.62 | 1274 | 1244 | 306.9 |
| D | 7 | 71 | 184270 | 596.32 | 1274 | 1244 | 306.9 |
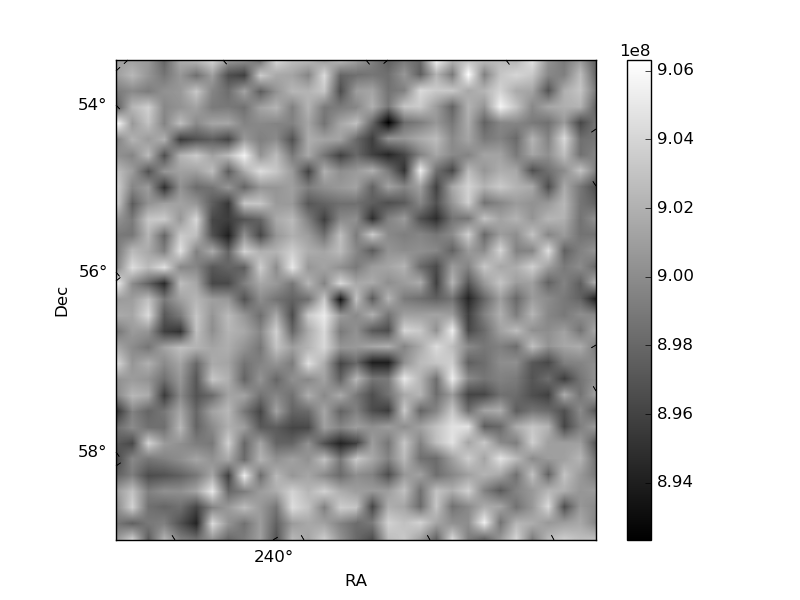
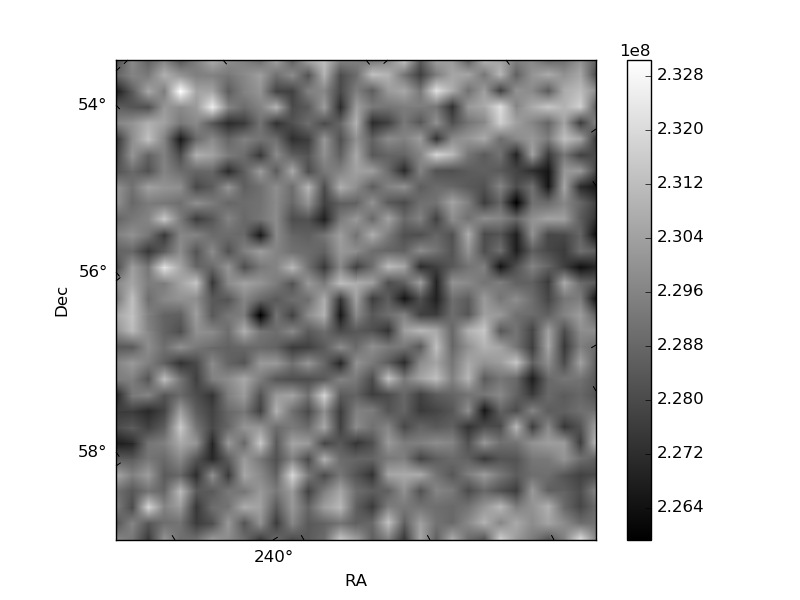
Histogram calculated using DETX and DETY for each event in the final _common_clean file
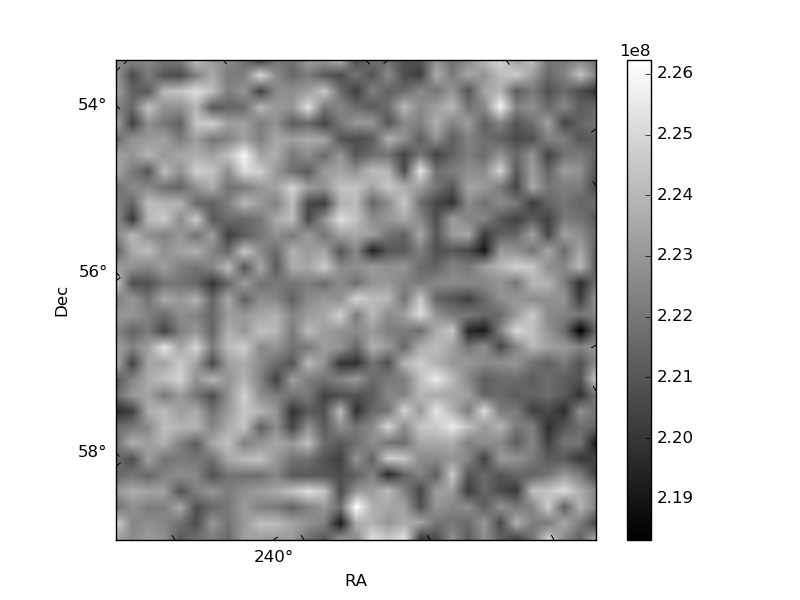
| Quadrant A | 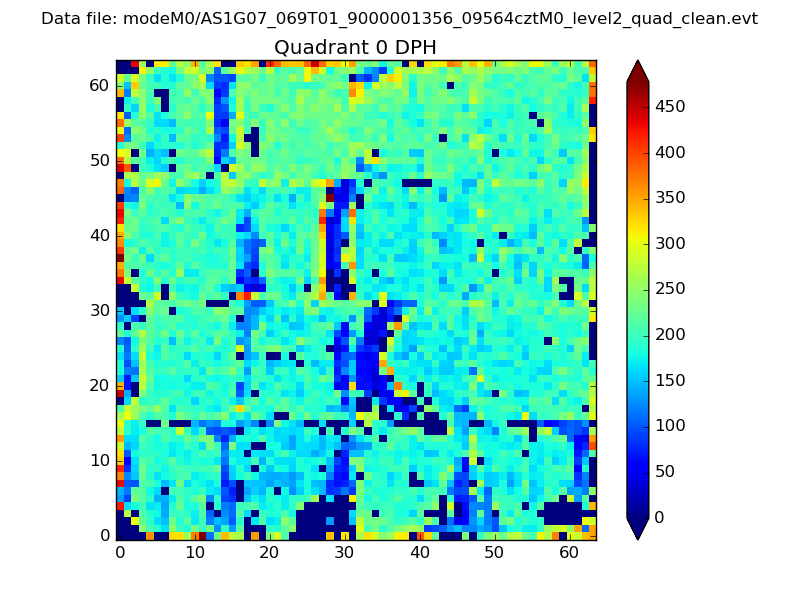 |
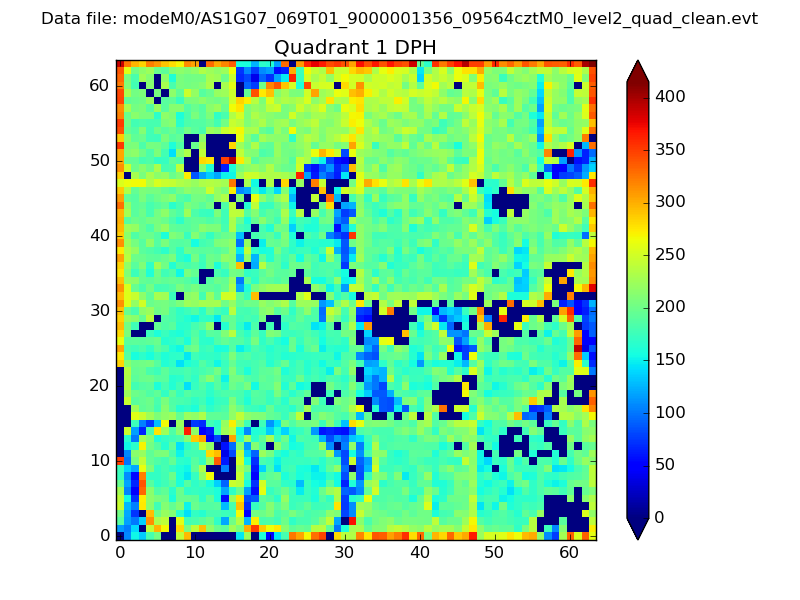 |
Quadrant B |
|---|---|---|---|
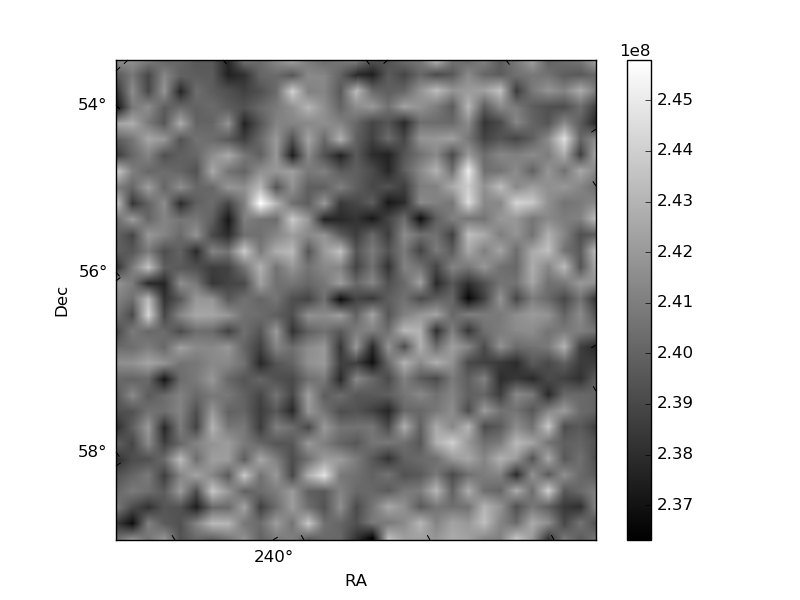
| Quadrant D | 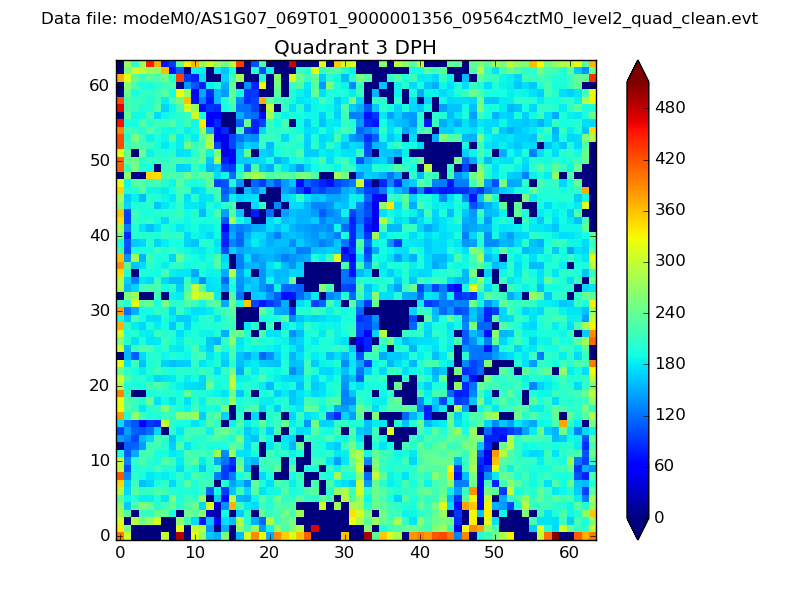 |
 |
Quadrant C |
| Plot type | Count rate plots | Images |
|---|---|---|
| Comparison with Poisson distribution Blue bars denote a histogram of data divided into 1 sec bins. Red curve is a Poisson curve with rate = median count rate of data. |
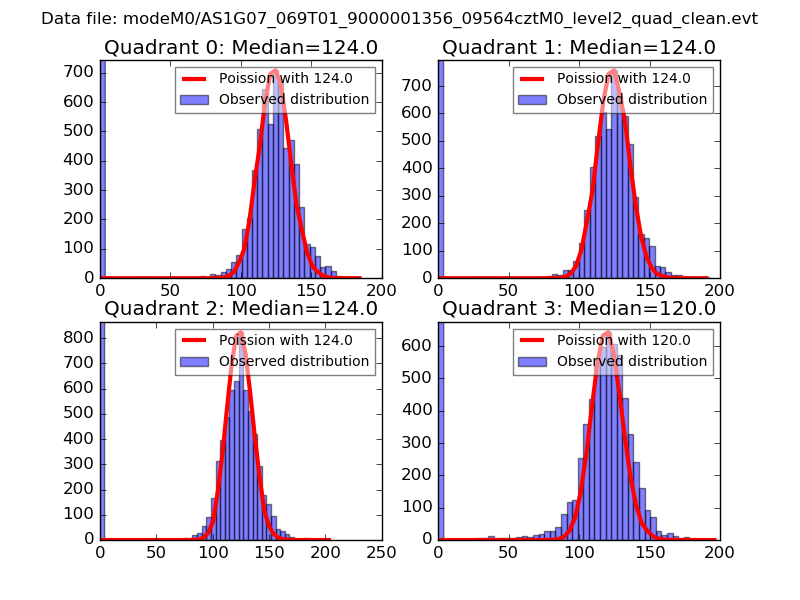 |
 |
| Quadrant-wise count rates Data is divided into 100 sec bins |
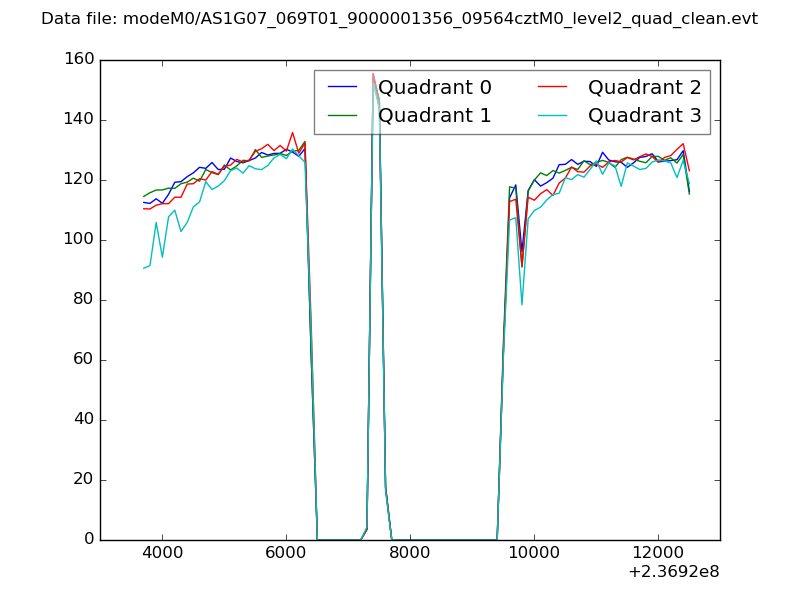 |
|
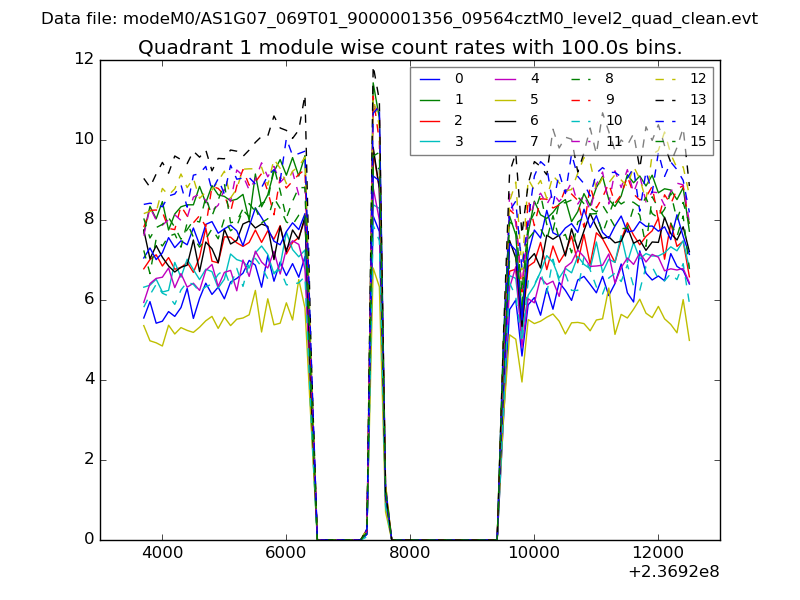
| Module-wise count rates for Quadrant A Data is divided into 100 sec bins |
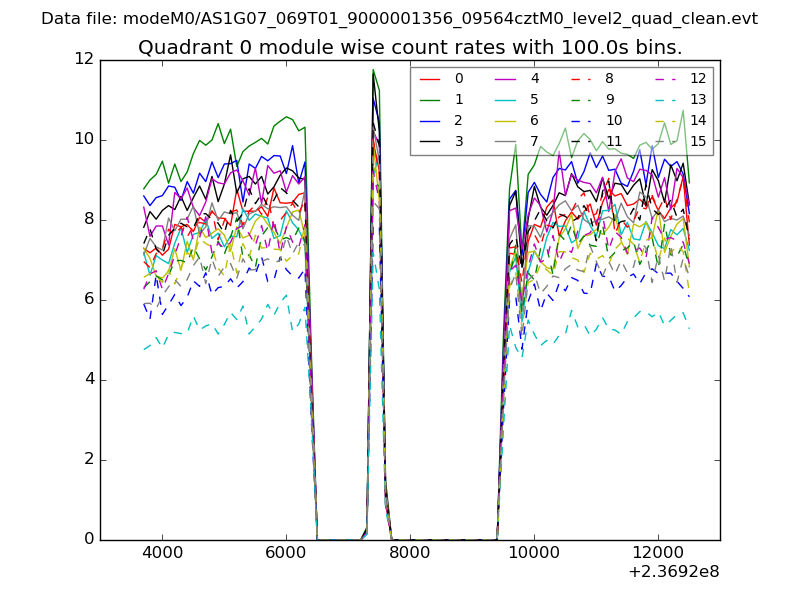 |
 |
| Module-wise count rates for Quadrant B Data is divided into 100 sec bins |
 |
 |
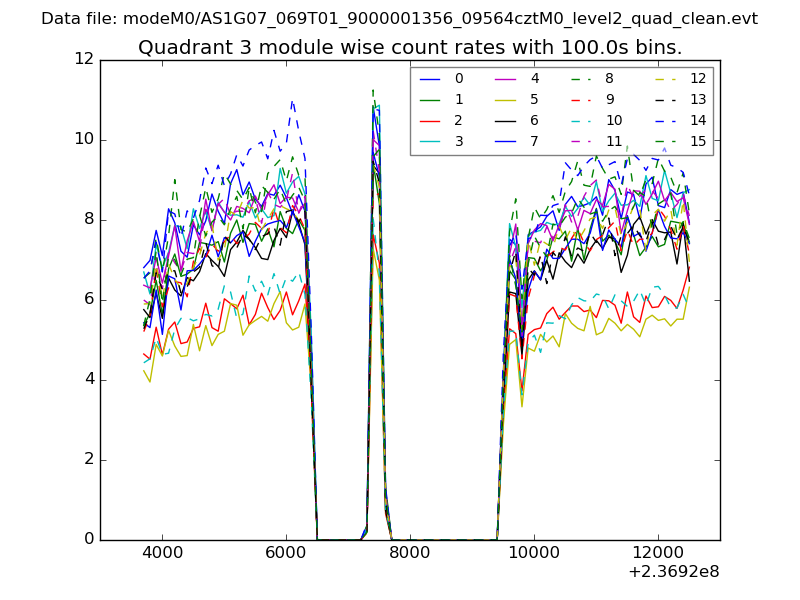
| Module-wise count rates for Quadrant C Data is divided into 100 sec bins |
 |
 |
| Module-wise count rates for Quadrant D Data is divided into 100 sec bins |
 |
 |
| Parameter | Plot |
|---|---|
| CZT HV Monitor | 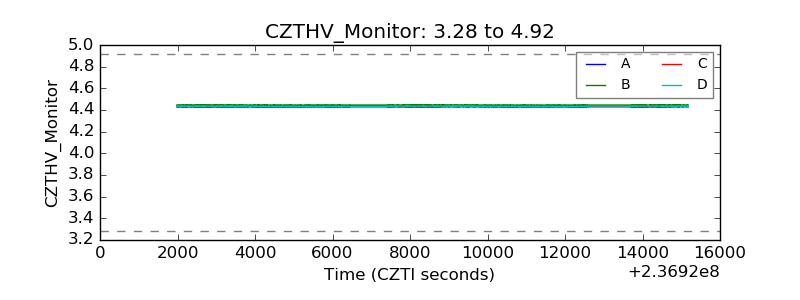 |
| D_VDD | 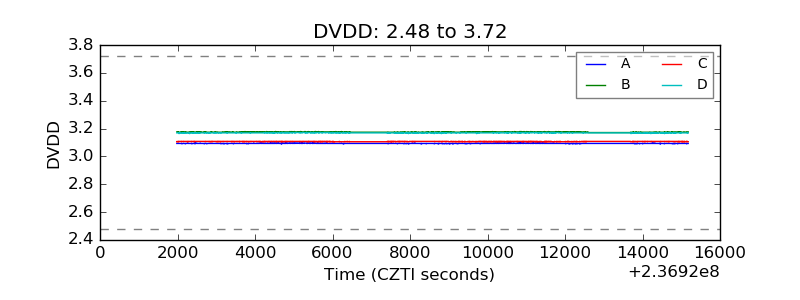 |
| Temperature 1 | 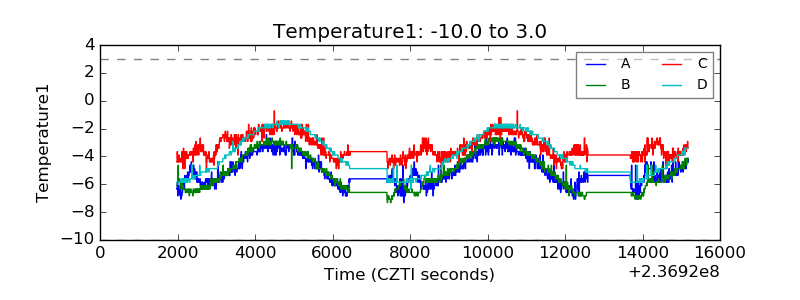 |
| Veto HV Monitor | 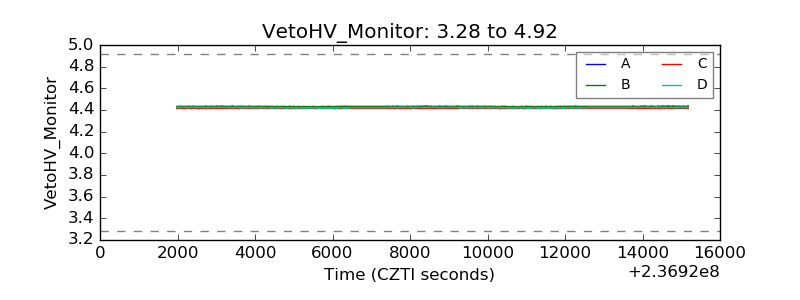 |
| Veto LLD | 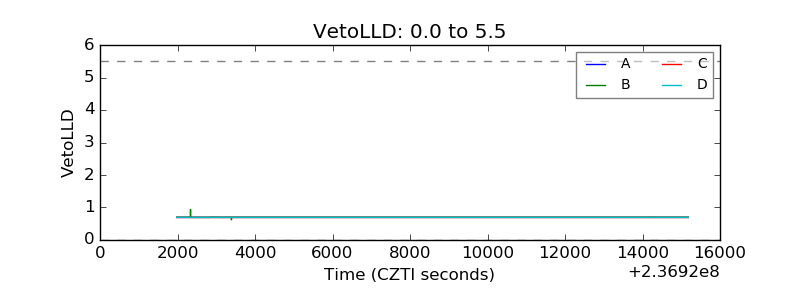 |
| Alpha Counter |  |
| _CPM_Rate | 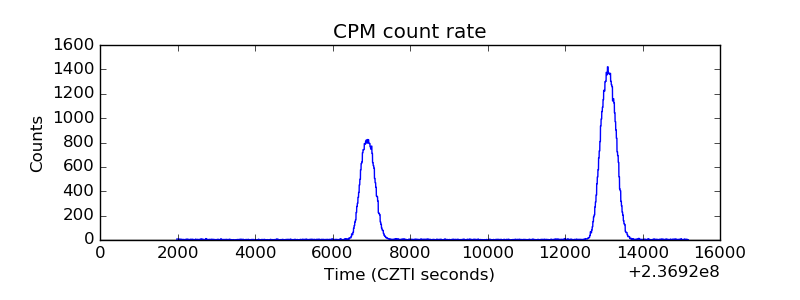 |
| CZT Counter | 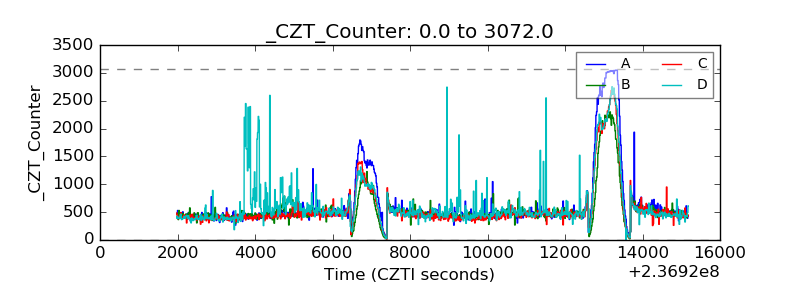 |
| +2.5 Volts monitor |  |
| +5 Volts monitor |  |
| _ROLL_ROT | 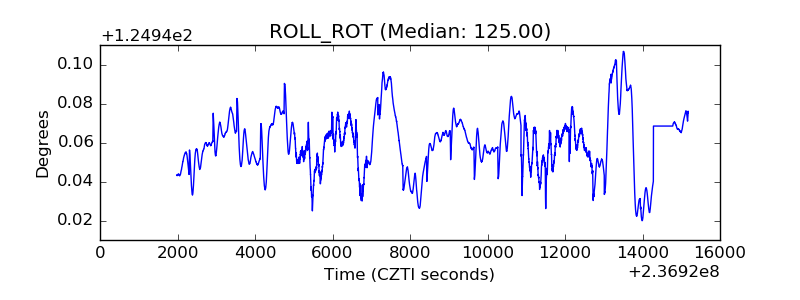 |
| _Roll_DEC | 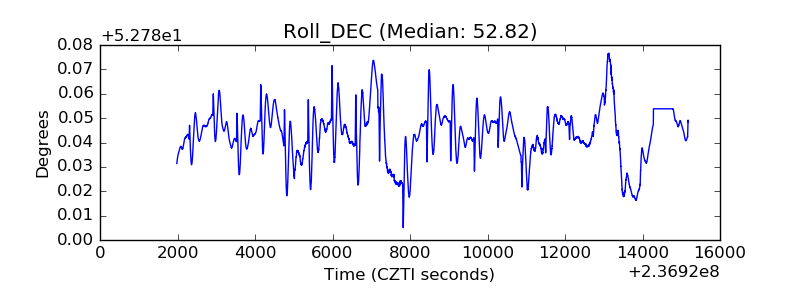 |
| _Roll_RA | 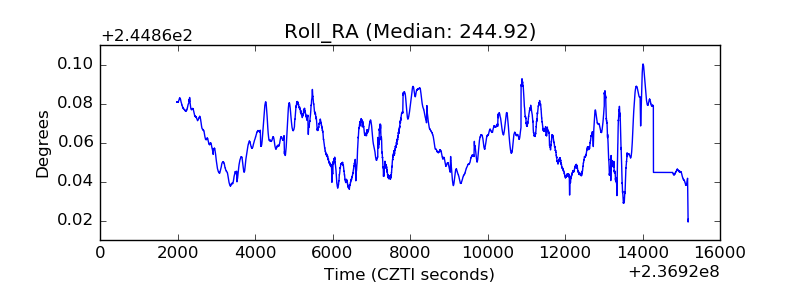 |
| Veto Counter | 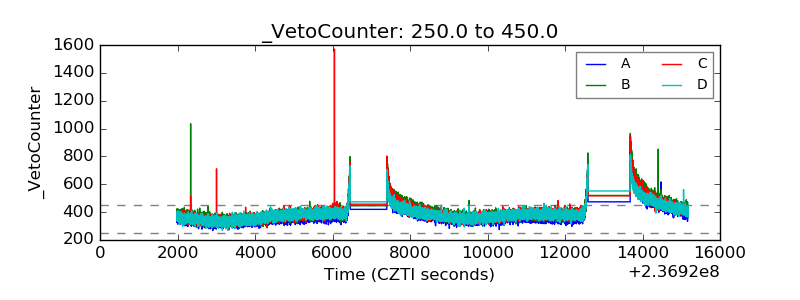 |