| Param | Original file | Final file |
|---|---|---|
| Filename | modeM0/AS1G07_069T01_9000001356_09566cztM0_level2.evt | modeM0/AS1G07_069T01_9000001356_09566cztM0_level2_quad_clean.evt |
| Size (bytes) | 730,635,840 | 159,456,960 |
| Size | 696.8 MB | 152.1 MB |
| Events in quadrant A | 5,584,301 | 1,041,238 |
| Events in quadrant B | 5,445,369 | 1,042,634 |
| Events in quadrant C | 4,960,267 | 1,022,374 |
| Events in quadrant D | 5,432,547 | 1,002,607 |
| Mode SS | |||
|---|---|---|---|
| Quadrant | BADHDUFLAG | Total packets | Discarded packets |
| A | 0 | 214 | 0 |
| B | 0 | 214 | 0 |
| C | 0 | 214 | 0 |
| D | 0 | 214 | 0 |
| Mode M9 | |||
|---|---|---|---|
| Quadrant | BADHDUFLAG | Total packets | Discarded packets |
| A | 0 | 24 | 0 |
| B | 0 | 24 | 0 |
| C | 0 | 24 | 0 |
| D | 0 | 24 | 0 |
| Mode M0 | |||
|---|---|---|---|
| Quadrant | BADHDUFLAG | Total packets | Discarded packets |
| A | 0 | 23264 | 3 |
| B | 0 | 22653 | 2 |
| C | 0 | 21494 | 2 |
| D | 0 | 22756 | 2 |
| Quadrant | Total seconds | Saturated seconds | Saturation percentage |
|---|---|---|---|
| A | 10399 | 193 | 1.855948% |
| B | 10399 | 168 | 1.615540% |
| C | 10399 | 106 | 1.019329% |
| D | 10399 | 153 | 1.471295% |
Noise dominated data is calculated using 1-second bins in cleaned event files. If a bin has >2000 counts, and if more than 50% of those come from <1% of pixels, then it is considered to be noise-dominated and hence unusable.
| Quadrant | # 1 sec bins | Bins with >0 counts | Bins with >2000 counts | High rate bins dominated by noise | Noise dominated (total time) | Noise dominated (detector-on time) | Marked lightcurve |
|---|---|---|---|---|---|---|---|
| A | 12889 | 10400 | 6 | 6 | 0.05% | 0.06% | 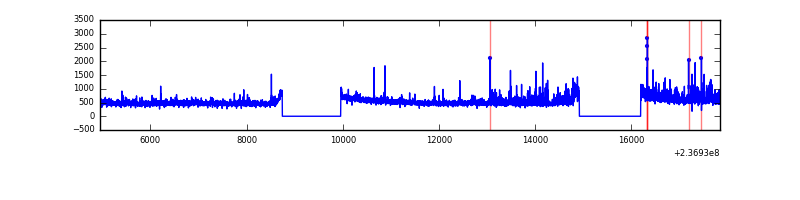 |
| B | 12889 | 10400 | 13 | 13 | 0.10% | 0.12% | 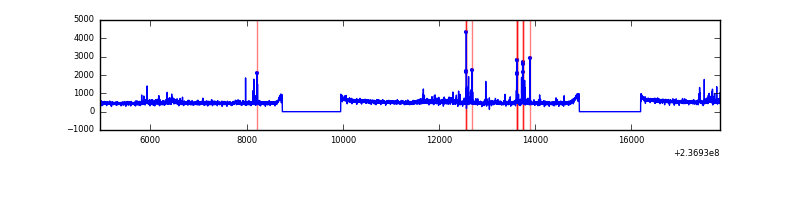 |
| C | 12889 | 10400 | 0 | 0 | 0.00% | 0.00% | 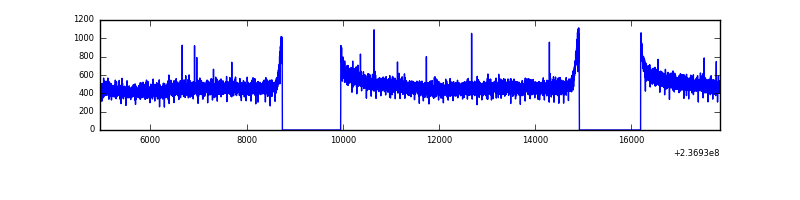 |
| D | 12889 | 10400 | 33 | 33 | 0.26% | 0.32% | 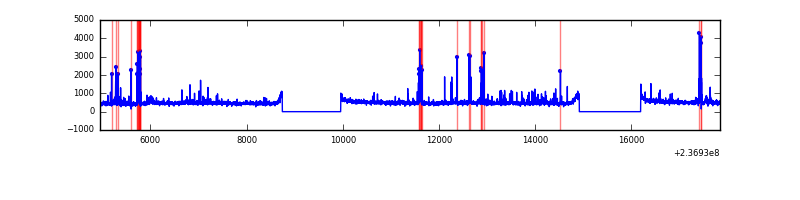 |
Top three noisy pixels from each quadrant. If the there are fewer than three noisy pixels in the level2.evt file, extra rows are filled as -1
| Pixel properties | Quadrant properties | ||||||
|---|---|---|---|---|---|---|---|
| Quadrant | DetID | PixID | Counts | Sigma | Mean | Median | Sigma |
| A | 1 | 162 | 220904 | 837.91 | 1325 | 1297 | 262.1 |
| A | 1 | 178 | 94257 | 354.69 | 1325 | 1297 | 262.1 |
| A | 1 | 161 | 92109 | 346.49 | 1325 | 1297 | 262.1 |
| B | 0 | 214 | 113910 | 459.4 | 1313 | 1284 | 245.2 |
| B | 0 | 187 | 94913 | 381.92 | 1313 | 1284 | 245.2 |
| B | 15 | 85 | 63520 | 253.86 | 1313 | 1284 | 245.2 |
| C | 13 | 61 | 9423 | 28.06 | 1270 | 1274 | 290.4 |
| C | 1 | 0 | 3543 | 7.81 | 1270 | 1274 | 290.4 |
| C | 14 | 67 | 3307 | 7.0 | 1270 | 1274 | 290.4 |
| D | 7 | 71 | 177960 | 576.84 | 1280 | 1249 | 306.3 |
| D | 1 | 52 | 118037 | 381.23 | 1280 | 1249 | 306.3 |
| D | 12 | 233 | 105938 | 341.74 | 1280 | 1249 | 306.3 |
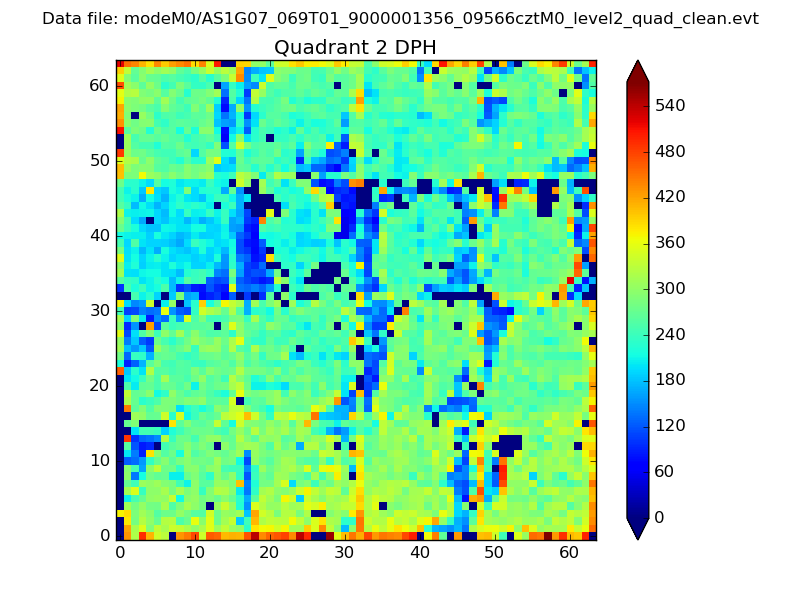
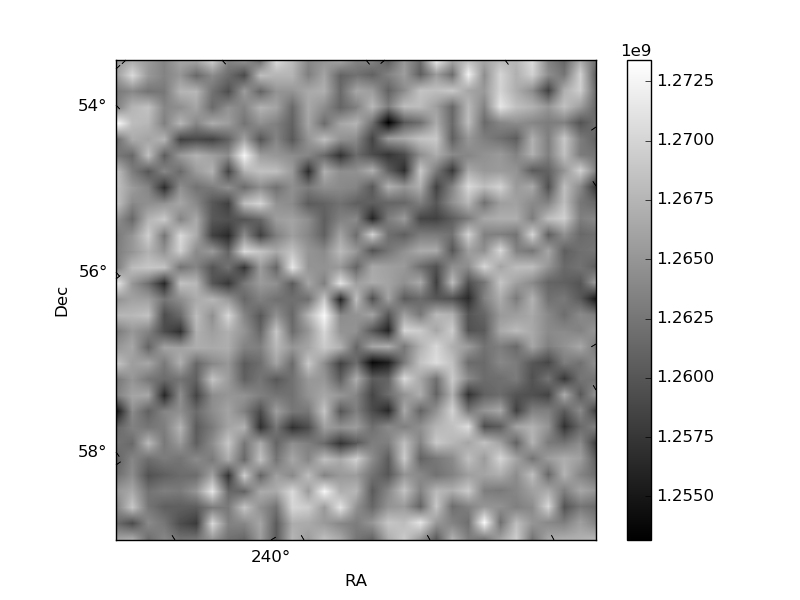
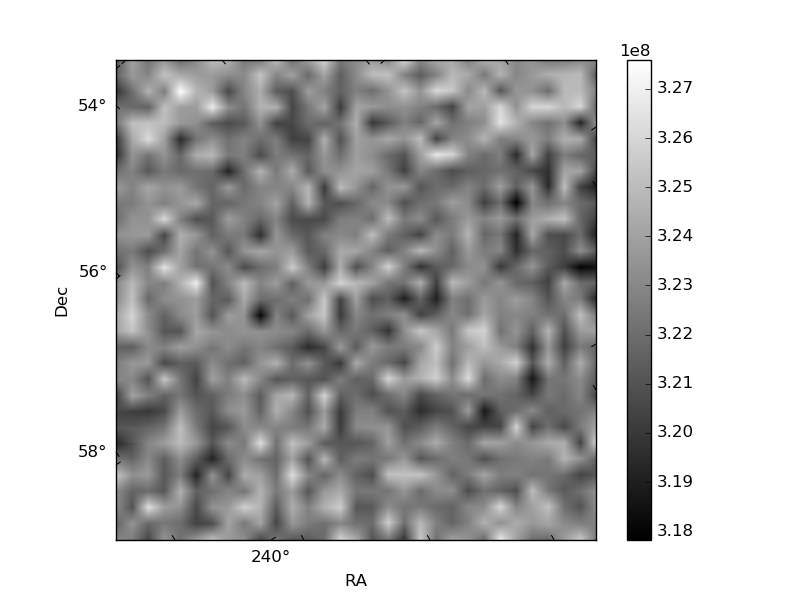
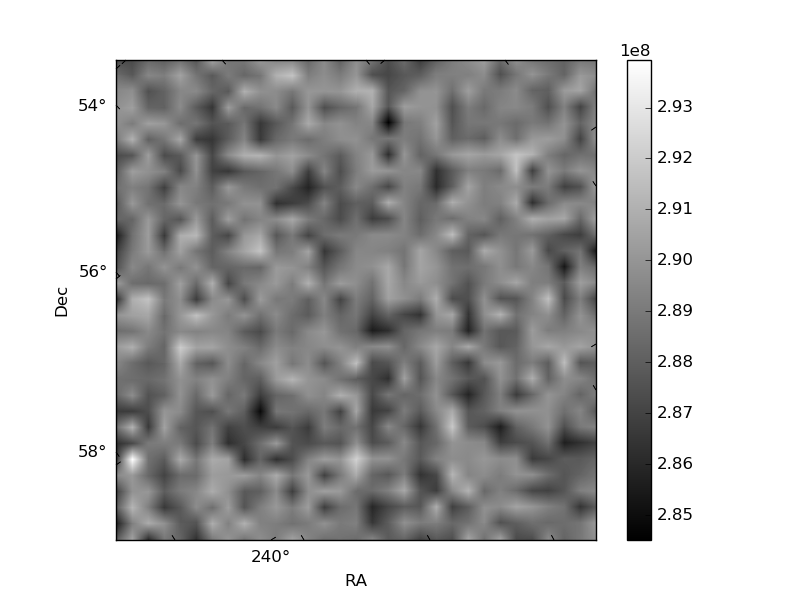
Histogram calculated using DETX and DETY for each event in the final _common_clean file
| Quadrant A | 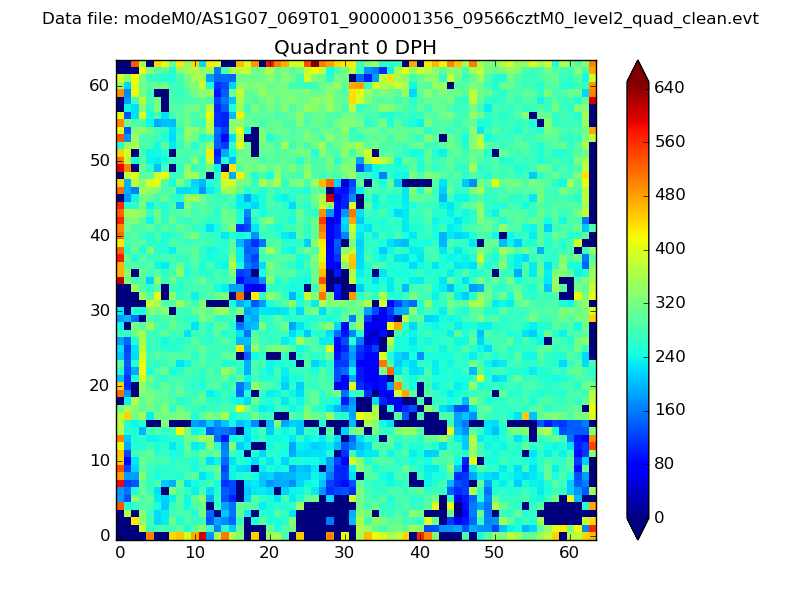 |
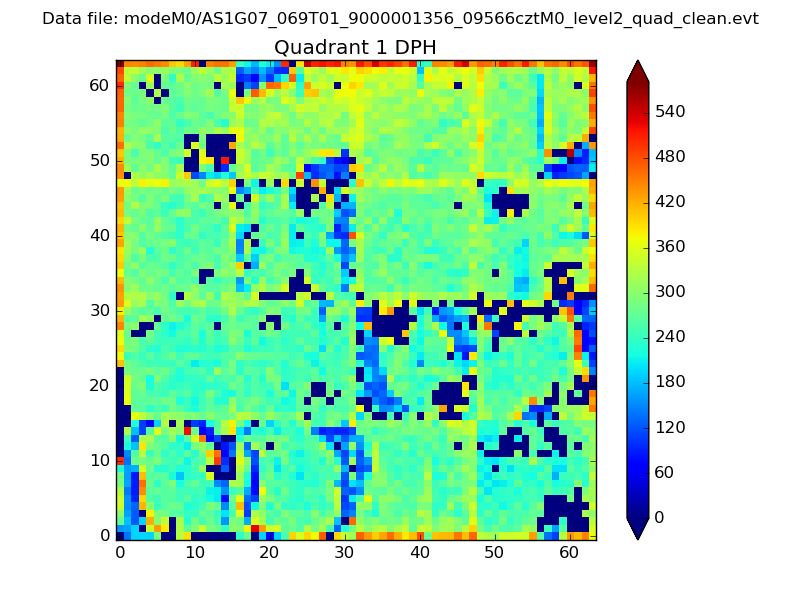 |
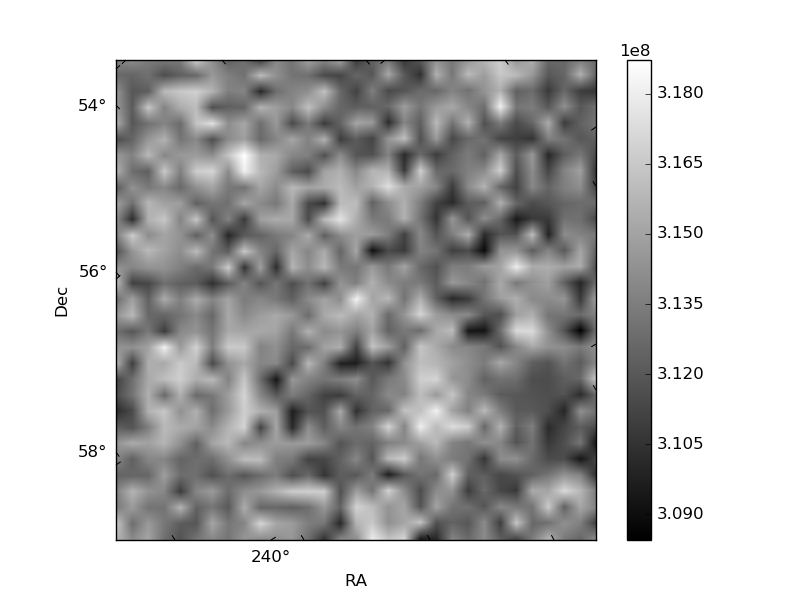
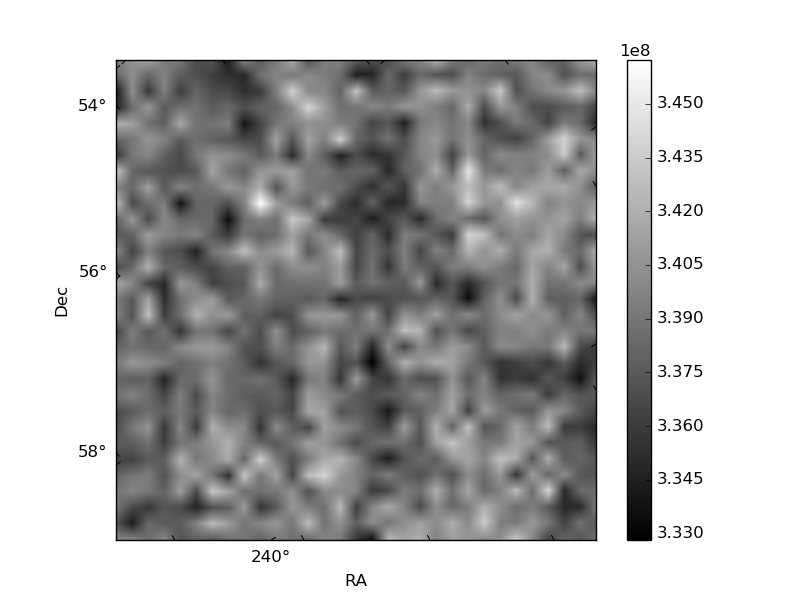
Quadrant B |
|---|---|---|---|
| Quadrant D | 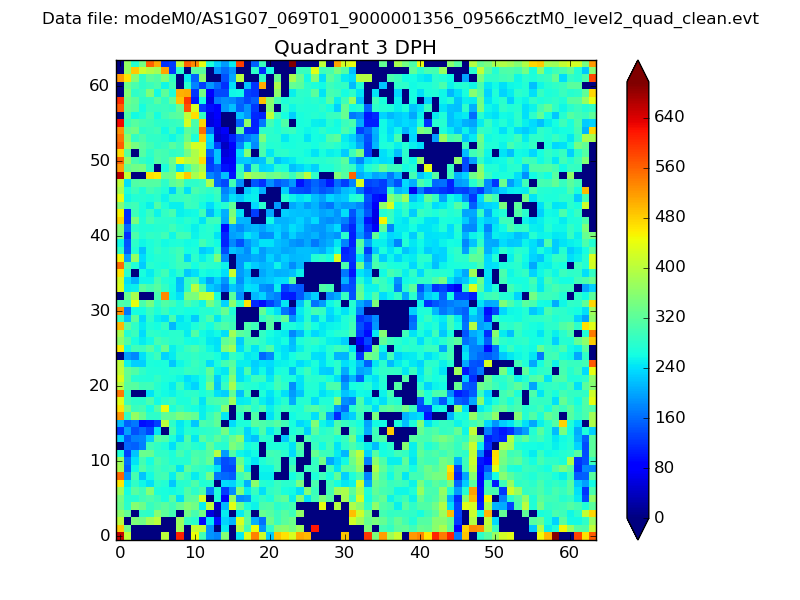 |
 |
Quadrant C |
| Plot type | Count rate plots | Images |
|---|---|---|
| Comparison with Poisson distribution Blue bars denote a histogram of data divided into 1 sec bins. Red curve is a Poisson curve with rate = median count rate of data. |
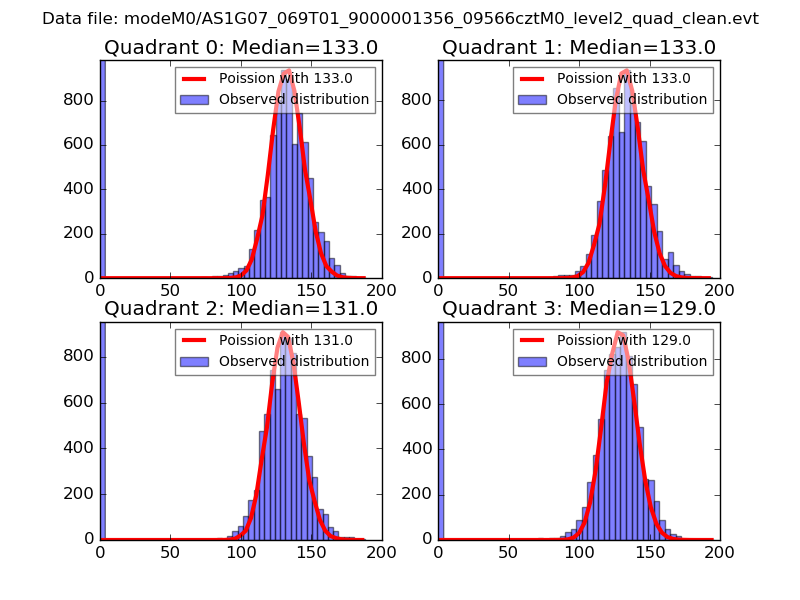 |
 |
| Quadrant-wise count rates Data is divided into 100 sec bins |
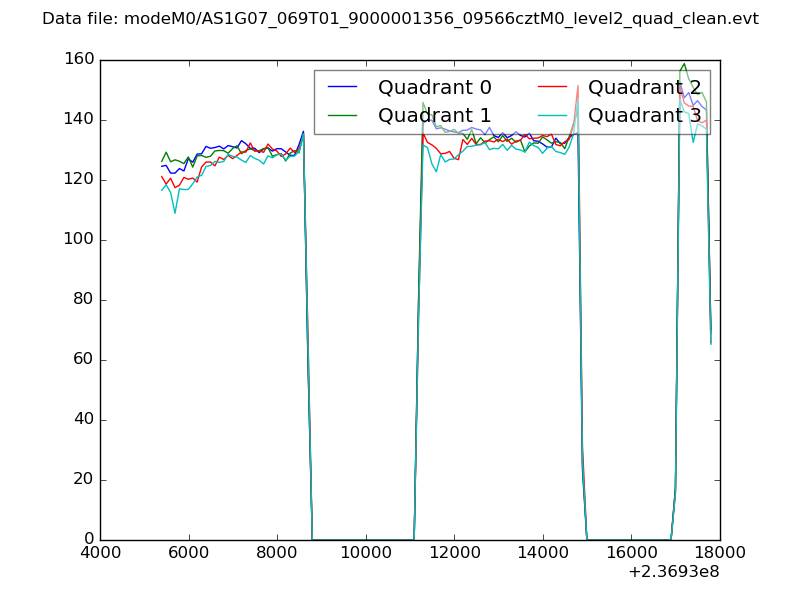 |
|
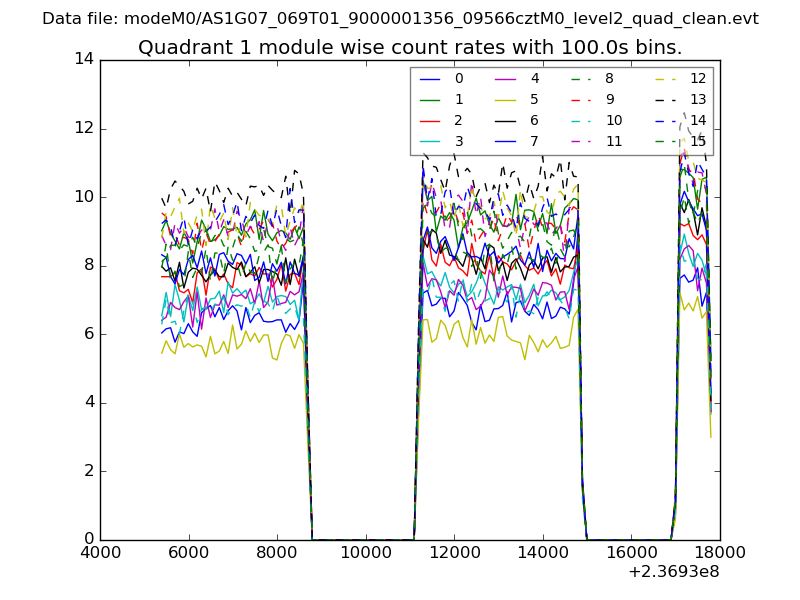
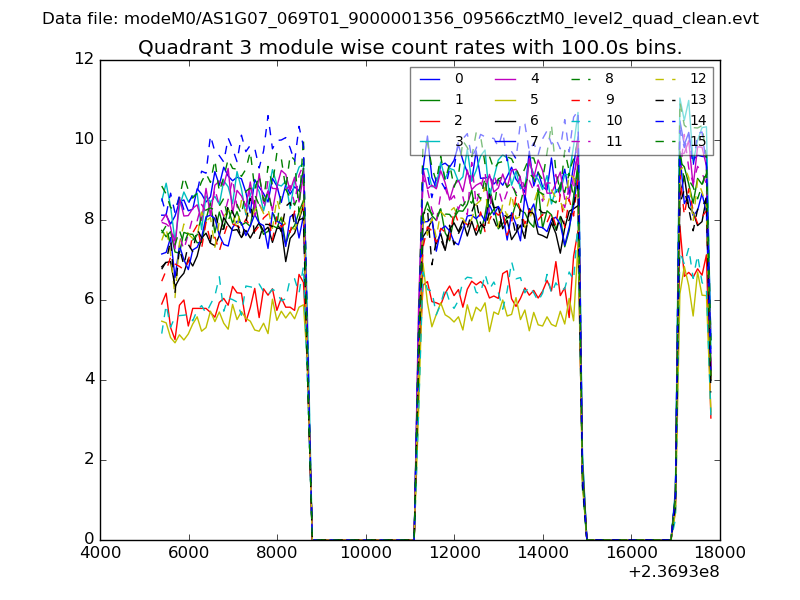
| Module-wise count rates for Quadrant A Data is divided into 100 sec bins |
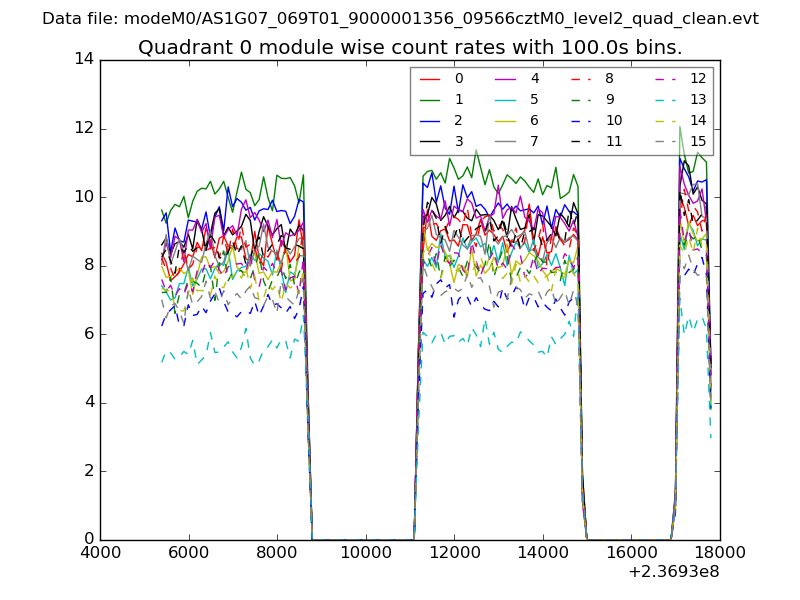 |
 |
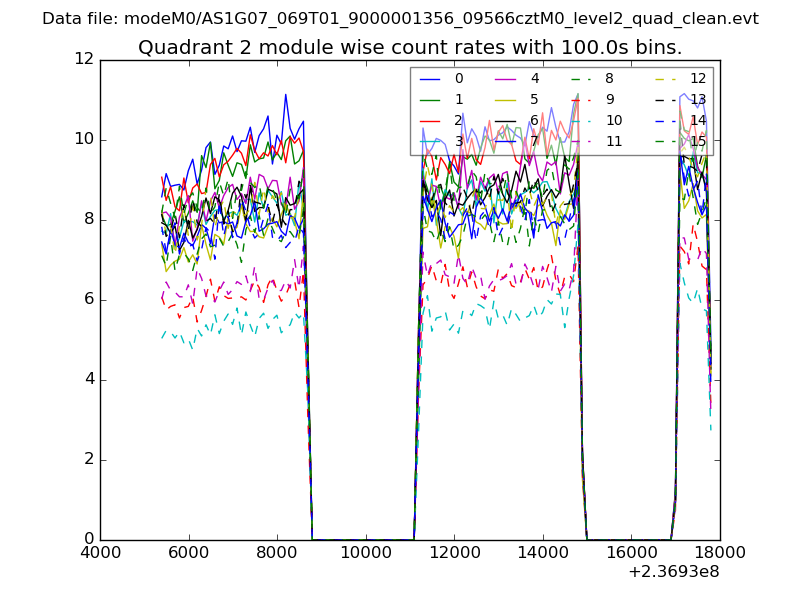
| Module-wise count rates for Quadrant B Data is divided into 100 sec bins |
 |
 |
| Module-wise count rates for Quadrant C Data is divided into 100 sec bins |
 |
 |
| Module-wise count rates for Quadrant D Data is divided into 100 sec bins |
 |
 |
| Parameter | Plot |
|---|---|
| CZT HV Monitor | 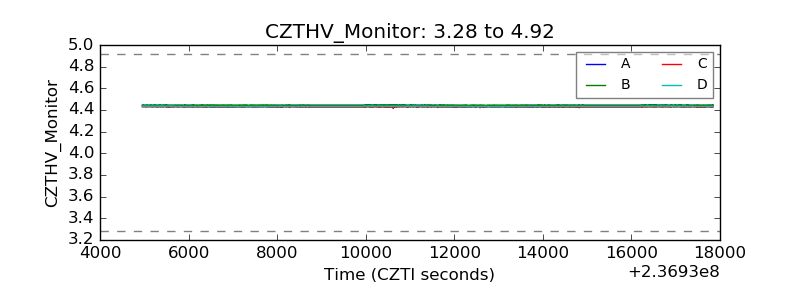 |
| D_VDD |  |
| Temperature 1 | 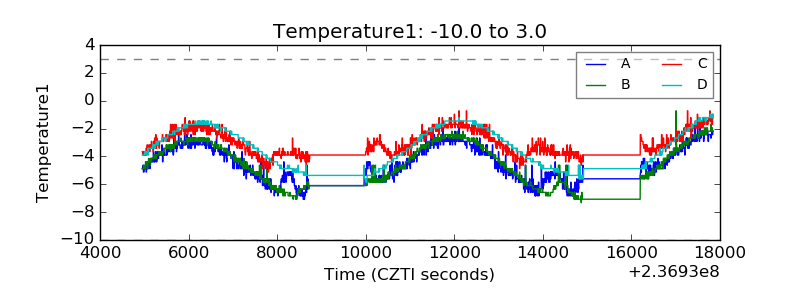 |
| Veto HV Monitor | 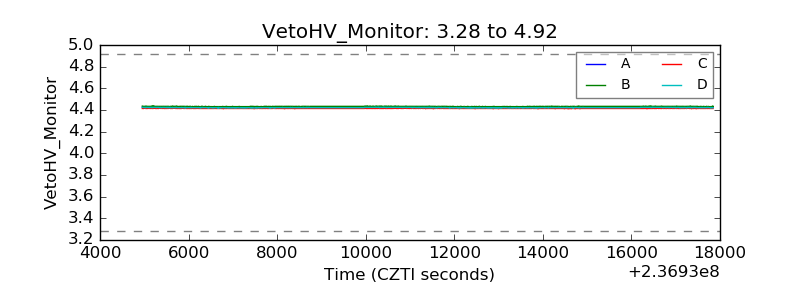 |
| Veto LLD |  |
| Alpha Counter | 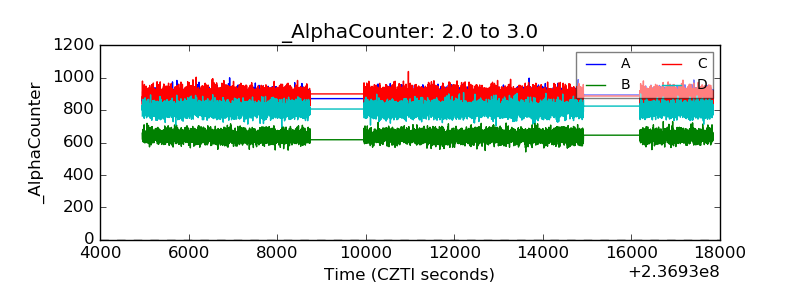 |
| _CPM_Rate | 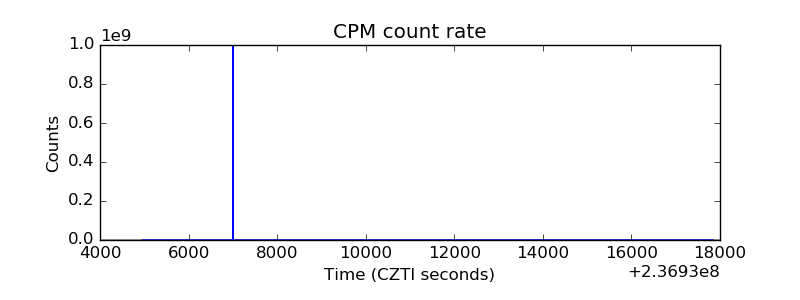 |
| CZT Counter | 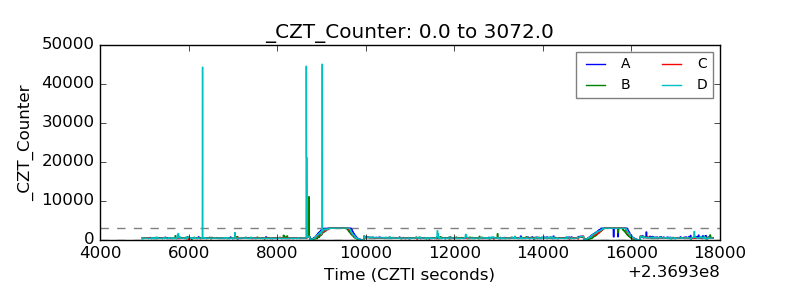 |
| +2.5 Volts monitor | 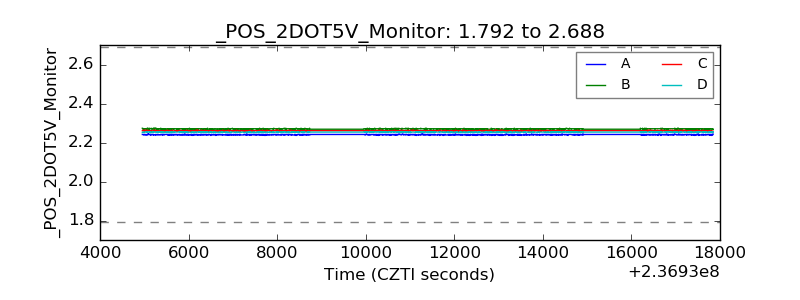 |
| +5 Volts monitor |  |
| _ROLL_ROT | 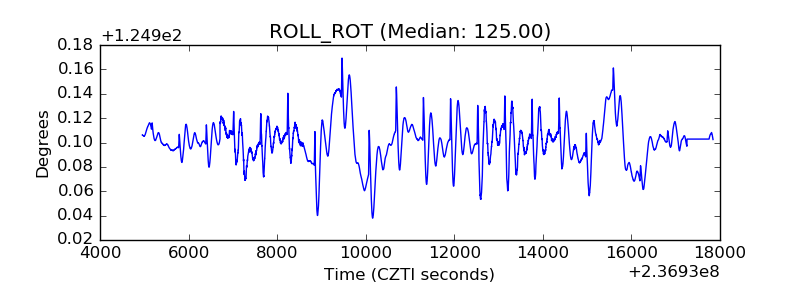 |
| _Roll_DEC | 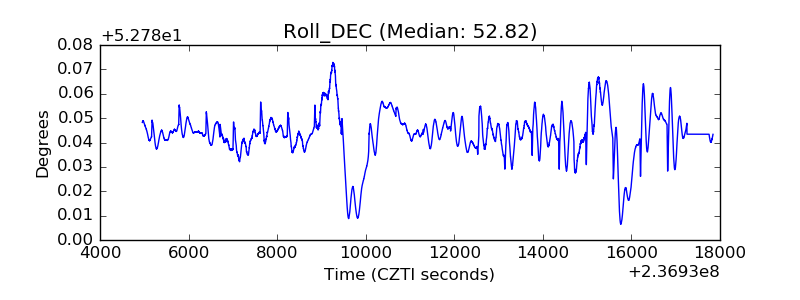 |
| _Roll_RA | 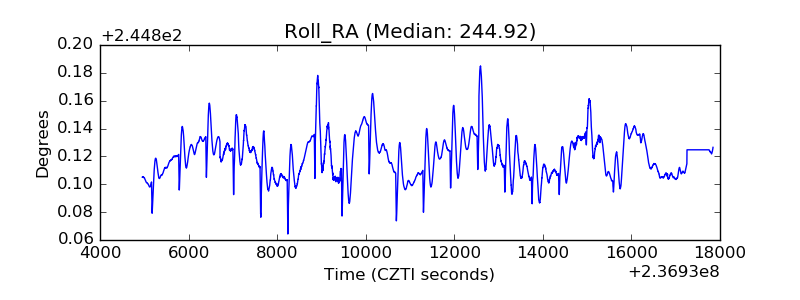 |
| Veto Counter | 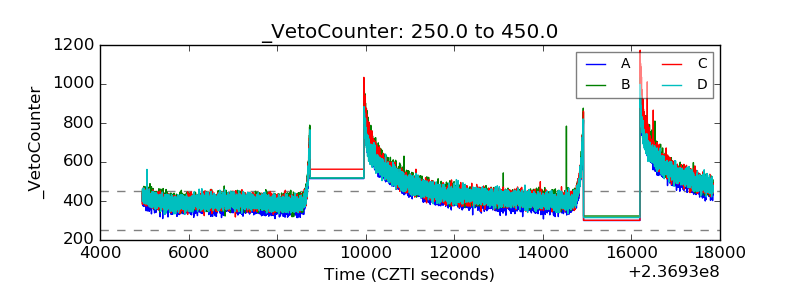 |