| Param | Original file | Final file |
|---|---|---|
| Filename | modeM0/AS1G07_069T01_9000001356_09567cztM0_level2.evt | modeM0/AS1G07_069T01_9000001356_09567cztM0_level2_quad_clean.evt |
| Size (bytes) | 256,919,040 | 51,624,000 |
| Size | 245.0 MB | 49.2 MB |
| Events in quadrant A | 2,043,446 | 339,649 |
| Events in quadrant B | 1,861,464 | 340,833 |
| Events in quadrant C | 1,620,720 | 331,963 |
| Events in quadrant D | 2,030,346 | 317,166 |
| Mode SS | |||
|---|---|---|---|
| Quadrant | BADHDUFLAG | Total packets | Discarded packets |
| A | 0 | 66 | 0 |
| B | 0 | 66 | 0 |
| C | 0 | 66 | 0 |
| D | 0 | 66 | 0 |
| Mode M9 | |||
|---|---|---|---|
| Quadrant | BADHDUFLAG | Total packets | Discarded packets |
| A | 0 | 8 | 0 |
| B | 0 | 8 | 0 |
| C | 0 | 8 | 0 |
| D | 0 | 9 | 0 |
| Mode M0 | |||
|---|---|---|---|
| Quadrant | BADHDUFLAG | Total packets | Discarded packets |
| A | 0 | 8261 | 1 |
| B | 0 | 7612 | 1 |
| C | 0 | 6847 | 1 |
| D | 0 | 7999 | 1 |
| Quadrant | Total seconds | Saturated seconds | Saturation percentage |
|---|---|---|---|
| A | 3286 | 57 | 1.734632% |
| B | 3286 | 35 | 1.065125% |
| C | 3286 | 17 | 0.517346% |
| D | 3286 | 138 | 4.199635% |
Noise dominated data is calculated using 1-second bins in cleaned event files. If a bin has >2000 counts, and if more than 50% of those come from <1% of pixels, then it is considered to be noise-dominated and hence unusable.
| Quadrant | # 1 sec bins | Bins with >0 counts | Bins with >2000 counts | High rate bins dominated by noise | Noise dominated (total time) | Noise dominated (detector-on time) | Marked lightcurve |
|---|---|---|---|---|---|---|---|
| A | 3285 | 3285 | 6 | 6 | 0.18% | 0.18% | 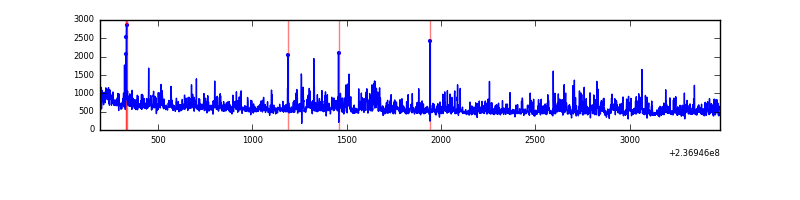 |
| B | 3285 | 3285 | 2 | 2 | 0.06% | 0.06% | 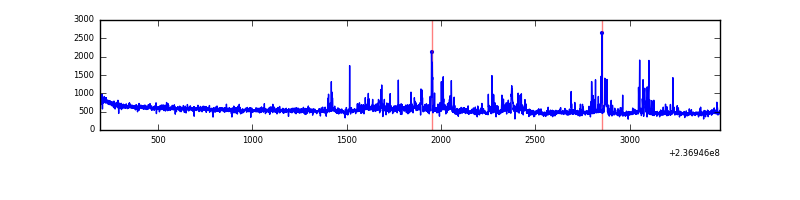 |
| C | 3285 | 3285 | 0 | 0 | 0.00% | 0.00% |  |
| D | 3285 | 3285 | 101 | 101 | 3.07% | 3.07% | 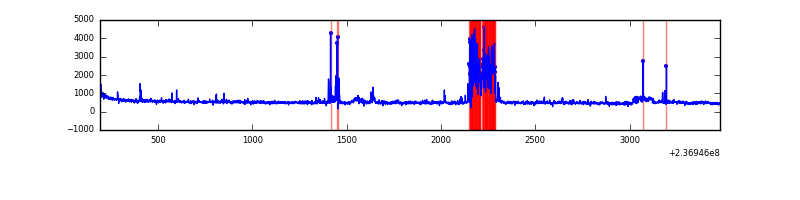 |
Top three noisy pixels from each quadrant. If the there are fewer than three noisy pixels in the level2.evt file, extra rows are filled as -1
| Pixel properties | Quadrant properties | ||||||
|---|---|---|---|---|---|---|---|
| Quadrant | DetID | PixID | Counts | Sigma | Mean | Median | Sigma |
| A | 1 | 162 | 155411 | 1763.69 | 434 | 426 | 87.9 |
| A | 1 | 178 | 76480 | 865.48 | 434 | 426 | 87.9 |
| A | 1 | 161 | 74350 | 841.24 | 434 | 426 | 87.9 |
| B | 0 | 187 | 49545 | 606.98 | 429 | 421 | 80.9 |
| B | 10 | 245 | 48950 | 599.62 | 429 | 421 | 80.9 |
| B | 0 | 214 | 45750 | 560.09 | 429 | 421 | 80.9 |
| C | 13 | 61 | 3182 | 29.11 | 414 | 416 | 95.0 |
| C | 14 | 67 | 1863 | 15.23 | 414 | 416 | 95.0 |
| C | 1 | 0 | 1856 | 15.15 | 414 | 416 | 95.0 |
| D | 12 | 233 | 308701 | 3068.85 | 413 | 404 | 100.5 |
| D | 12 | 227 | 59841 | 591.65 | 413 | 404 | 100.5 |
| D | 7 | 71 | 38084 | 375.07 | 413 | 404 | 100.5 |
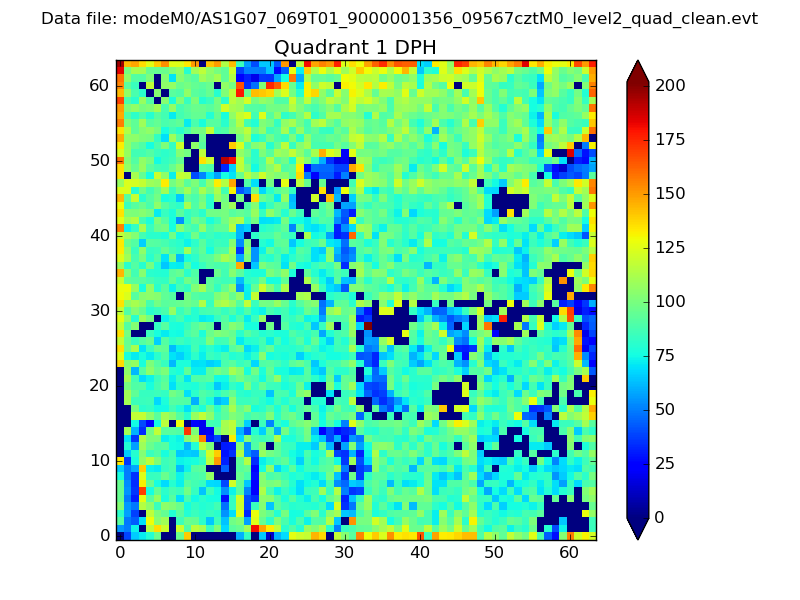
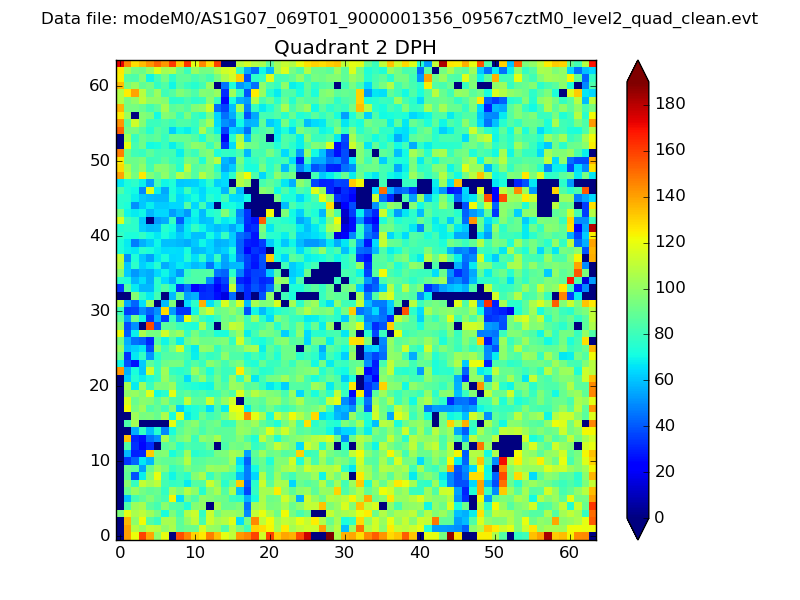
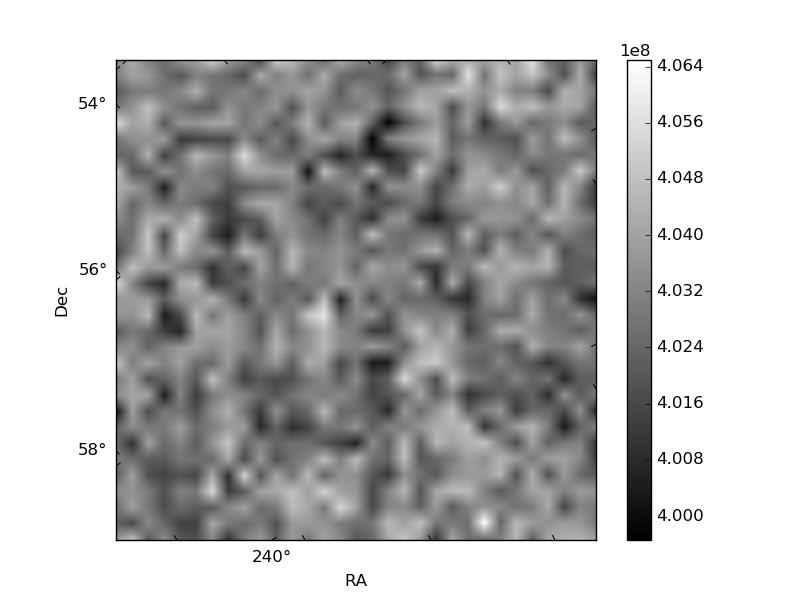
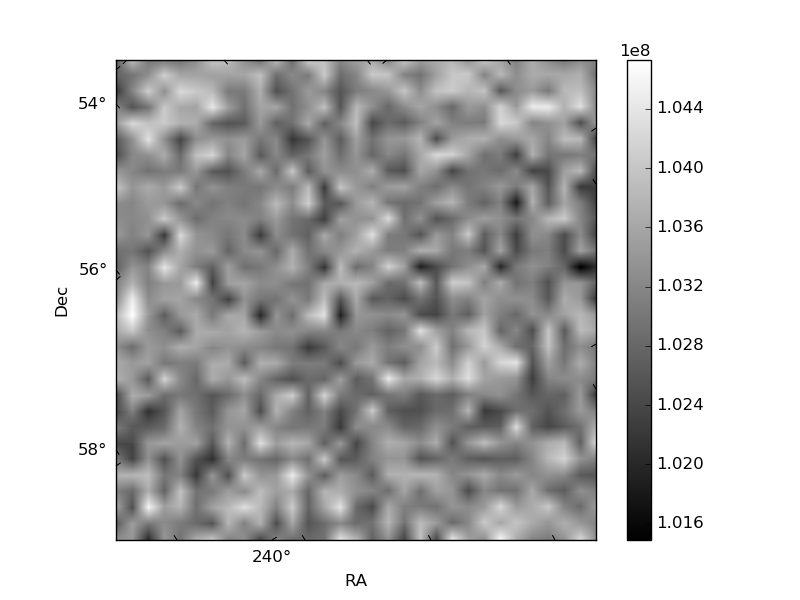
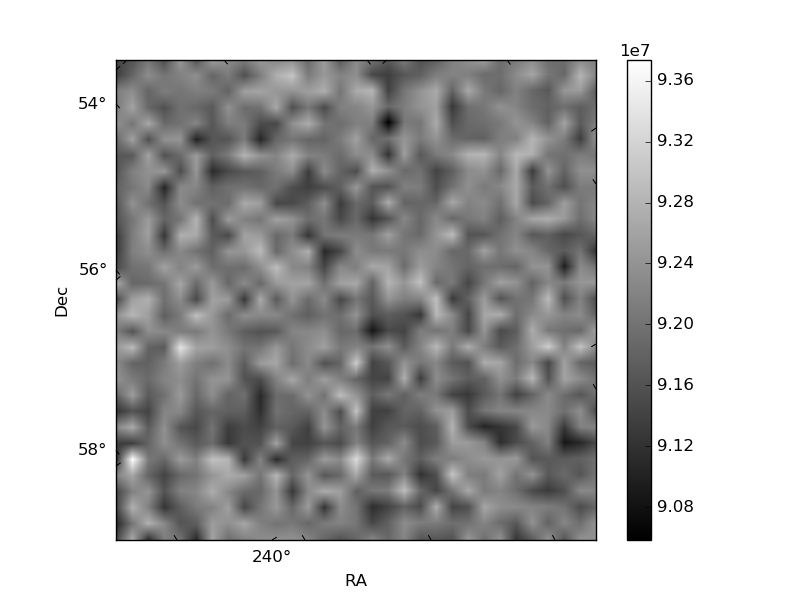
Histogram calculated using DETX and DETY for each event in the final _common_clean file
| Quadrant A | 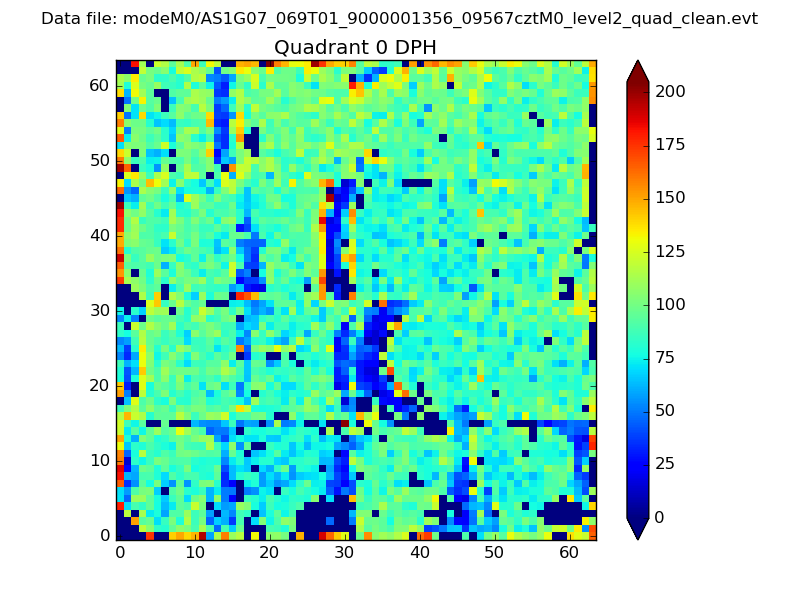 |
 |
Quadrant B |
|---|---|---|---|
| Quadrant D | 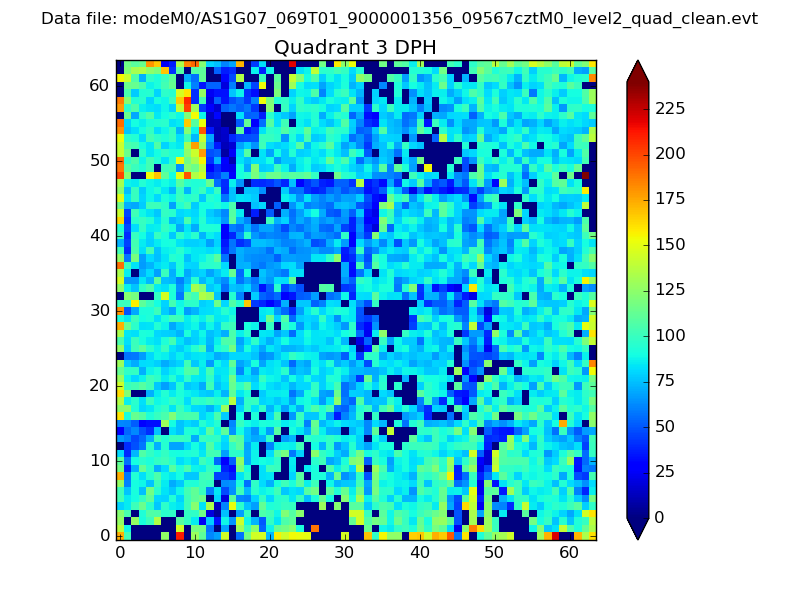 |
 |
Quadrant C |
| Plot type | Count rate plots | Images |
|---|---|---|
| Comparison with Poisson distribution Blue bars denote a histogram of data divided into 1 sec bins. Red curve is a Poisson curve with rate = median count rate of data. |
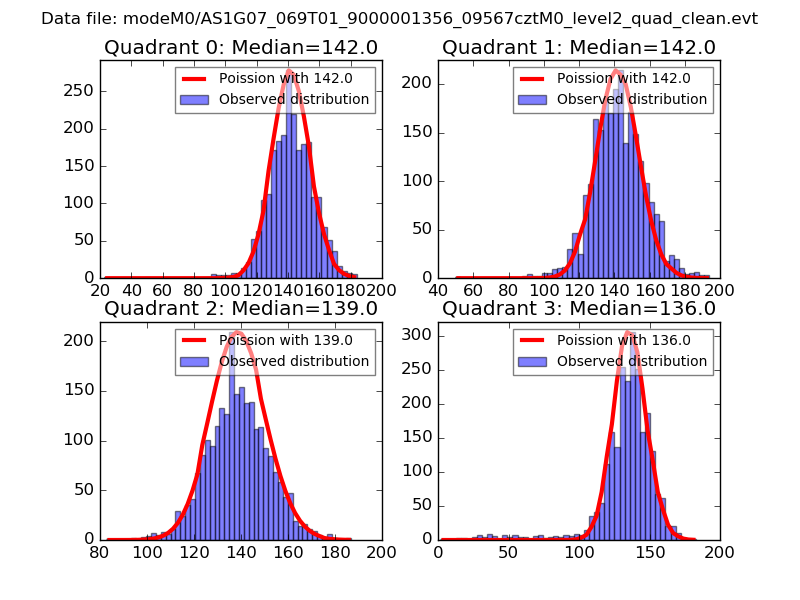 |
 |
| Quadrant-wise count rates Data is divided into 100 sec bins |
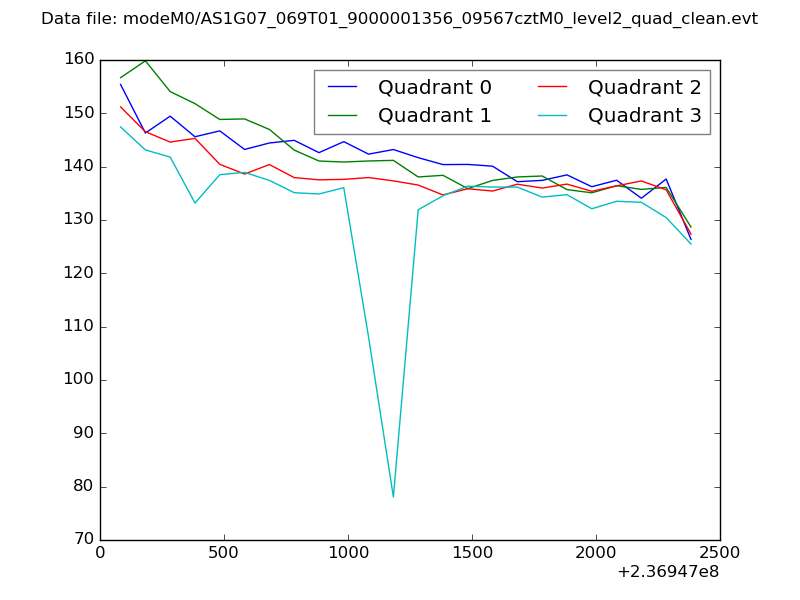 |
|
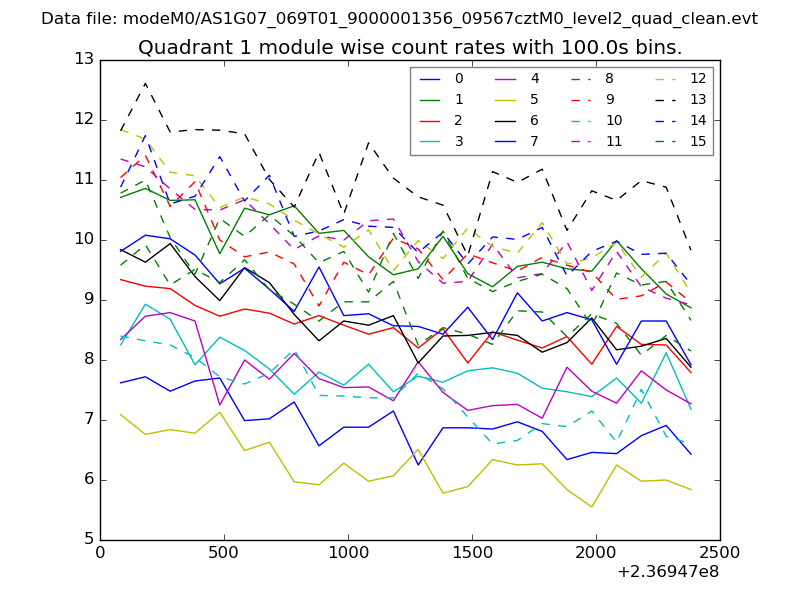
| Module-wise count rates for Quadrant A Data is divided into 100 sec bins |
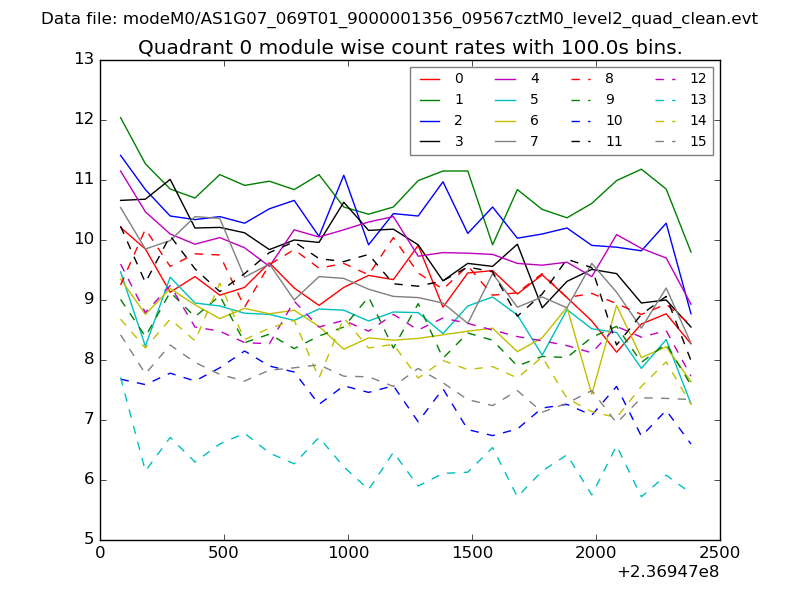 |
 |
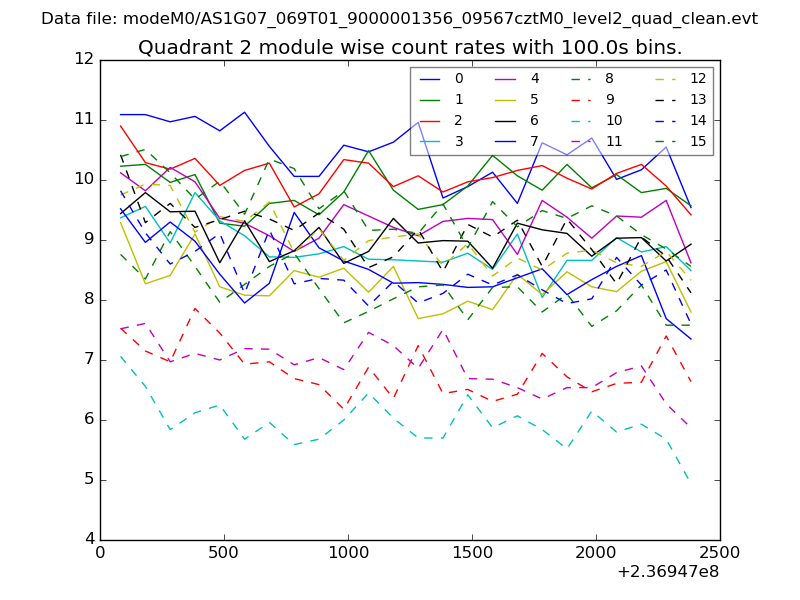
| Module-wise count rates for Quadrant B Data is divided into 100 sec bins |
 |
 |
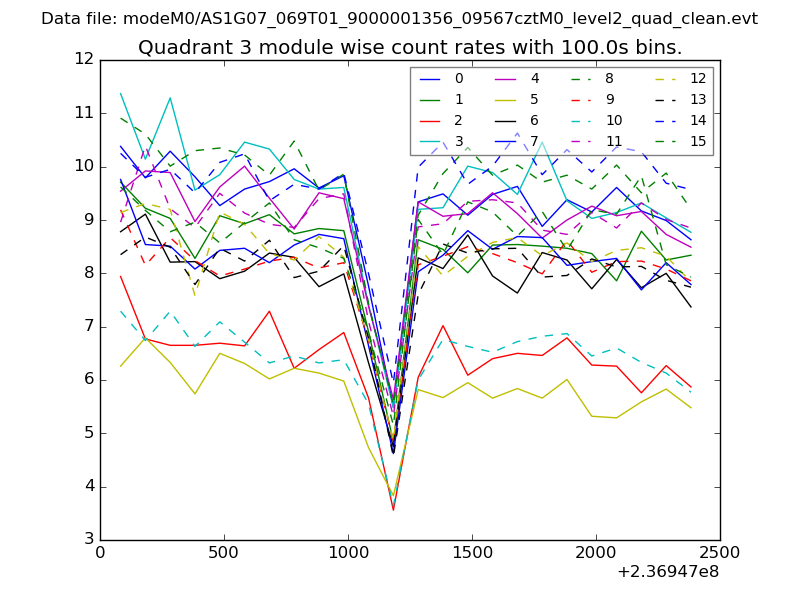
| Module-wise count rates for Quadrant C Data is divided into 100 sec bins |
 |
 |
| Module-wise count rates for Quadrant D Data is divided into 100 sec bins |
 |
 |
| Parameter | Plot |
|---|---|
| CZT HV Monitor | 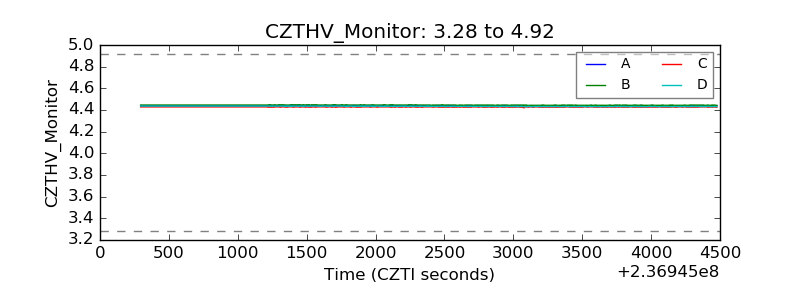 |
| D_VDD | 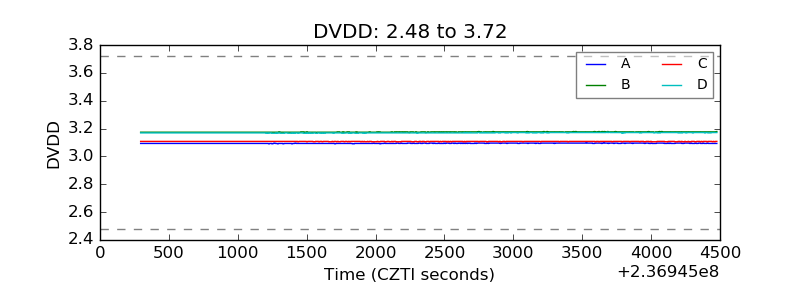 |
| Temperature 1 | 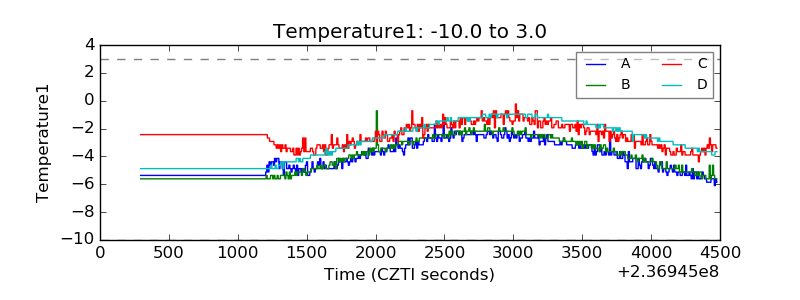 |
| Veto HV Monitor | 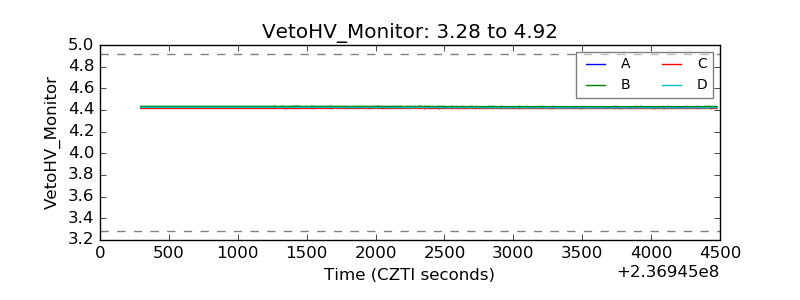 |
| Veto LLD | 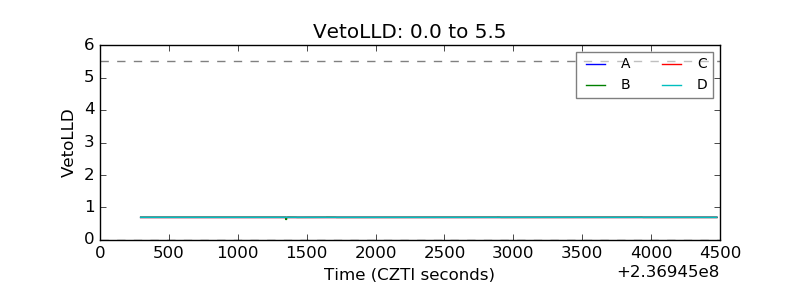 |
| Alpha Counter | 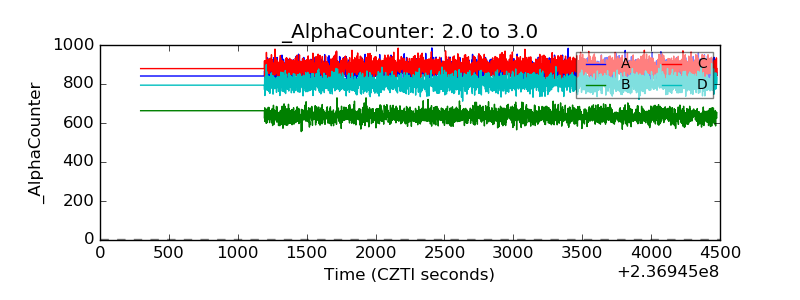 |
| _CPM_Rate | 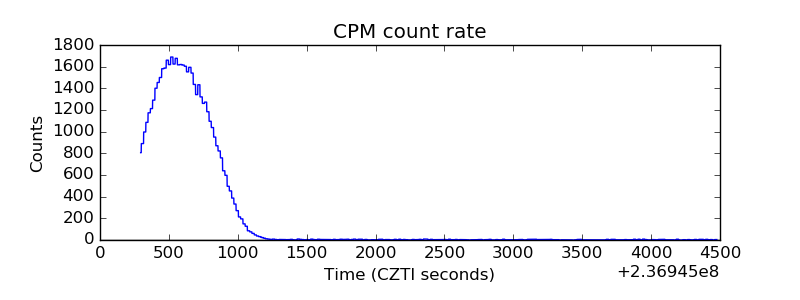 |
| CZT Counter | 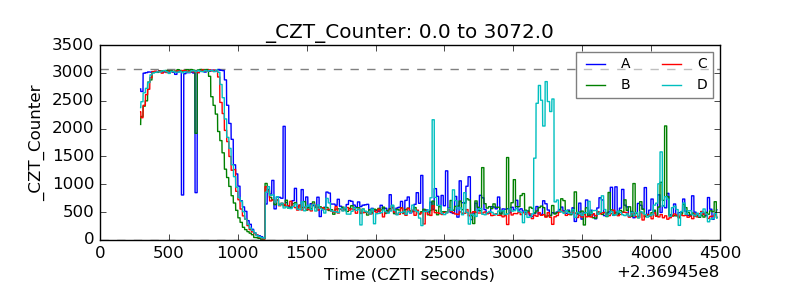 |
| +2.5 Volts monitor |  |
| +5 Volts monitor |  |
| _ROLL_ROT | 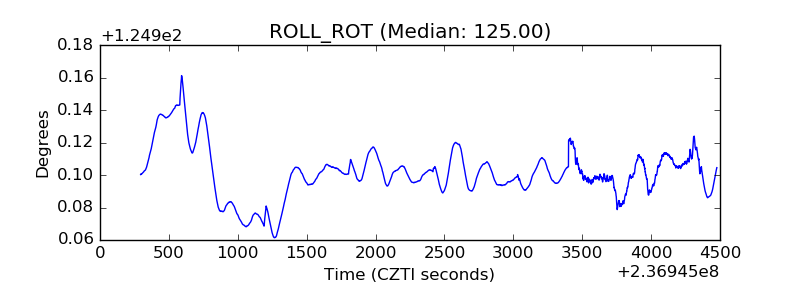 |
| _Roll_DEC | 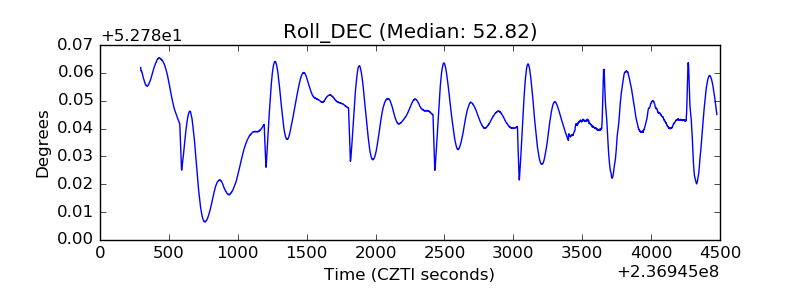 |
| _Roll_RA | 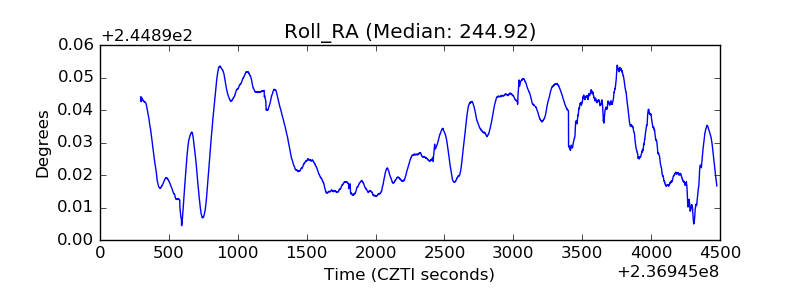 |
| Veto Counter | 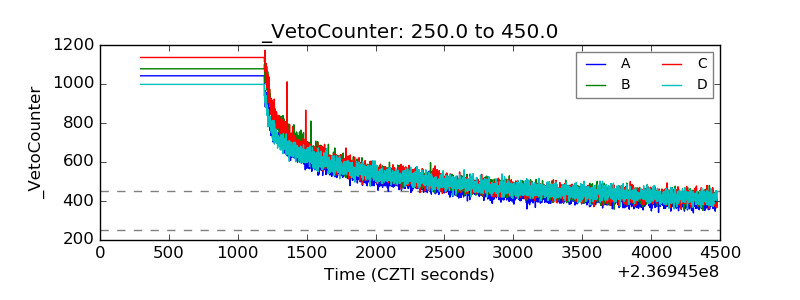 |