| Param | Original file | Final file |
|---|---|---|
| Filename | modeM0/AS1G07_027T01_9000001358cztM0_level2.fits | modeM0/AS1G07_027T01_9000001358cztM0_level2_quad_clean.evt |
| Size (bytes) | 140,834,880 | 170,472,960 |
| Size | 134.3 MB | 162.6 MB |
| Events in quadrant A | 868,292 | 1,104,772 |
| Events in quadrant B | 836,006 | 1,097,114 |
| Events in quadrant C | 858,812 | 1,041,715 |
| Events in quadrant D | 753,792 | 970,598 |
| Mode M9 | |||
|---|---|---|---|
| Quadrant | BADHDUFLAG | Total packets | Discarded packets |
| A | 0 | 32 | 0 |
| B | 0 | 32 | 0 |
| C | 0 | 32 | 0 |
| D | 0 | 33 | 0 |
| Mode M0 | |||
|---|---|---|---|
| Quadrant | BADHDUFLAG | Total packets | Discarded packets |
| A | 0 | 33227 | 0 |
| B | 0 | 29228 | 0 |
| C | 0 | 28576 | 0 |
| D | 0 | 29886 | 0 |
| Mode SS | |||
|---|---|---|---|
| Quadrant | BADHDUFLAG | Total packets | Discarded packets |
| A | 0 | 278 | 0 |
| B | 0 | 280 | 0 |
| C | 0 | 280 | 0 |
| D | 0 | 280 | 0 |
| Quadrant | Total seconds | Saturated seconds | Saturation percentage |
|---|---|---|---|
| A | 13724 | 339 | 2.470125% |
| B | 13733 | 230 | 1.674798% |
| C | 13732 | 182 | 1.325371% |
| D | 13730 | 230 | 1.675164% |
Noise dominated data is calculated using 1-second bins in cleaned event files. If a bin has >2000 counts, and if more than 50% of those come from <1% of pixels, then it is considered to be noise-dominated and hence unusable.
| Quadrant | # 1 sec bins | Bins with >0 counts | Bins with >2000 counts | High rate bins dominated by noise | Noise dominated (total time) | Noise dominated (detector-on time) | Marked lightcurve |
|---|---|---|---|---|---|---|---|
| A | 16155 | 13737 | 0 | 0 | 0.00% | 0.00% |  |
| B | 16155 | 13740 | 0 | 0 | 0.00% | 0.00% | 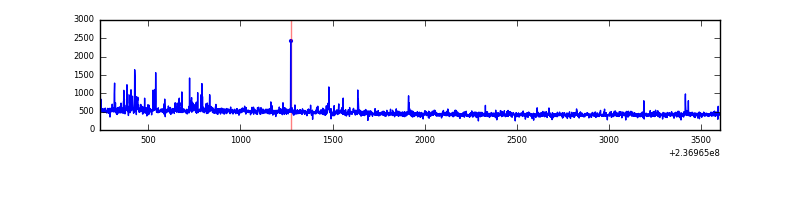 |
| C | 16155 | 13740 | 0 | 0 | 0.00% | 0.00% |  |
| D | 16155 | 13740 | 0 | 0 | 0.00% | 0.00% |  |
Top three noisy pixels from each quadrant. If the there are fewer than three noisy pixels in the level2.evt file, extra rows are filled as -1
| Pixel properties | Quadrant properties | ||||||
|---|---|---|---|---|---|---|---|
| Quadrant | DetID | PixID | Counts | Sigma | Mean | Median | Sigma |
| A | 0 | 29 | 842 | 10.79 | 226 | 213 | 58.3 |
| A | 7 | 110 | 756 | 9.32 | 226 | 213 | 58.3 |
| A | 9 | 19 | 666 | 7.77 | 226 | 213 | 58.3 |
| B | 2 | 9 | 755 | 11.83 | 220 | 211 | 46.0 |
| B | 5 | 128 | 578 | 7.98 | 220 | 211 | 46.0 |
| B | 12 | 226 | 562 | 7.63 | 220 | 211 | 46.0 |
| C | 1 | 80 | 709 | 8.27 | 226 | 213 | 60.0 |
| C | 1 | 81 | 707 | 8.23 | 226 | 213 | 60.0 |
| C | 3 | 158 | 583 | 6.17 | 226 | 213 | 60.0 |
| D | 1 | 19 | 556 | 6.21 | 214 | 196 | 58.0 |
| D | 6 | 231 | 547 | 6.05 | 214 | 196 | 58.0 |
| D | 6 | 67 | 546 | 6.04 | 214 | 196 | 58.0 |
Histogram calculated using DETX and DETY for each event in the final _common_clean file
| Quadrant A |  |
 |
Quadrant B |
|---|---|---|---|
| Quadrant D |  |
 |
Quadrant C |
| Plot type | Count rate plots | Images |
|---|---|---|
| Comparison with Poisson distribution Blue bars denote a histogram of data divided into 1 sec bins. Red curve is a Poisson curve with rate = median count rate of data. |
 |
 |
| Quadrant-wise count rates Data is divided into 100 sec bins |
 |
|
| Module-wise count rates for Quadrant A Data is divided into 100 sec bins |
 |
 |
| Module-wise count rates for Quadrant B Data is divided into 100 sec bins |
 |
 |
| Module-wise count rates for Quadrant C Data is divided into 100 sec bins |
 |
 |
| Module-wise count rates for Quadrant D Data is divided into 100 sec bins |
 |
 |
| Parameter | Plot |
|---|---|
| CZT HV Monitor |  |
| D_VDD |  |
| Temperature 1 |  |
| Veto HV Monitor |  |
| Veto LLD |  |
| Alpha Counter |  |
| _CPM_Rate |  |
| CZT Counter |  |
| +2.5 Volts monitor |  |
| +5 Volts monitor |  |
| _ROLL_ROT |  |
| _Roll_DEC |  |
| _Roll_RA |  |
| Veto Counter |  |