| Param | Original file | Final file |
|---|---|---|
| Filename | modeM0/AS1G07_027T01_9000001358_09569cztM0_level2.evt | modeM0/AS1G07_027T01_9000001358_09569cztM0_level2_quad_clean.evt |
| Size (bytes) | 452,171,520 | 96,413,760 |
| Size | 431.2 MB | 91.9 MB |
| Events in quadrant A | 3,699,470 | 626,142 |
| Events in quadrant B | 3,229,655 | 632,007 |
| Events in quadrant C | 3,127,682 | 621,369 |
| Events in quadrant D | 3,213,682 | 605,682 |
| Mode M9 | |||
|---|---|---|---|
| Quadrant | BADHDUFLAG | Total packets | Discarded packets |
| A | 0 | 24 | 1 |
| B | 0 | 24 | 0 |
| C | 0 | 24 | 0 |
| D | 0 | 24 | 1 |
| Mode M0 | |||
|---|---|---|---|
| Quadrant | BADHDUFLAG | Total packets | Discarded packets |
| A | 0 | 15751 | 651 |
| B | 0 | 13855 | 462 |
| C | 0 | 13532 | 432 |
| D | 0 | 13935 | 454 |
| Mode SS | |||
|---|---|---|---|
| Quadrant | BADHDUFLAG | Total packets | Discarded packets |
| A | 0 | 134 | 4 |
| B | 0 | 134 | 6 |
| C | 0 | 134 | 6 |
| D | 0 | 133 | 5 |
| Quadrant | Total seconds | Saturated seconds | Saturation percentage |
|---|---|---|---|
| A | 6208 | 230 | 3.704897% |
| B | 6230 | 163 | 2.616372% |
| C | 6239 | 140 | 2.243949% |
| D | 6229 | 156 | 2.504415% |
Noise dominated data is calculated using 1-second bins in cleaned event files. If a bin has >2000 counts, and if more than 50% of those come from <1% of pixels, then it is considered to be noise-dominated and hence unusable.
| Quadrant | # 1 sec bins | Bins with >0 counts | Bins with >2000 counts | High rate bins dominated by noise | Noise dominated (total time) | Noise dominated (detector-on time) | Marked lightcurve |
|---|---|---|---|---|---|---|---|
| A | 8867 | 6283 | 2 | 2 | 0.02% | 0.03% | 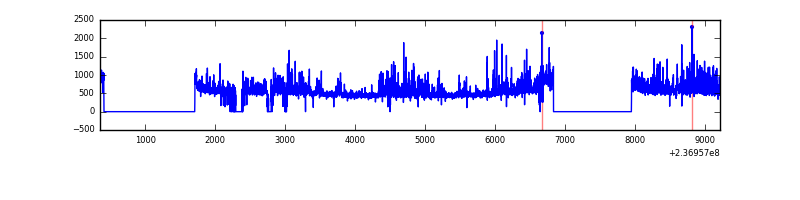 |
| B | 8867 | 6305 | 0 | 0 | 0.00% | 0.00% | 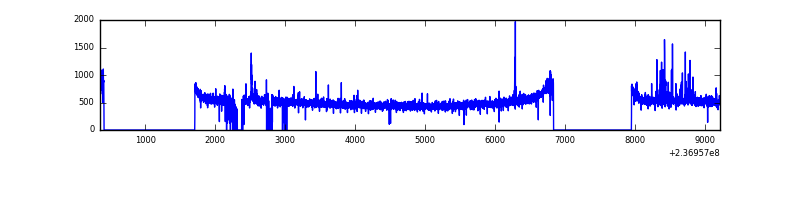 |
| C | 8867 | 6317 | 1 | 1 | 0.01% | 0.02% | 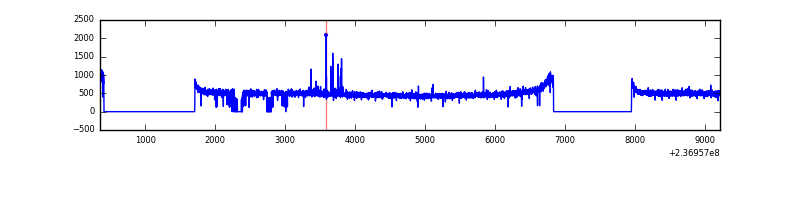 |
| D | 8867 | 6318 | 14 | 14 | 0.16% | 0.22% | 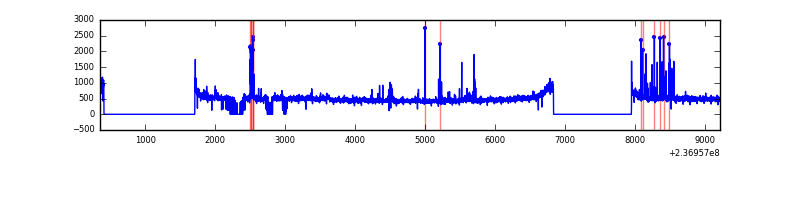 |
Top three noisy pixels from each quadrant. If the there are fewer than three noisy pixels in the level2.evt file, extra rows are filled as -1
| Pixel properties | Quadrant properties | ||||||
|---|---|---|---|---|---|---|---|
| Quadrant | DetID | PixID | Counts | Sigma | Mean | Median | Sigma |
| A | 1 | 162 | 237444 | 1439.85 | 809 | 794 | 164.4 |
| A | 1 | 178 | 118707 | 717.42 | 809 | 794 | 164.4 |
| A | 1 | 161 | 113116 | 683.4 | 809 | 794 | 164.4 |
| B | 4 | 80 | 49829 | 318.52 | 810 | 791 | 154.0 |
| B | 12 | 111 | 17030 | 105.48 | 810 | 791 | 154.0 |
| B | 11 | 111 | 13696 | 83.82 | 810 | 791 | 154.0 |
| C | 9 | 236 | 31430 | 167.45 | 794 | 801 | 182.9 |
| C | 13 | 61 | 5763 | 27.13 | 794 | 801 | 182.9 |
| C | 14 | 234 | 2342 | 8.42 | 794 | 801 | 182.9 |
| D | 1 | 52 | 92060 | 478.37 | 792 | 775 | 190.8 |
| D | 7 | 71 | 46577 | 240.02 | 792 | 775 | 190.8 |
| D | 12 | 233 | 28513 | 145.36 | 792 | 775 | 190.8 |
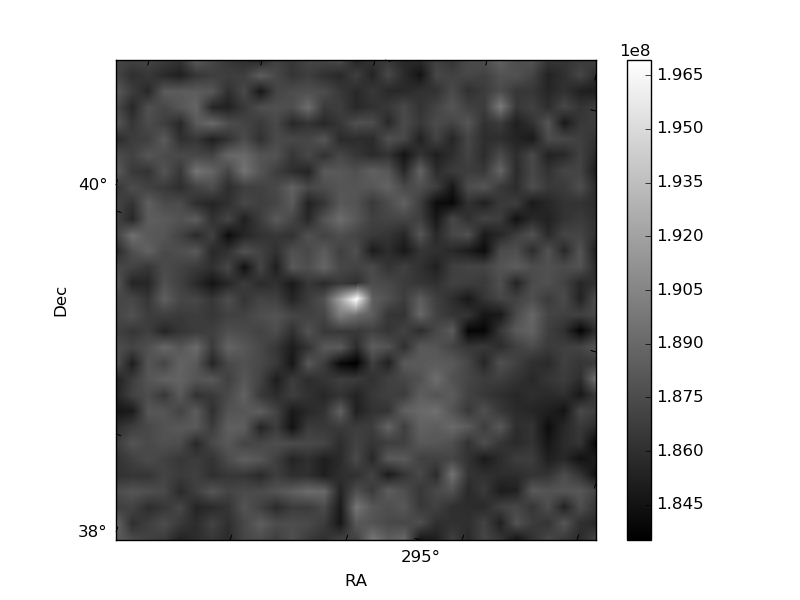
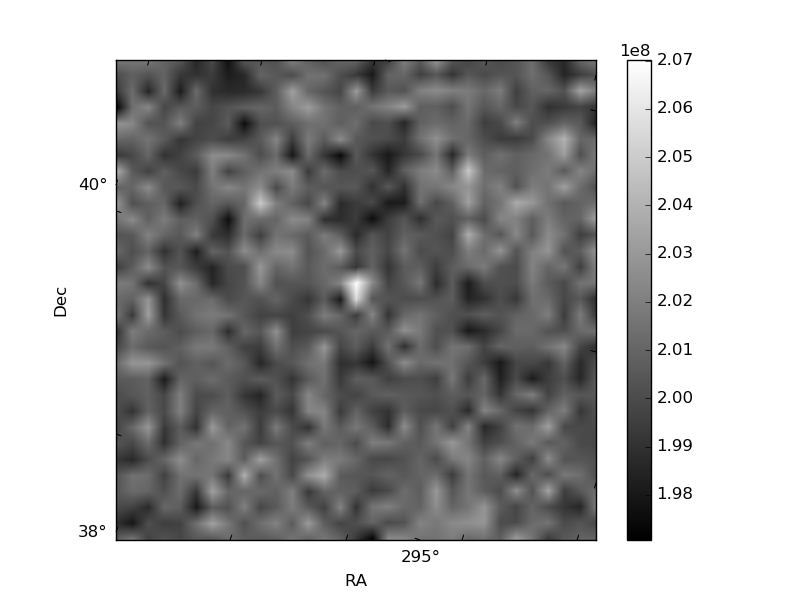
Histogram calculated using DETX and DETY for each event in the final _common_clean file
| Quadrant A | 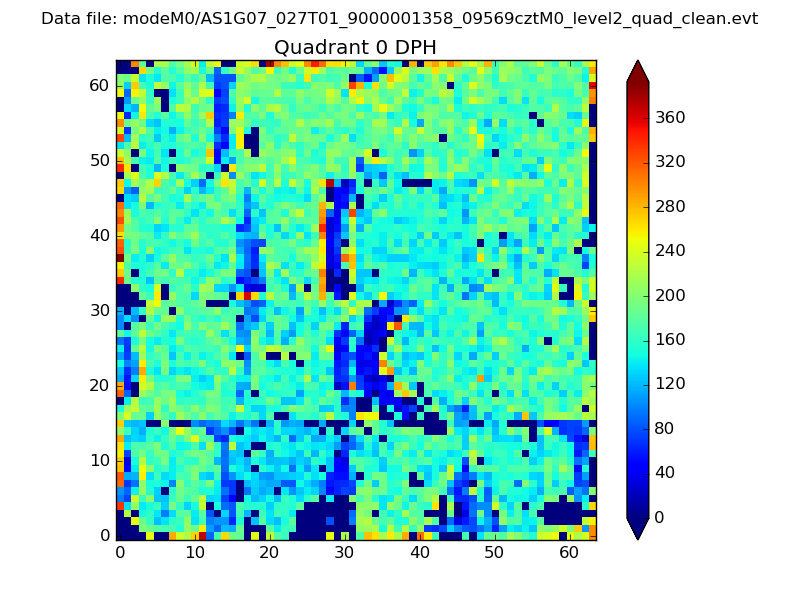 |
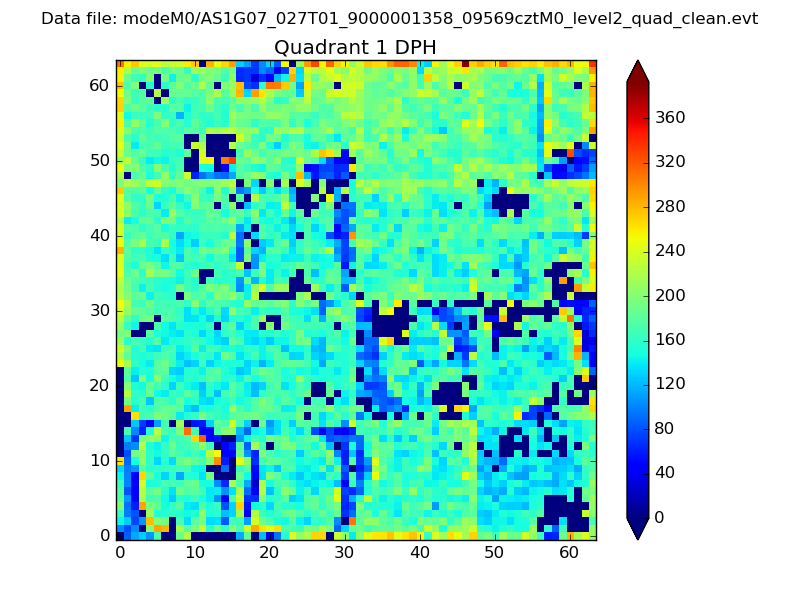 |
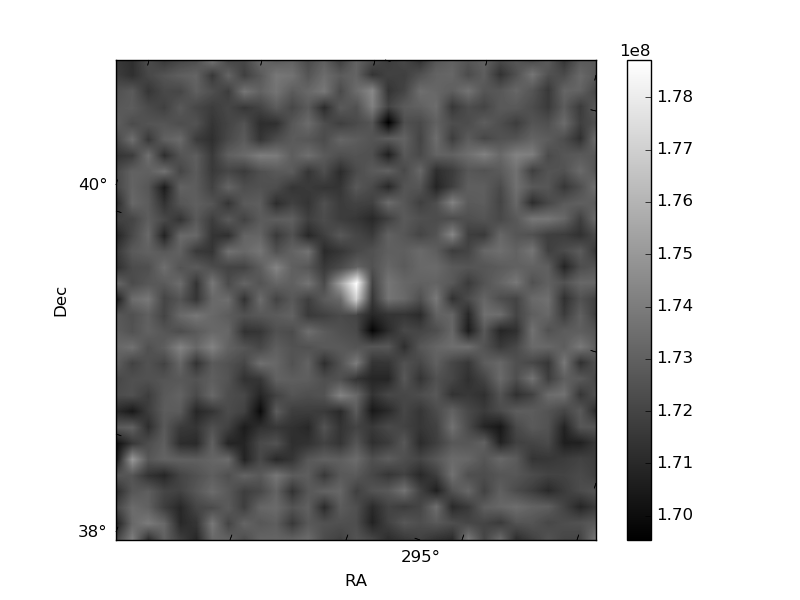
Quadrant B |
|---|---|---|---|
| Quadrant D | 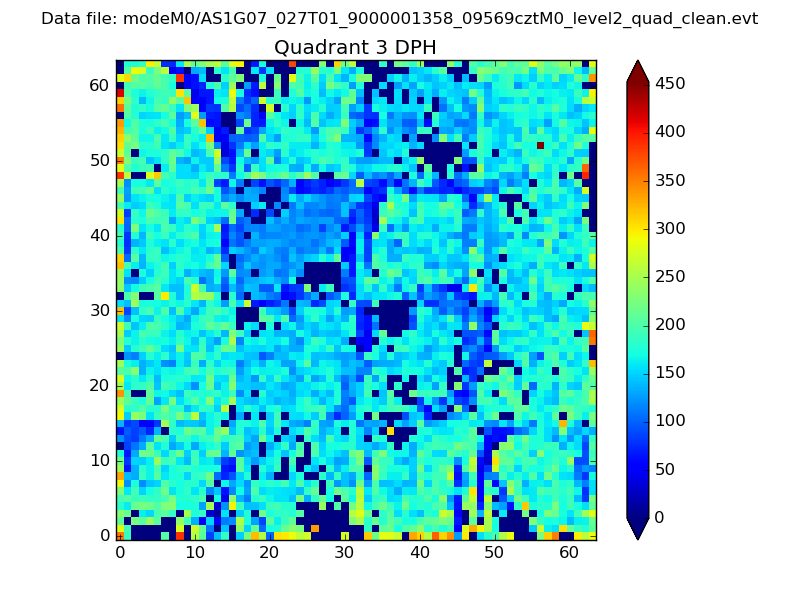 |
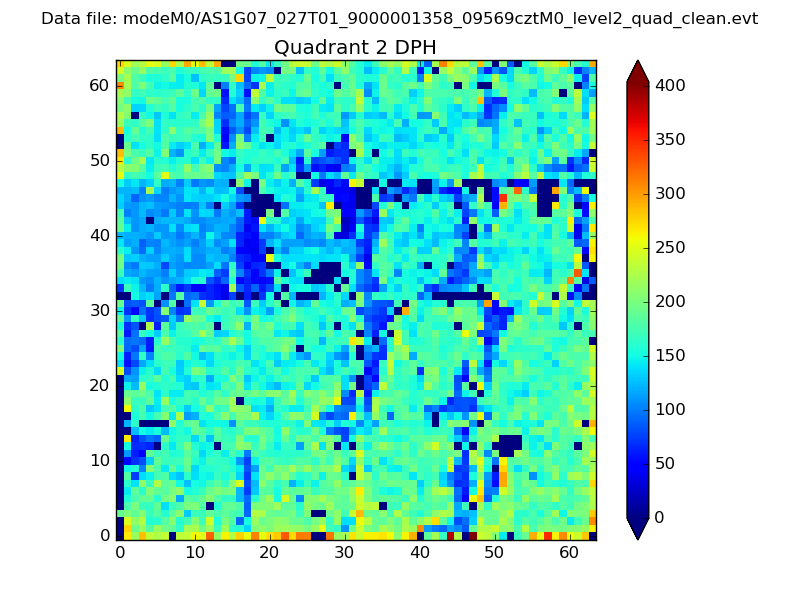 |
Quadrant C |
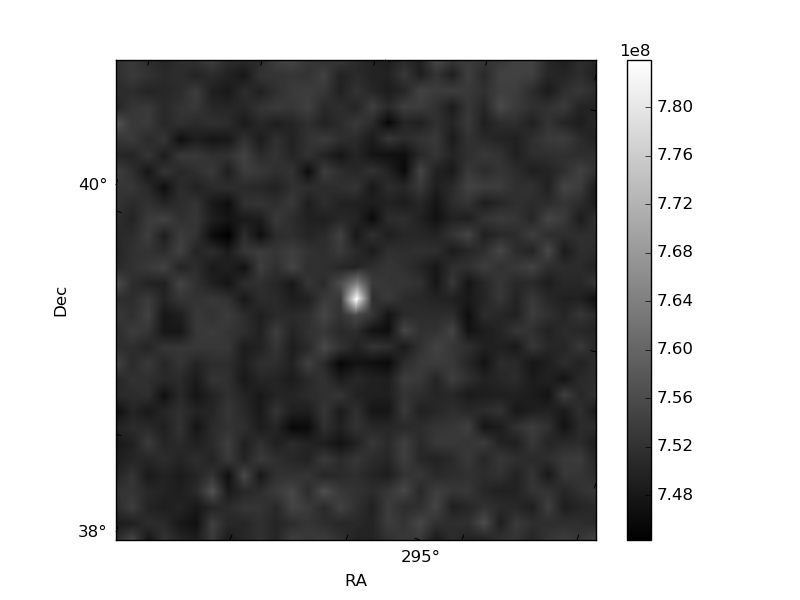
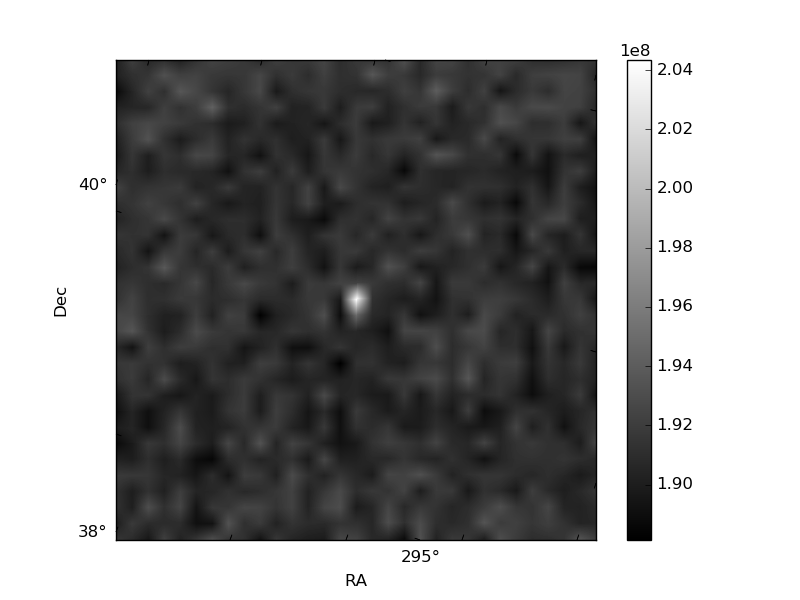
| Plot type | Count rate plots | Images |
|---|---|---|
| Comparison with Poisson distribution Blue bars denote a histogram of data divided into 1 sec bins. Red curve is a Poisson curve with rate = median count rate of data. |
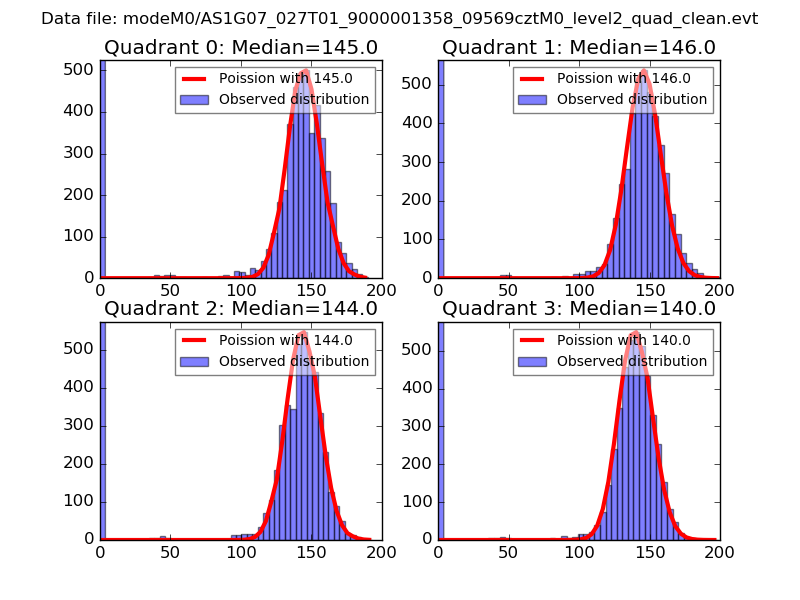 |
 |
| Quadrant-wise count rates Data is divided into 100 sec bins |
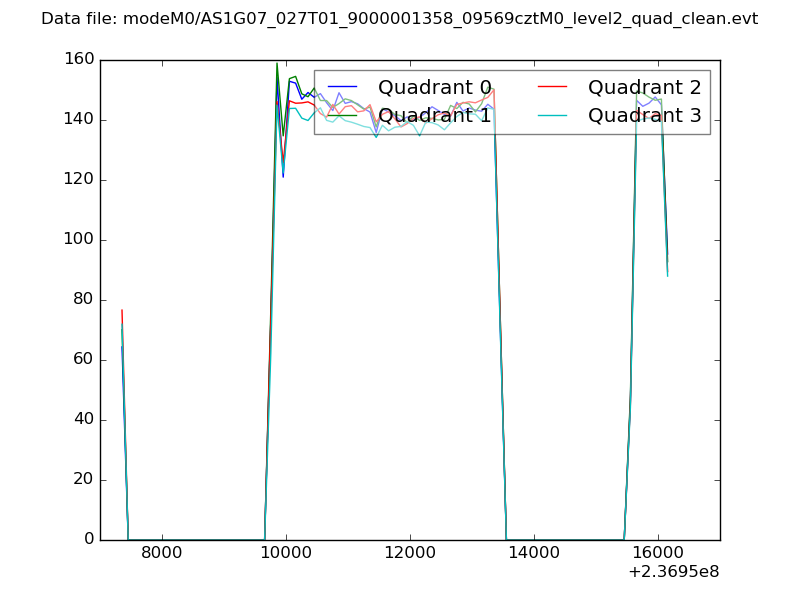 |
|
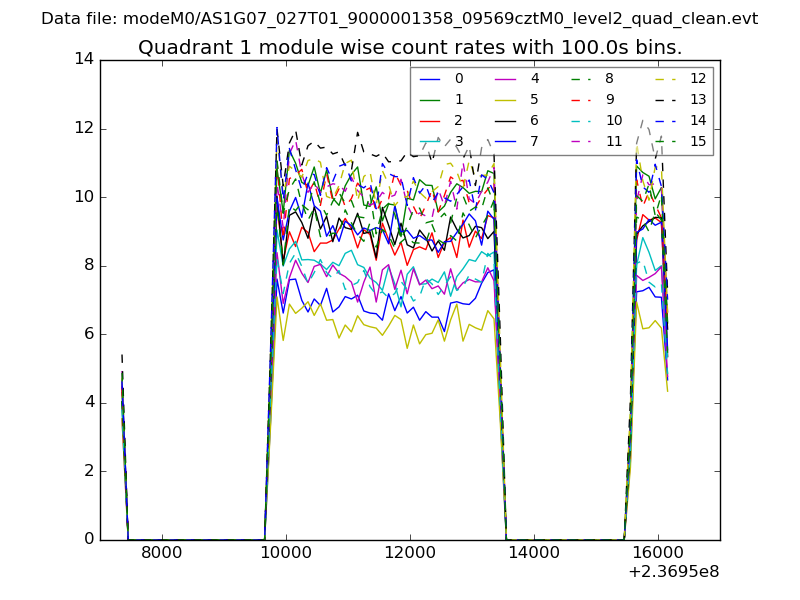
| Module-wise count rates for Quadrant A Data is divided into 100 sec bins |
 |
 |
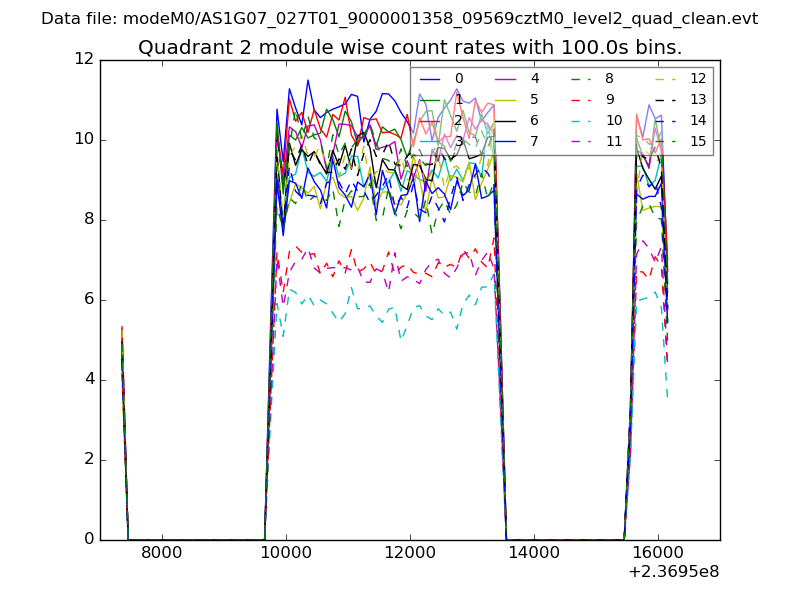
| Module-wise count rates for Quadrant B Data is divided into 100 sec bins |
 |
 |
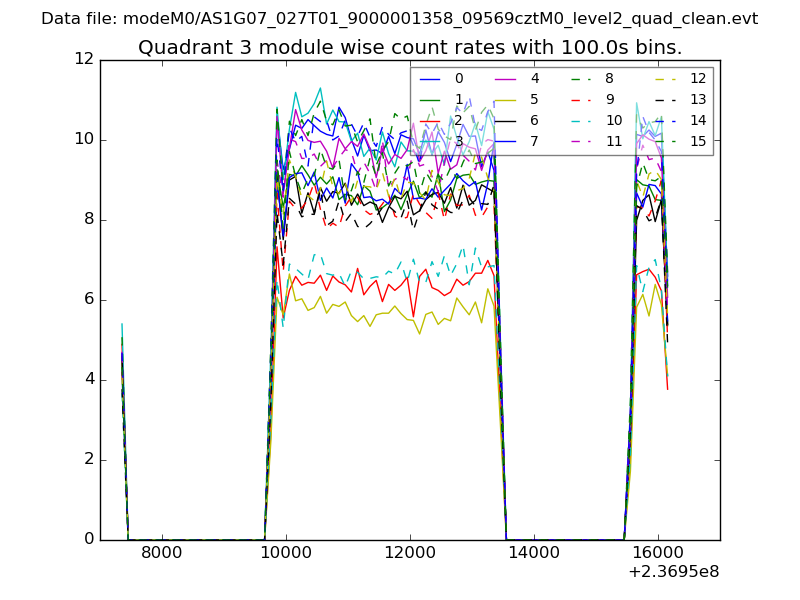
| Module-wise count rates for Quadrant C Data is divided into 100 sec bins |
 |
 |
| Module-wise count rates for Quadrant D Data is divided into 100 sec bins |
 |
 |
| Parameter | Plot |
|---|---|
| CZT HV Monitor |  |
| D_VDD | 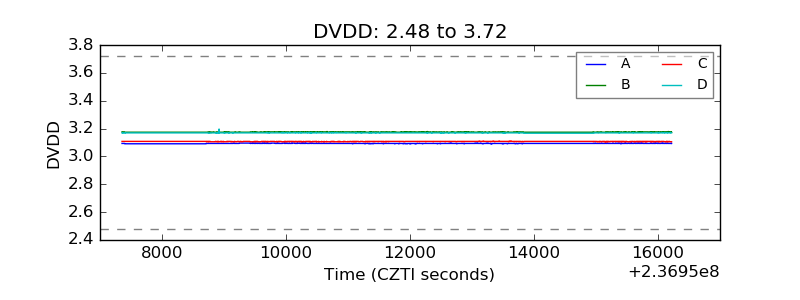 |
| Temperature 1 | 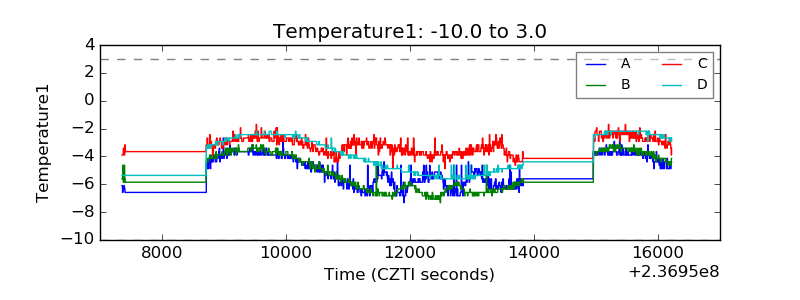 |
| Veto HV Monitor | 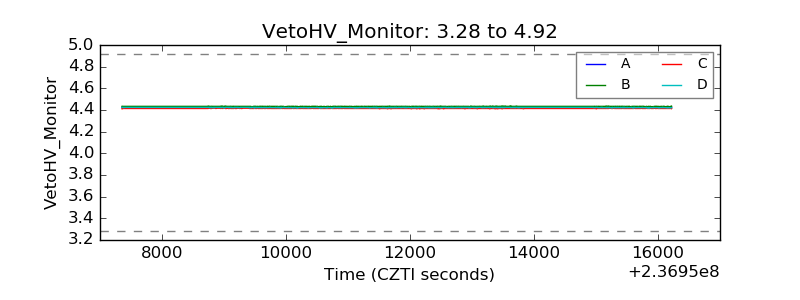 |
| Veto LLD |  |
| Alpha Counter | 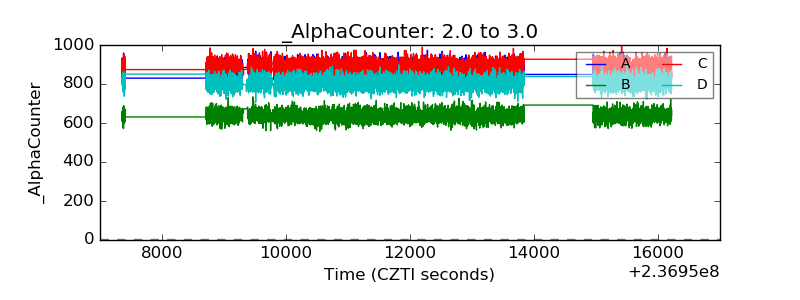 |
| _CPM_Rate | 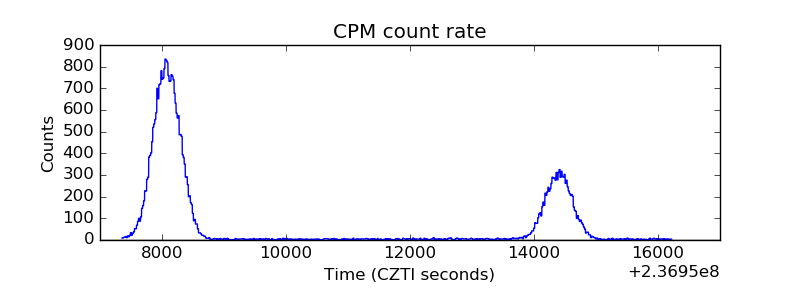 |
| CZT Counter | 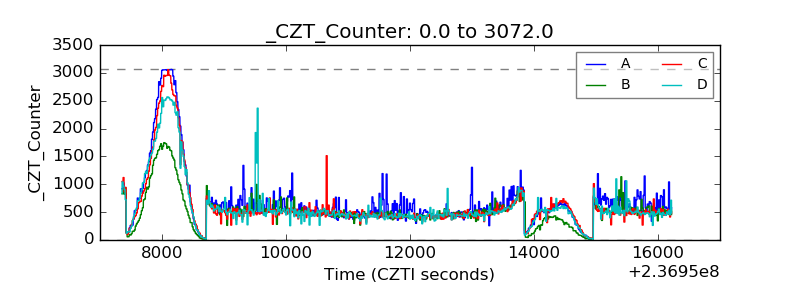 |
| +2.5 Volts monitor |  |
| +5 Volts monitor |  |
| _ROLL_ROT |  |
| _Roll_DEC | 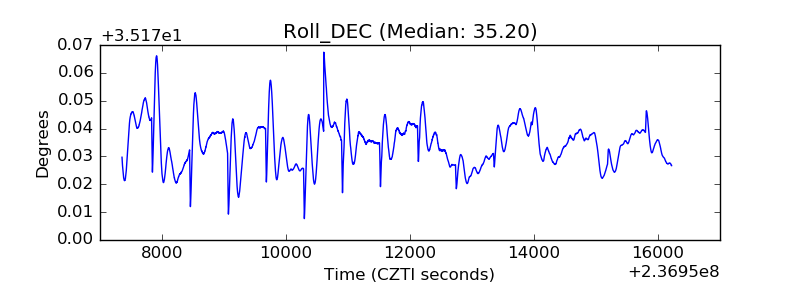 |
| _Roll_RA | 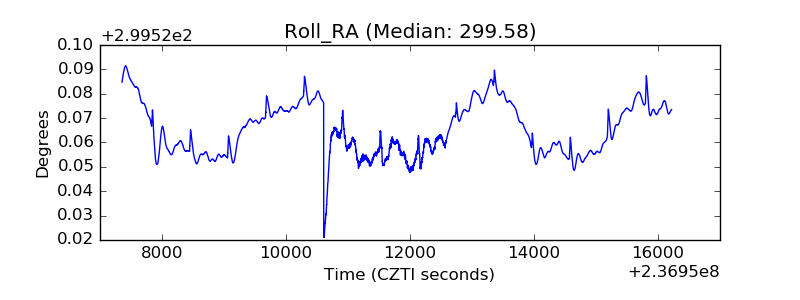 |
| Veto Counter | 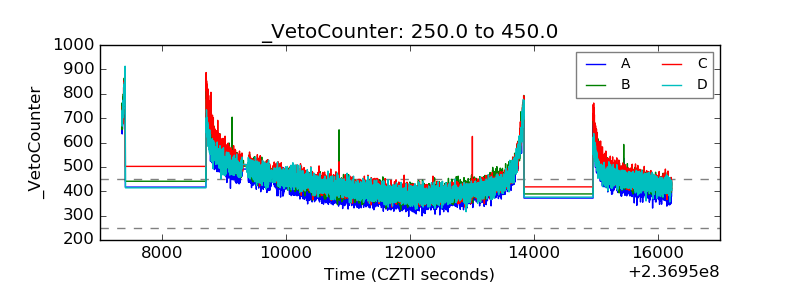 |