| Param | Original file | Final file |
|---|---|---|
| Filename | modeM0/AS1G07_027T01_9000001358_09570cztM0_level2.evt | modeM0/AS1G07_027T01_9000001358_09570cztM0_level2_quad_clean.evt |
| Size (bytes) | 225,472,320 | 62,242,560 |
| Size | 215.0 MB | 59.4 MB |
| Events in quadrant A | 1,948,862 | 416,648 |
| Events in quadrant B | 1,598,766 | 418,255 |
| Events in quadrant C | 1,516,807 | 409,511 |
| Events in quadrant D | 1,533,134 | 401,370 |
| Mode M0 | |||
|---|---|---|---|
| Quadrant | BADHDUFLAG | Total packets | Discarded packets |
| A | 0 | 8071 | 0 |
| B | 0 | 6969 | 0 |
| C | 0 | 6754 | 2 |
| D | 0 | 6913 | 6 |
| Mode SS | |||
|---|---|---|---|
| Quadrant | BADHDUFLAG | Total packets | Discarded packets |
| A | 0 | 68 | 0 |
| B | 0 | 68 | 0 |
| C | 0 | 68 | 0 |
| D | 0 | 68 | 0 |
| Quadrant | Total seconds | Saturated seconds | Saturation percentage |
|---|---|---|---|
| A | 3366 | 35 | 1.039810% |
| B | 3366 | 6 | 0.178253% |
| C | 3365 | 3 | 0.089153% |
| D | 3363 | 8 | 0.237883% |
Noise dominated data is calculated using 1-second bins in cleaned event files. If a bin has >2000 counts, and if more than 50% of those come from <1% of pixels, then it is considered to be noise-dominated and hence unusable.
| Quadrant | # 1 sec bins | Bins with >0 counts | Bins with >2000 counts | High rate bins dominated by noise | Noise dominated (total time) | Noise dominated (detector-on time) | Marked lightcurve |
|---|---|---|---|---|---|---|---|
| A | 3366 | 3366 | 4 | 4 | 0.12% | 0.12% | 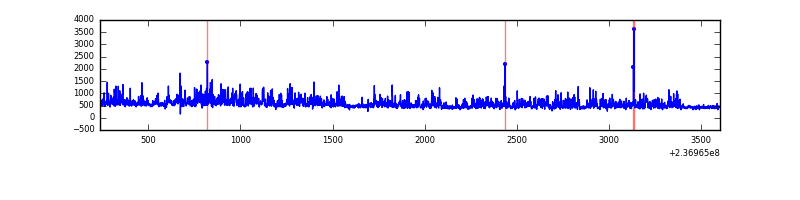 |
| B | 3366 | 3366 | 1 | 1 | 0.03% | 0.03% | 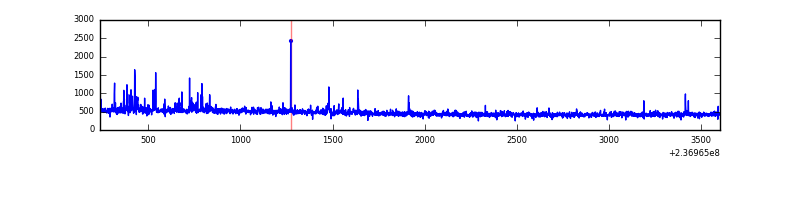 |
| C | 3366 | 3366 | 0 | 0 | 0.00% | 0.00% | 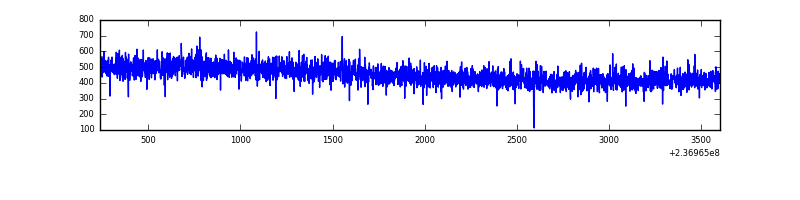 |
| D | 3366 | 3366 | 5 | 5 | 0.15% | 0.15% | 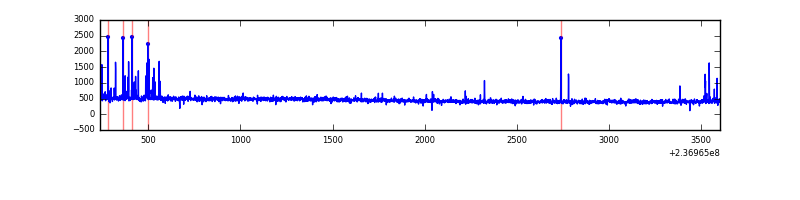 |
Top three noisy pixels from each quadrant. If the there are fewer than three noisy pixels in the level2.evt file, extra rows are filled as -1
| Pixel properties | Quadrant properties | ||||||
|---|---|---|---|---|---|---|---|
| Quadrant | DetID | PixID | Counts | Sigma | Mean | Median | Sigma |
| A | 1 | 162 | 166071 | 2058.77 | 393 | 387 | 80.5 |
| A | 1 | 178 | 89678 | 1109.52 | 393 | 387 | 80.5 |
| A | 1 | 161 | 83296 | 1030.22 | 393 | 387 | 80.5 |
| B | 4 | 80 | 46737 | 617.08 | 395 | 388 | 75.1 |
| B | 12 | 111 | 8015 | 101.54 | 395 | 388 | 75.1 |
| B | 10 | 252 | 6818 | 85.61 | 395 | 388 | 75.1 |
| C | 9 | 236 | 3003 | 28.9 | 388 | 390 | 90.4 |
| C | 13 | 61 | 2747 | 26.07 | 388 | 390 | 90.4 |
| C | 3 | 202 | 962 | 6.33 | 388 | 390 | 90.4 |
| D | 1 | 52 | 37407 | 398.43 | 385 | 377 | 92.9 |
| D | 2 | 234 | 18532 | 195.34 | 385 | 377 | 92.9 |
| D | 2 | 14 | 12603 | 131.55 | 385 | 377 | 92.9 |
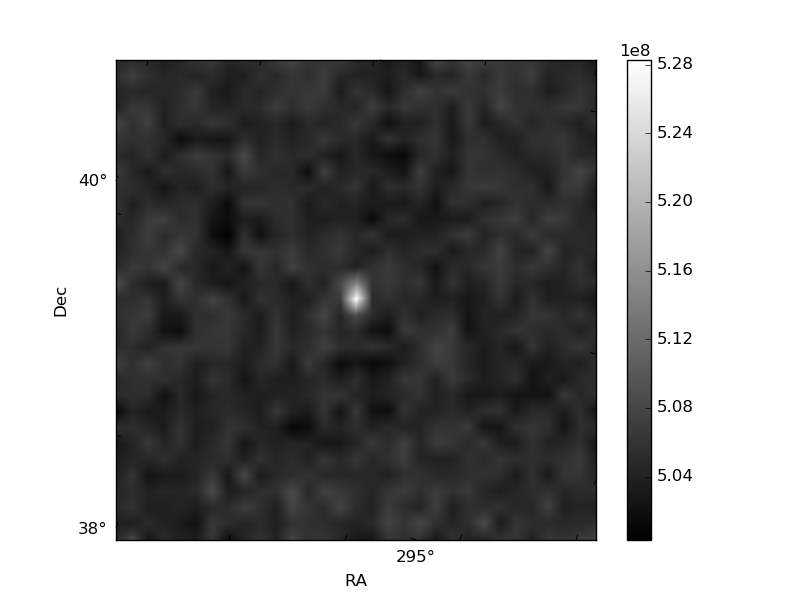
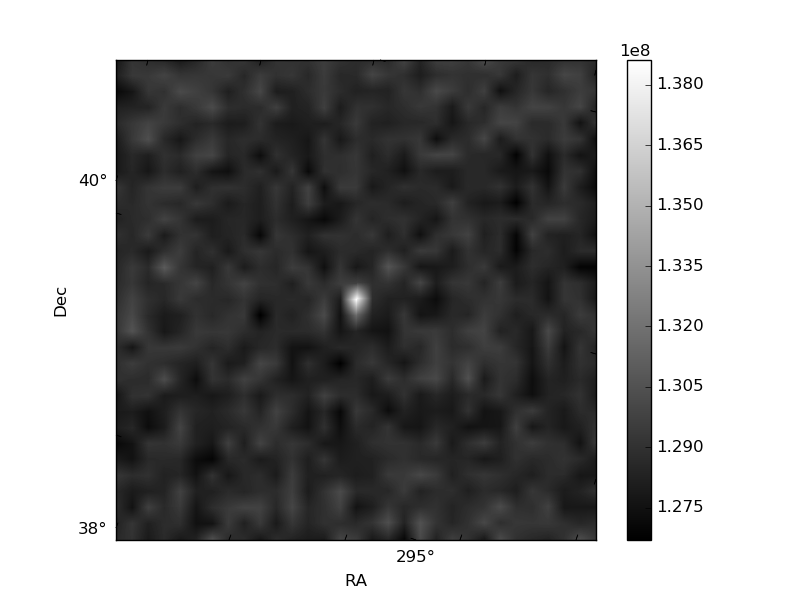
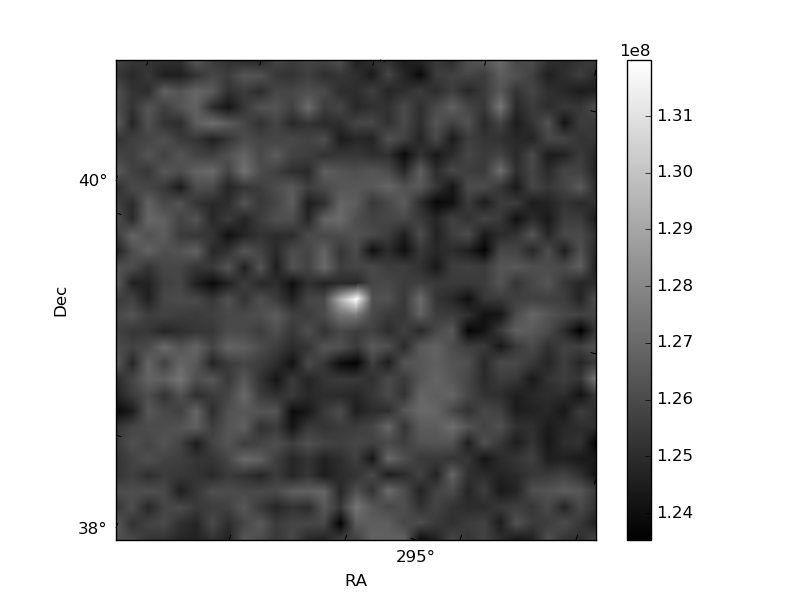
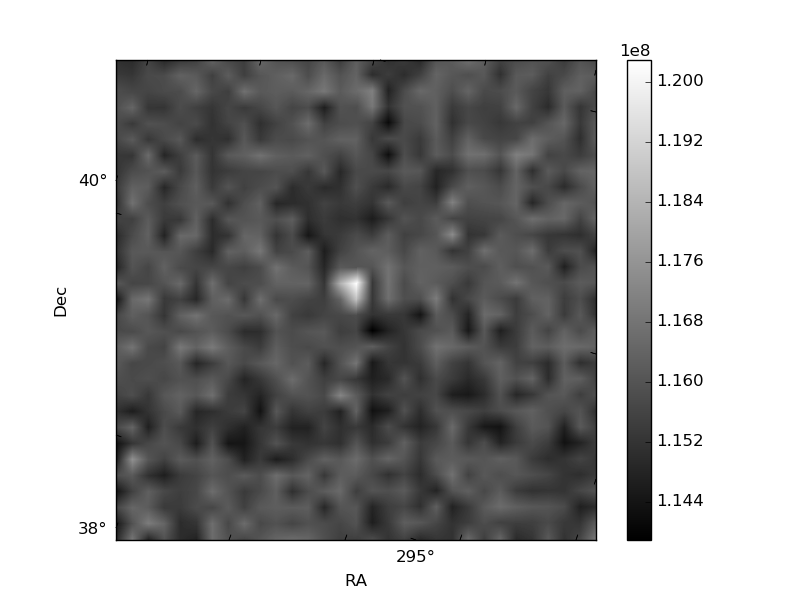
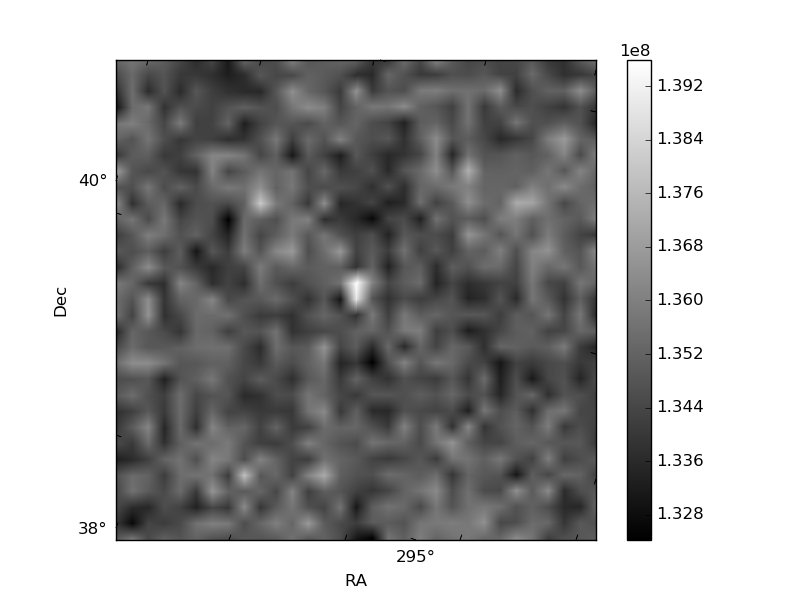
Histogram calculated using DETX and DETY for each event in the final _common_clean file
| Quadrant A | 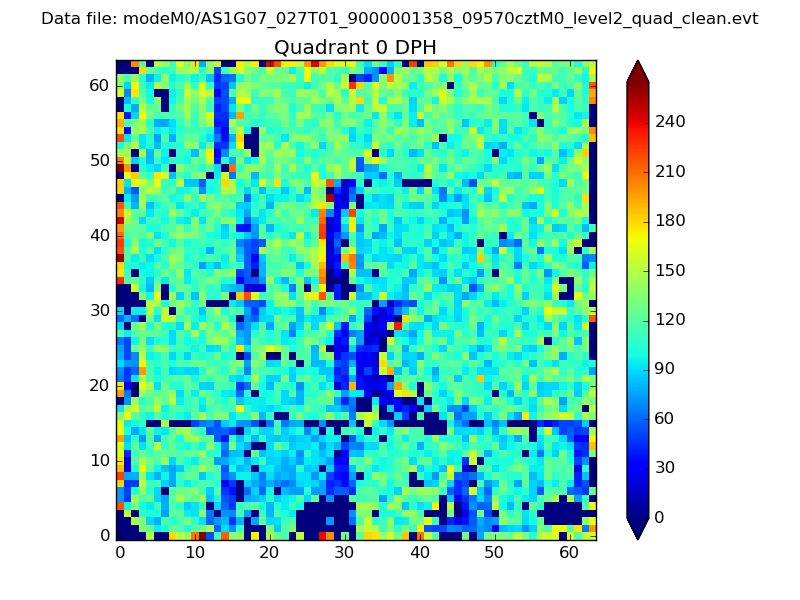 |
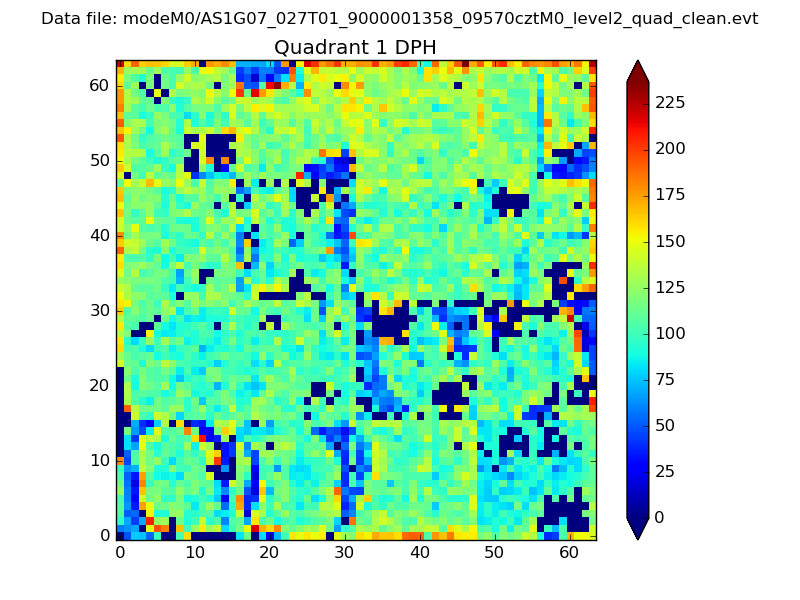 |
Quadrant B |
|---|---|---|---|
| Quadrant D | 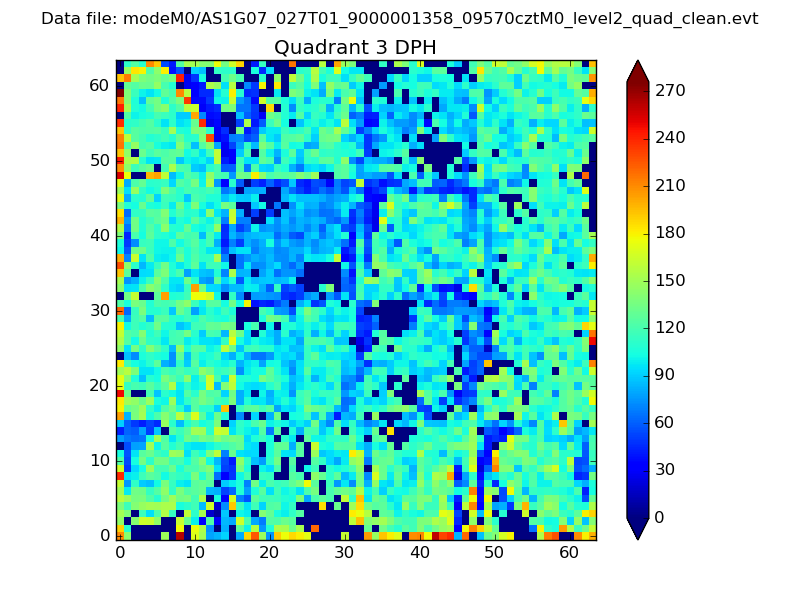 |
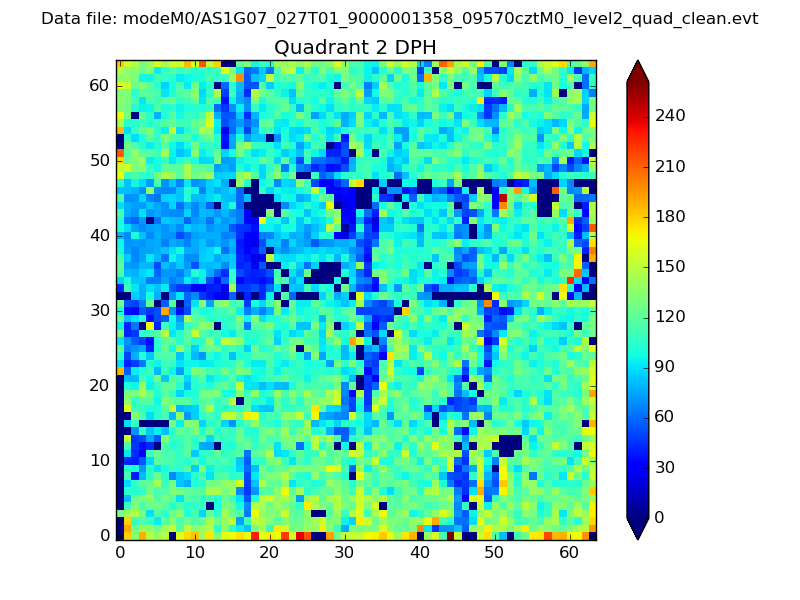 |
Quadrant C |
| Plot type | Count rate plots | Images |
|---|---|---|
| Comparison with Poisson distribution Blue bars denote a histogram of data divided into 1 sec bins. Red curve is a Poisson curve with rate = median count rate of data. |
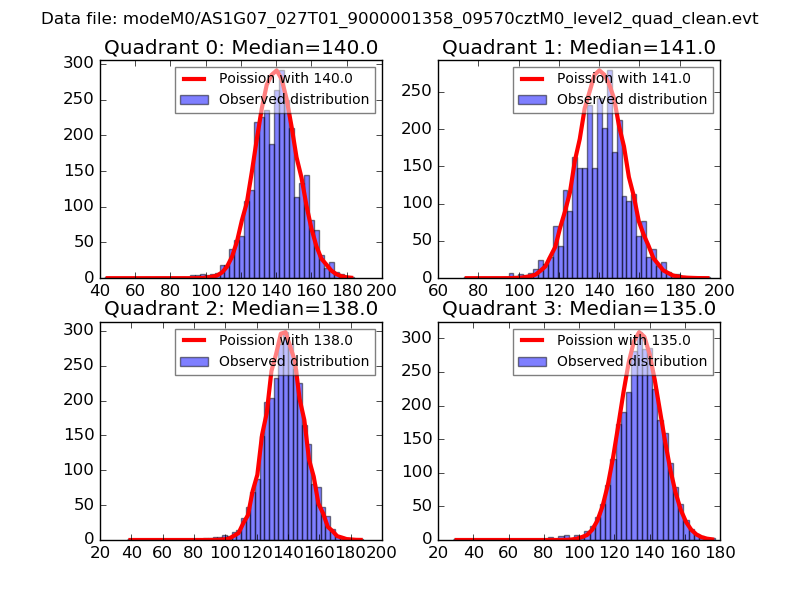 |
 |
| Quadrant-wise count rates Data is divided into 100 sec bins |
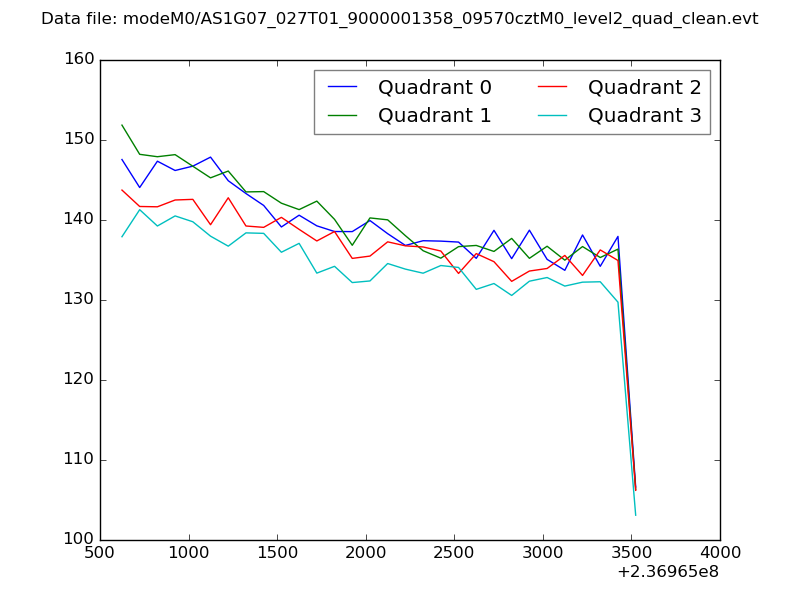 |
|
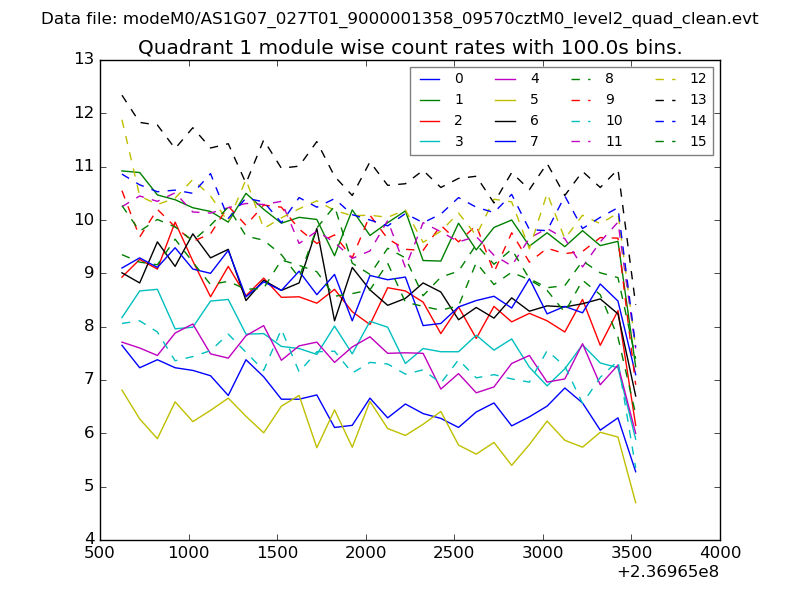
| Module-wise count rates for Quadrant A Data is divided into 100 sec bins |
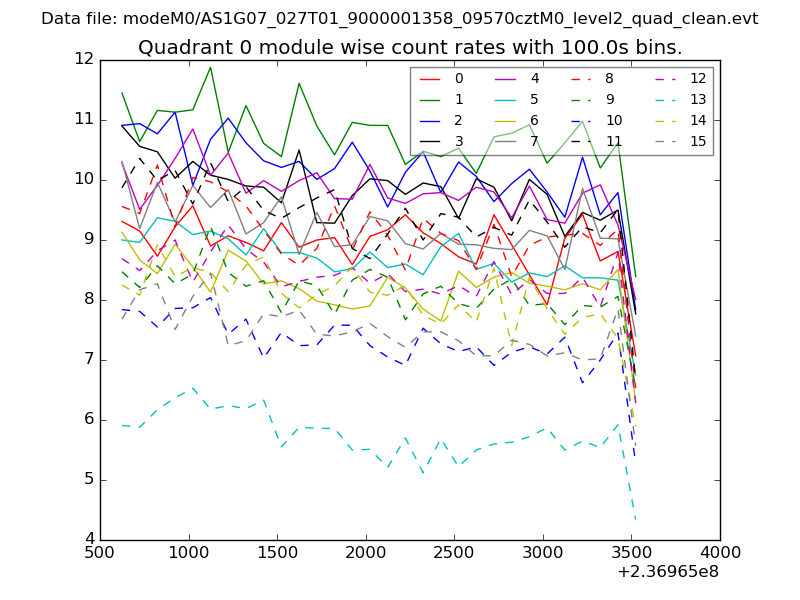 |
 |
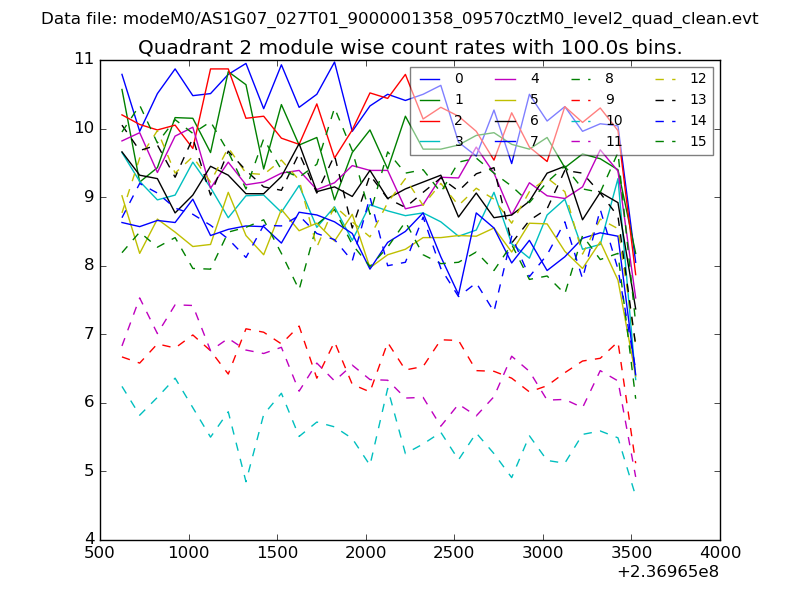
| Module-wise count rates for Quadrant B Data is divided into 100 sec bins |
 |
 |
| Module-wise count rates for Quadrant C Data is divided into 100 sec bins |
 |
 |
| Module-wise count rates for Quadrant D Data is divided into 100 sec bins |
 |
 |
| Parameter | Plot |
|---|---|
| CZT HV Monitor | 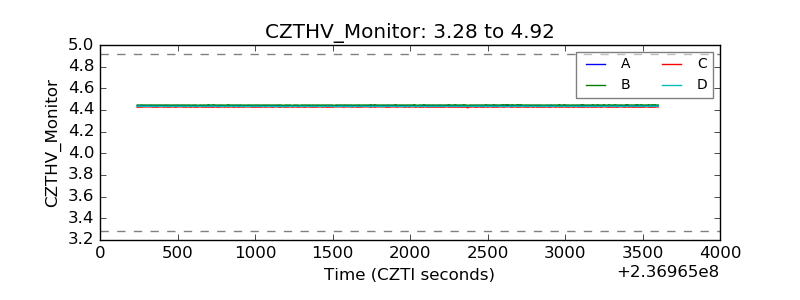 |
| D_VDD | 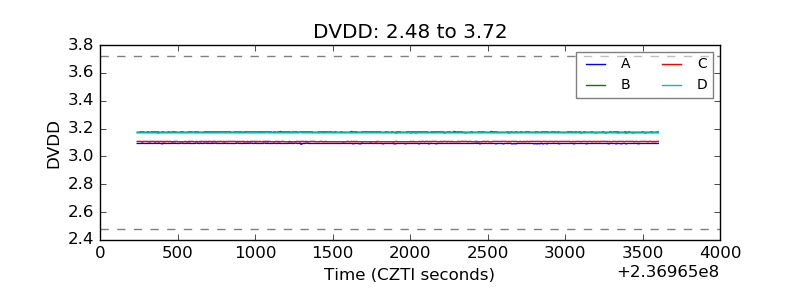 |
| Temperature 1 | 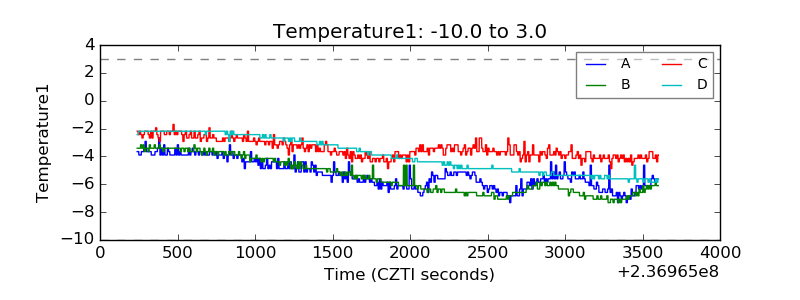 |
| Veto HV Monitor | 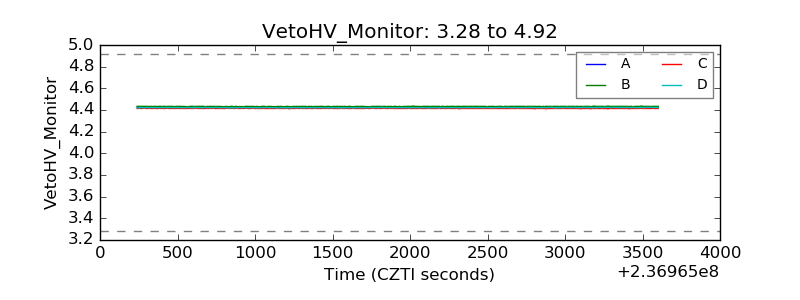 |
| Veto LLD | 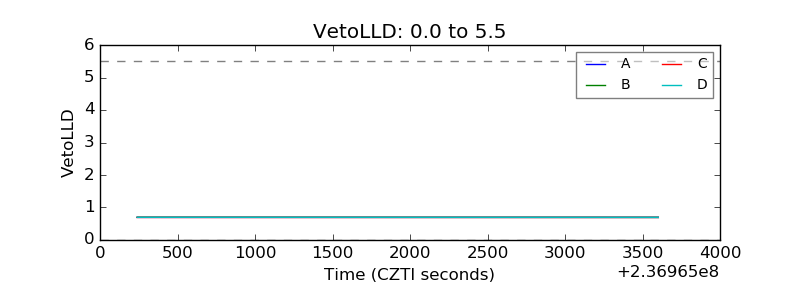 |
| Alpha Counter | 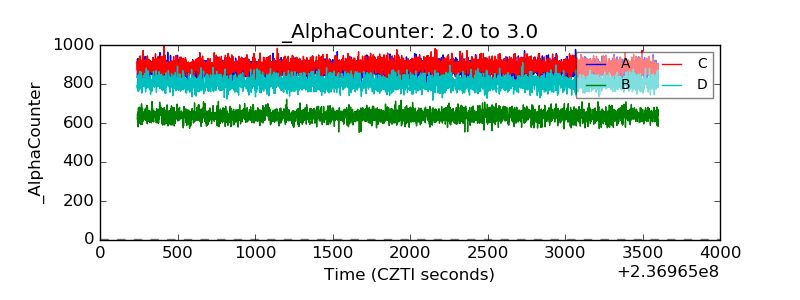 |
| _CPM_Rate | 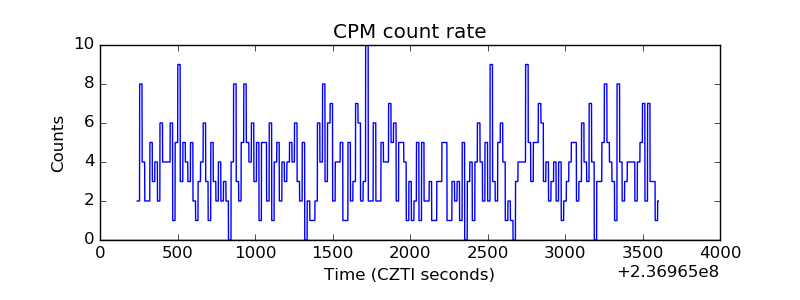 |
| CZT Counter | 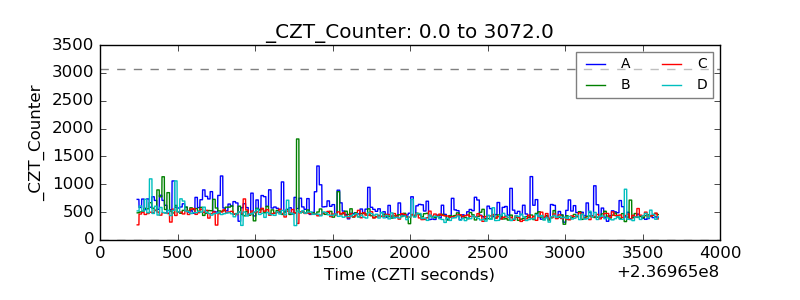 |
| +2.5 Volts monitor |  |
| +5 Volts monitor |  |
| _ROLL_ROT | 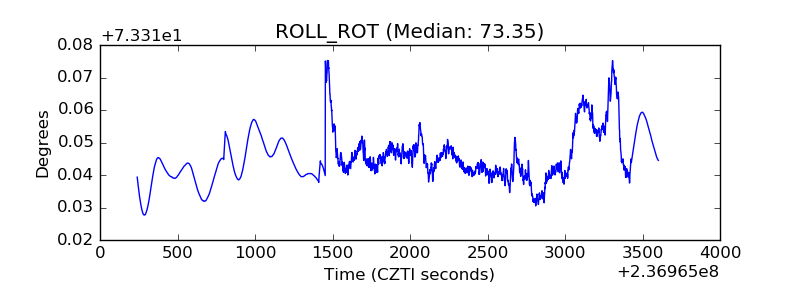 |
| _Roll_DEC | 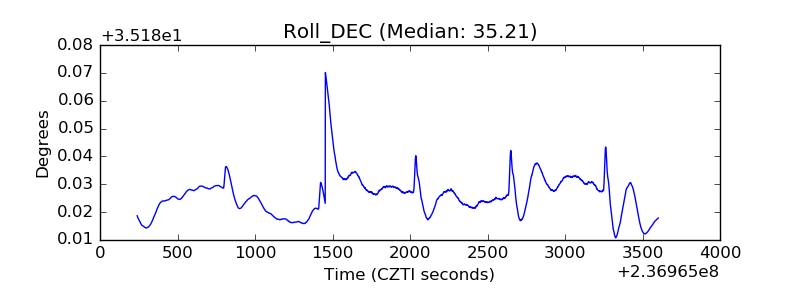 |
| _Roll_RA | 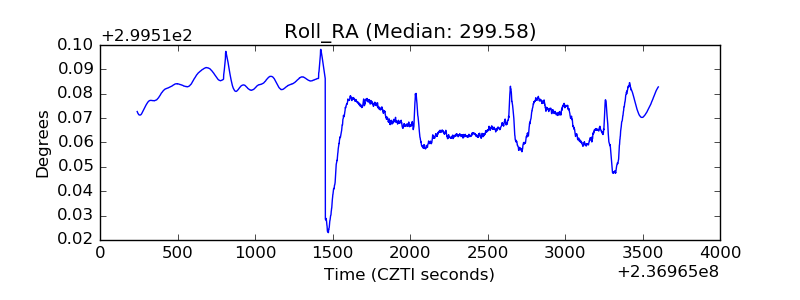 |
| Veto Counter |  |