| Param | Original file | Final file |
|---|---|---|
| Filename | modeM0/AS1G07_042T01_9000001360cztM0_level2.fits | modeM0/AS1G07_042T01_9000001360cztM0_level2_quad_clean.evt |
| Size (bytes) | 604,834,560 | 608,760,000 |
| Size | 576.8 MB | 580.6 MB |
| Events in quadrant A | 3,702,363 | 3,731,851 |
| Events in quadrant B | 3,568,050 | 3,711,205 |
| Events in quadrant C | 3,632,297 | 3,523,414 |
| Events in quadrant D | 3,137,950 | 3,194,971 |
| Mode M9 | |||
|---|---|---|---|
| Quadrant | BADHDUFLAG | Total packets | Discarded packets |
| A | 0 | 97 | 0 |
| B | 0 | 97 | 0 |
| C | 0 | 97 | 0 |
| D | 0 | 97 | 0 |
| Mode M0 | |||
|---|---|---|---|
| Quadrant | BADHDUFLAG | Total packets | Discarded packets |
| A | 0 | 147681 | 0 |
| B | 0 | 131405 | 0 |
| C | 0 | 128503 | 0 |
| D | 0 | 151310 | 0 |
| Mode SS | |||
|---|---|---|---|
| Quadrant | BADHDUFLAG | Total packets | Discarded packets |
| A | 0 | 1280 | 0 |
| B | 0 | 1276 | 0 |
| C | 0 | 1278 | 0 |
| D | 0 | 1284 | 0 |
| Quadrant | Total seconds | Saturated seconds | Saturation percentage |
|---|---|---|---|
| A | 62268 | 1315 | 2.111839% |
| B | 62325 | 883 | 1.416767% |
| C | 62307 | 529 | 0.849022% |
| D | 62298 | 2315 | 3.716010% |
Noise dominated data is calculated using 1-second bins in cleaned event files. If a bin has >2000 counts, and if more than 50% of those come from <1% of pixels, then it is considered to be noise-dominated and hence unusable.
| Quadrant | # 1 sec bins | Bins with >0 counts | Bins with >2000 counts | High rate bins dominated by noise | Noise dominated (total time) | Noise dominated (detector-on time) | Marked lightcurve |
|---|---|---|---|---|---|---|---|
| A | 73709 | 63076 | 0 | 0 | 0.00% | 0.00% |  |
| B | 73709 | 63152 | 0 | 0 | 0.00% | 0.00% |  |
| C | 73709 | 63111 | 0 | 0 | 0.00% | 0.00% |  |
| D | 73709 | 63104 | 0 | 0 | 0.00% | 0.00% |  |
Top three noisy pixels from each quadrant. If the there are fewer than three noisy pixels in the level2.evt file, extra rows are filled as -1
| Pixel properties | Quadrant properties | ||||||
|---|---|---|---|---|---|---|---|
| Quadrant | DetID | PixID | Counts | Sigma | Mean | Median | Sigma |
| A | 14 | 188 | 3636 | 11.19 | 961 | 898 | 244.6 |
| A | 0 | 29 | 3582 | 10.97 | 961 | 898 | 244.6 |
| A | 14 | 204 | 3221 | 9.5 | 961 | 898 | 244.6 |
| B | 2 | 9 | 2934 | 10.89 | 940 | 895 | 187.2 |
| B | 12 | 226 | 2433 | 8.21 | 940 | 895 | 187.2 |
| B | 14 | 254 | 2374 | 7.9 | 940 | 895 | 187.2 |
| C | 1 | 81 | 2778 | 7.5 | 958 | 890 | 251.7 |
| C | 1 | 80 | 2760 | 7.43 | 958 | 890 | 251.7 |
| C | 7 | 111 | 2436 | 6.14 | 958 | 890 | 251.7 |
| D | 3 | 14 | 2329 | 6.32 | 894 | 813 | 240.0 |
| D | 6 | 231 | 2241 | 5.95 | 894 | 813 | 240.0 |
| D | 3 | 31 | 2212 | 5.83 | 894 | 813 | 240.0 |
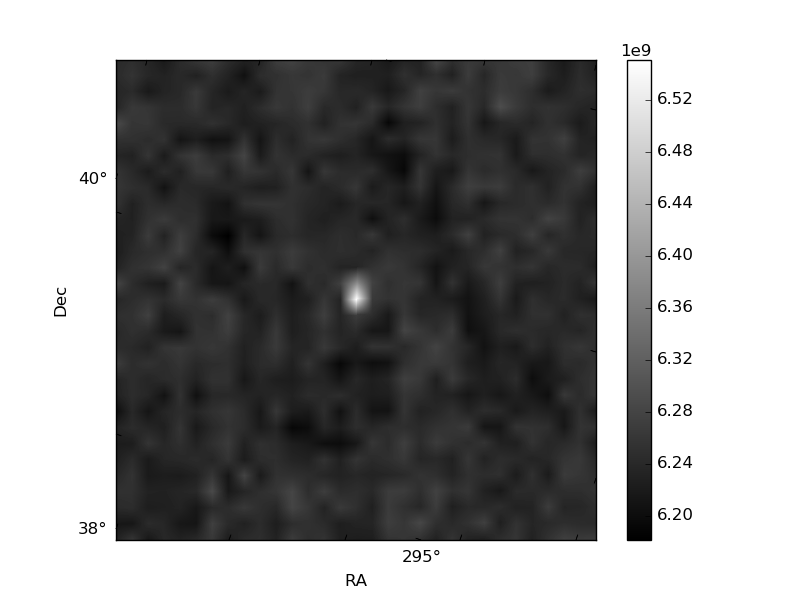
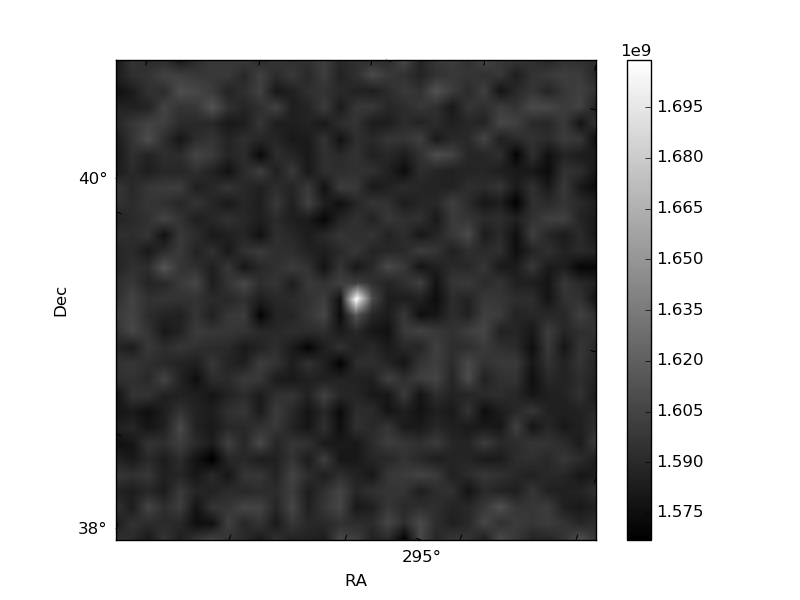
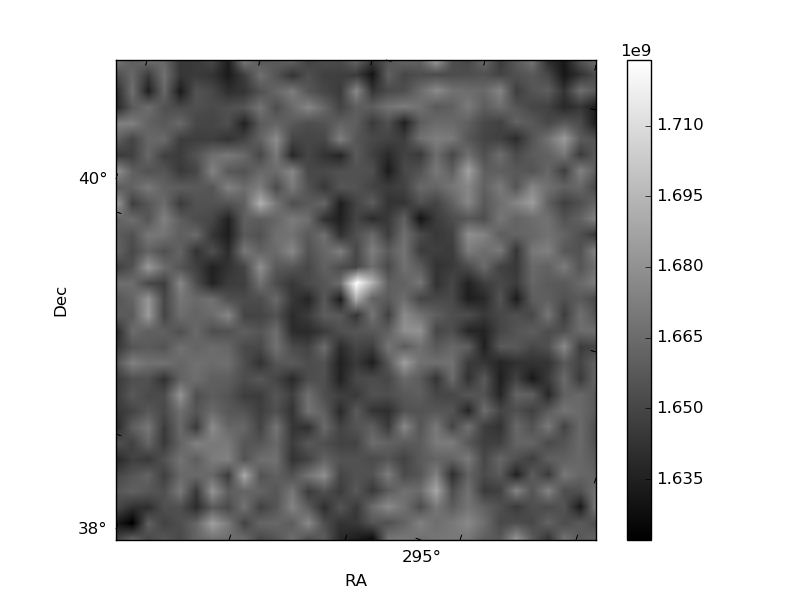
Histogram calculated using DETX and DETY for each event in the final _common_clean file
| Quadrant A |  |
 |
Quadrant B |
|---|---|---|---|
| Quadrant D |  |
 |
Quadrant C |
| Plot type | Count rate plots | Images |
|---|---|---|
| Comparison with Poisson distribution Blue bars denote a histogram of data divided into 1 sec bins. Red curve is a Poisson curve with rate = median count rate of data. |
 |
 |
| Quadrant-wise count rates Data is divided into 100 sec bins |
 |
|
| Module-wise count rates for Quadrant A Data is divided into 100 sec bins |
 |
 |
| Module-wise count rates for Quadrant B Data is divided into 100 sec bins |
 |
 |
| Module-wise count rates for Quadrant C Data is divided into 100 sec bins |
 |
 |
| Module-wise count rates for Quadrant D Data is divided into 100 sec bins |
 |
 |
| Parameter | Plot |
|---|---|
| CZT HV Monitor |  |
| D_VDD | 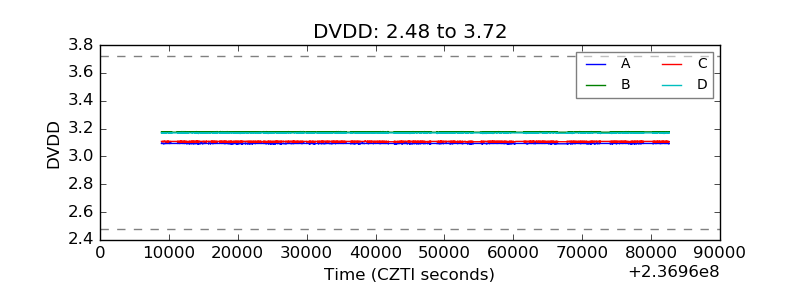 |
| Temperature 1 |  |
| Veto HV Monitor |  |
| Veto LLD |  |
| Alpha Counter |  |
| _CPM_Rate |  |
| CZT Counter |  |
| +2.5 Volts monitor |  |
| +5 Volts monitor |  |
| _ROLL_ROT |  |
| _Roll_DEC |  |
| _Roll_RA |  |
| Veto Counter |  |