| Param | Original file | Final file |
|---|---|---|
| Filename | modeM0/AS1G07_042T01_9000001360_09571cztM0_level2.evt | modeM0/AS1G07_042T01_9000001360_09571cztM0_level2_quad_clean.evt |
| Size (bytes) | 525,905,280 | 110,079,360 |
| Size | 501.5 MB | 105.0 MB |
| Events in quadrant A | 4,365,152 | 713,608 |
| Events in quadrant B | 3,672,941 | 718,569 |
| Events in quadrant C | 3,534,179 | 704,964 |
| Events in quadrant D | 3,853,862 | 683,279 |
| Mode M9 | |||
|---|---|---|---|
| Quadrant | BADHDUFLAG | Total packets | Discarded packets |
| A | 0 | 11 | 0 |
| B | 0 | 11 | 0 |
| C | 0 | 11 | 0 |
| D | 0 | 11 | 0 |
| Mode M0 | |||
|---|---|---|---|
| Quadrant | BADHDUFLAG | Total packets | Discarded packets |
| A | 0 | 17903 | 16 |
| B | 0 | 15689 | 38 |
| C | 0 | 15419 | 2 |
| D | 0 | 16069 | 6 |
| Mode SS | |||
|---|---|---|---|
| Quadrant | BADHDUFLAG | Total packets | Discarded packets |
| A | 0 | 154 | 0 |
| B | 0 | 154 | 0 |
| C | 0 | 154 | 0 |
| D | 0 | 154 | 0 |
| Quadrant | Total seconds | Saturated seconds | Saturation percentage |
|---|---|---|---|
| A | 7376 | 236 | 3.199566% |
| B | 7371 | 142 | 1.926469% |
| C | 7381 | 109 | 1.476765% |
| D | 7379 | 119 | 1.612685% |
Noise dominated data is calculated using 1-second bins in cleaned event files. If a bin has >2000 counts, and if more than 50% of those come from <1% of pixels, then it is considered to be noise-dominated and hence unusable.
| Quadrant | # 1 sec bins | Bins with >0 counts | Bins with >2000 counts | High rate bins dominated by noise | Noise dominated (total time) | Noise dominated (detector-on time) | Marked lightcurve |
|---|---|---|---|---|---|---|---|
| A | 8431 | 7384 | 7 | 7 | 0.08% | 0.09% | 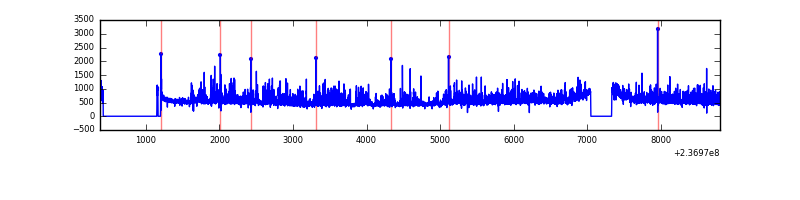 |
| B | 8431 | 7381 | 3 | 3 | 0.04% | 0.04% | 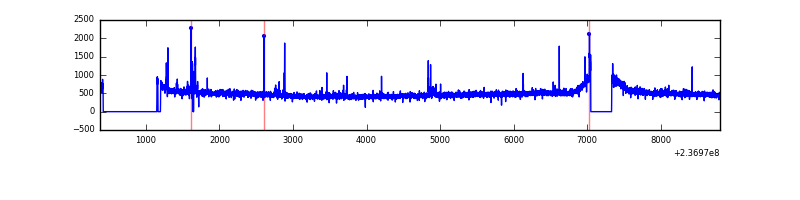 |
| C | 8431 | 7384 | 0 | 0 | 0.00% | 0.00% | 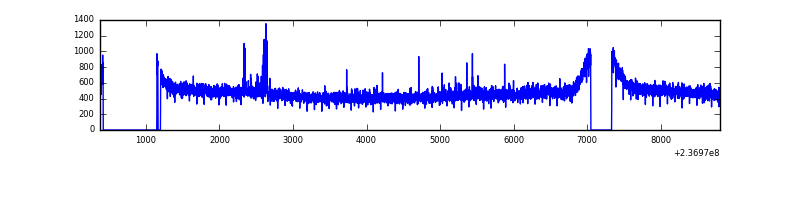 |
| D | 8431 | 7384 | 25 | 25 | 0.30% | 0.34% | 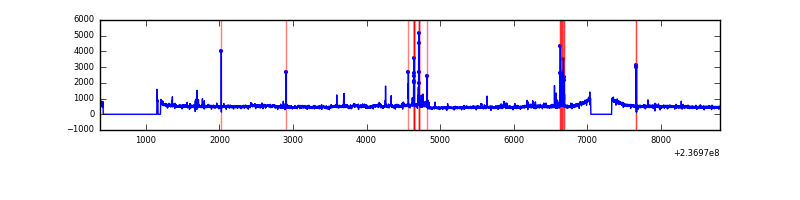 |
Top three noisy pixels from each quadrant. If the there are fewer than three noisy pixels in the level2.evt file, extra rows are filled as -1
| Pixel properties | Quadrant properties | ||||||
|---|---|---|---|---|---|---|---|
| Quadrant | DetID | PixID | Counts | Sigma | Mean | Median | Sigma |
| A | 1 | 162 | 317628 | 1707.01 | 917 | 901 | 185.5 |
| A | 1 | 178 | 170803 | 915.69 | 917 | 901 | 185.5 |
| A | 1 | 161 | 159123 | 852.74 | 917 | 901 | 185.5 |
| B | 0 | 214 | 29208 | 161.51 | 917 | 896 | 175.3 |
| B | 15 | 255 | 29032 | 160.51 | 917 | 896 | 175.3 |
| B | 4 | 80 | 23019 | 126.21 | 917 | 896 | 175.3 |
| C | 9 | 236 | 28236 | 131.17 | 898 | 903 | 208.4 |
| C | 13 | 61 | 6648 | 27.57 | 898 | 903 | 208.4 |
| C | 9 | 68 | 3653 | 13.2 | 898 | 903 | 208.4 |
| D | 13 | 137 | 224076 | 1023.81 | 892 | 872 | 218.0 |
| D | 7 | 71 | 88593 | 402.37 | 892 | 872 | 218.0 |
| D | 2 | 234 | 44574 | 200.46 | 892 | 872 | 218.0 |
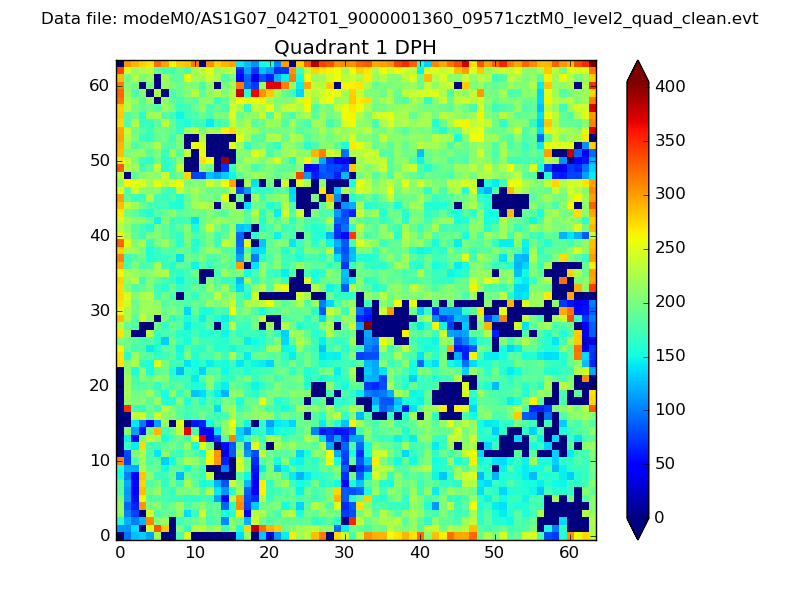
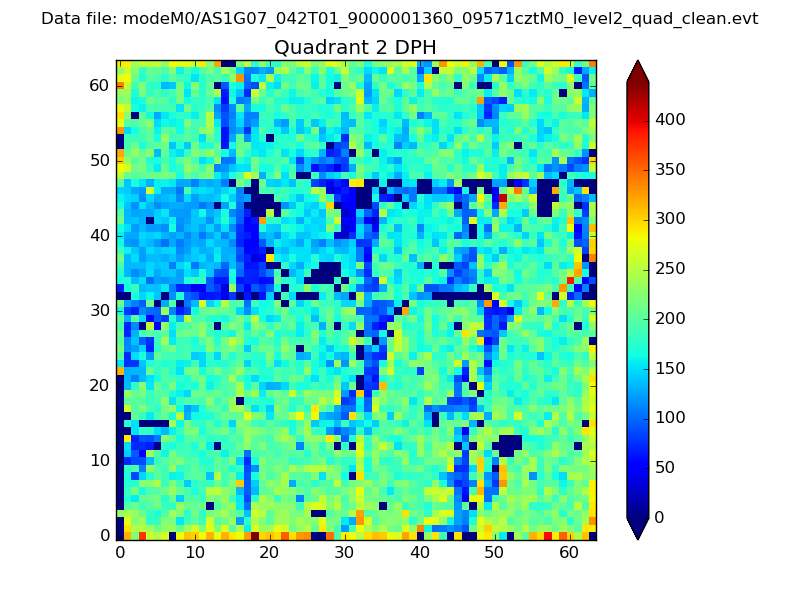
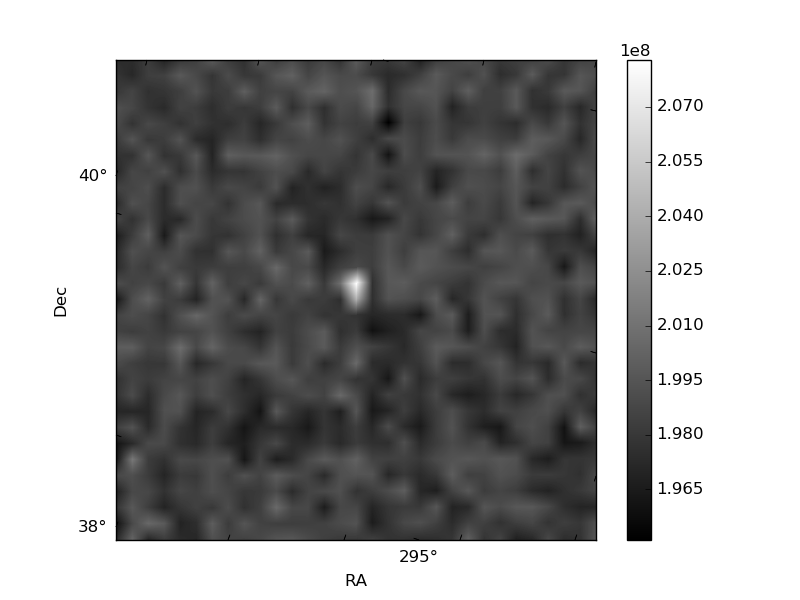
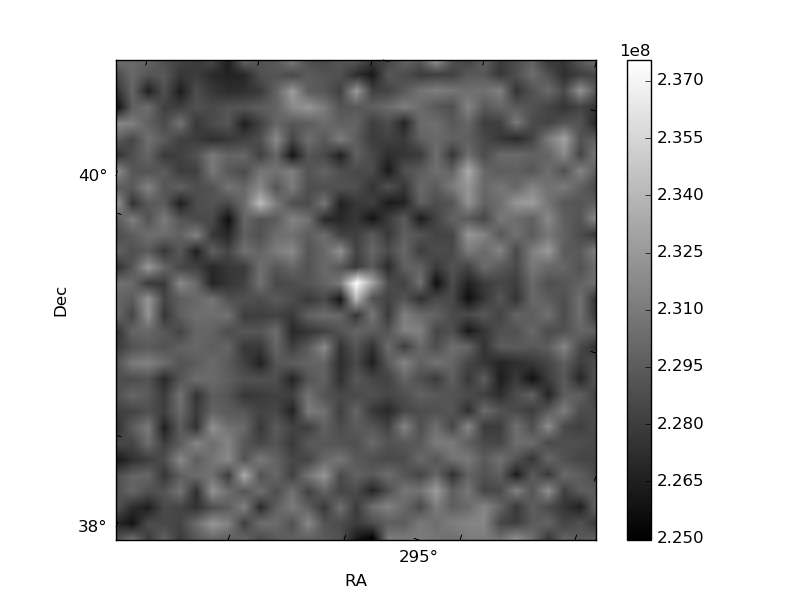
Histogram calculated using DETX and DETY for each event in the final _common_clean file
| Quadrant A |  |
 |
Quadrant B |
|---|---|---|---|
| Quadrant D |  |
 |
Quadrant C |
| Plot type | Count rate plots | Images |
|---|---|---|
| Comparison with Poisson distribution Blue bars denote a histogram of data divided into 1 sec bins. Red curve is a Poisson curve with rate = median count rate of data. |
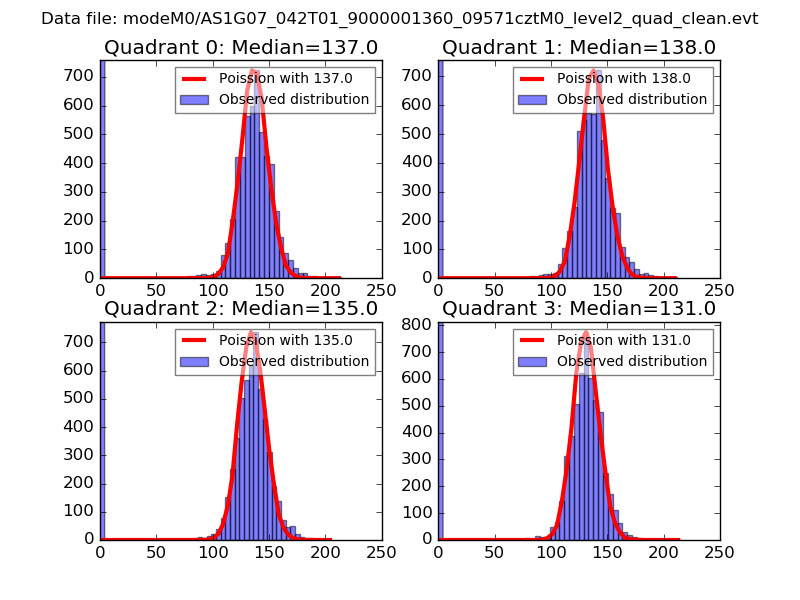 |
 |
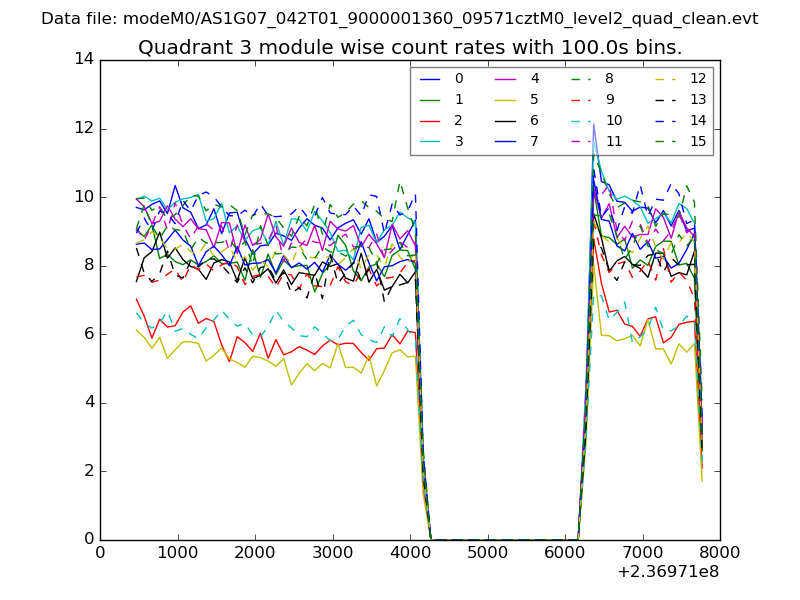
| Quadrant-wise count rates Data is divided into 100 sec bins |
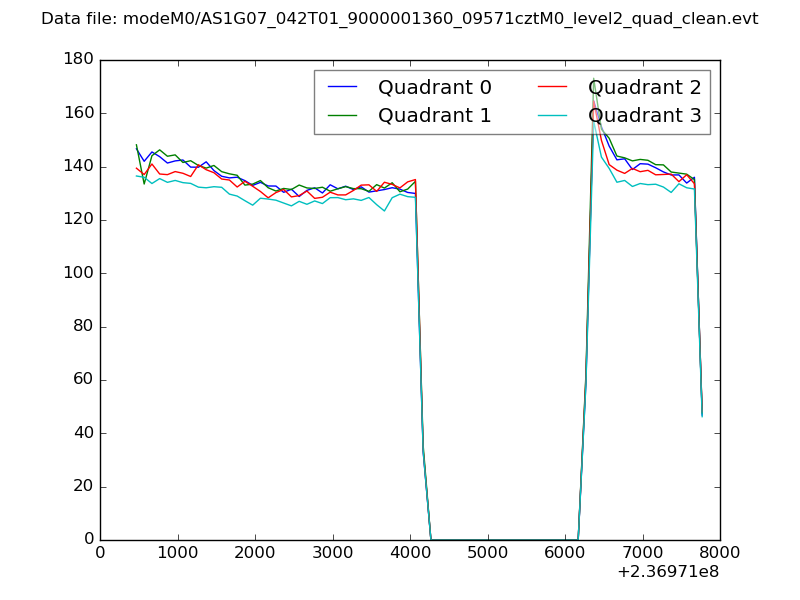 |
|
| Module-wise count rates for Quadrant A Data is divided into 100 sec bins |
 |
 |
| Module-wise count rates for Quadrant B Data is divided into 100 sec bins |
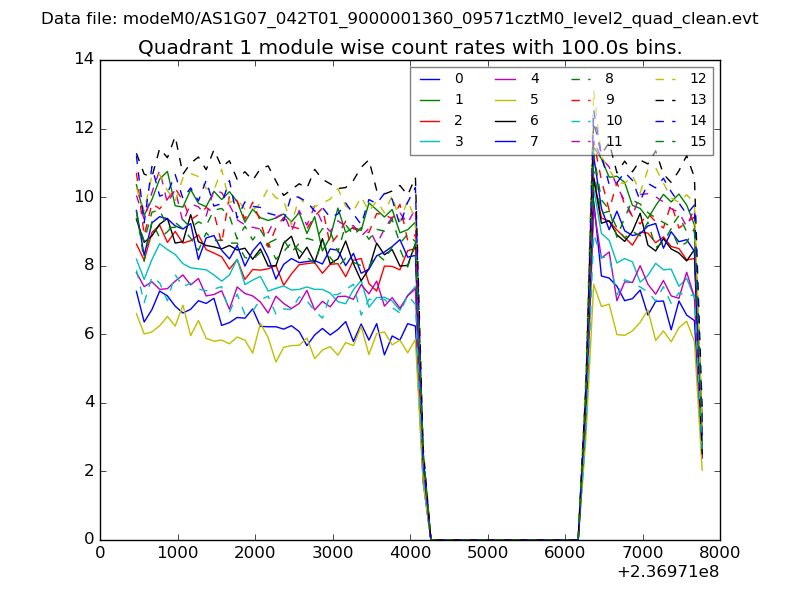 |
 |
| Module-wise count rates for Quadrant C Data is divided into 100 sec bins |
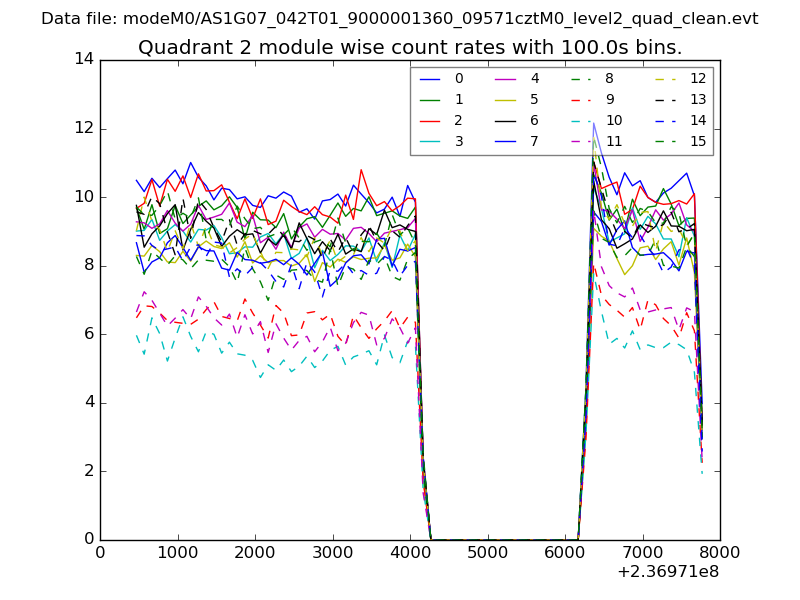 |
 |
| Module-wise count rates for Quadrant D Data is divided into 100 sec bins |
 |
 |
| Parameter | Plot |
|---|---|
| CZT HV Monitor |  |
| D_VDD | 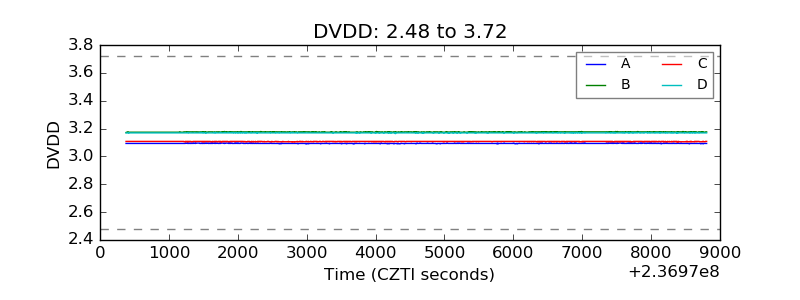 |
| Temperature 1 | 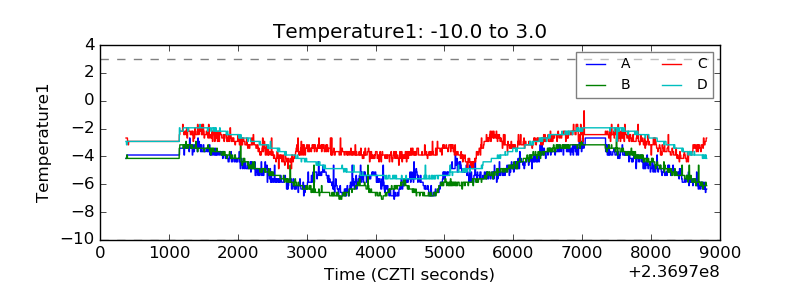 |
| Veto HV Monitor | 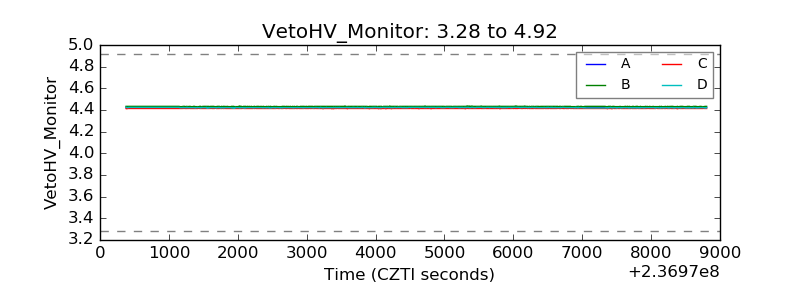 |
| Veto LLD | 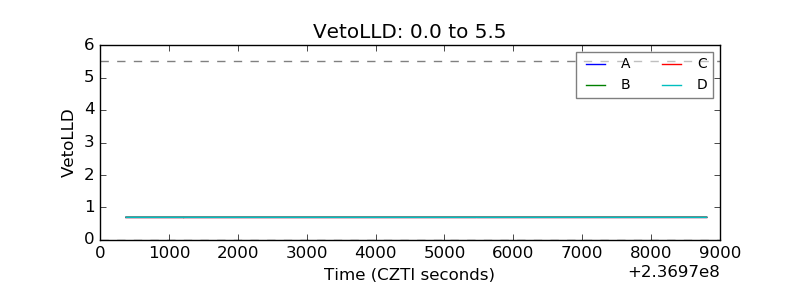 |
| Alpha Counter | 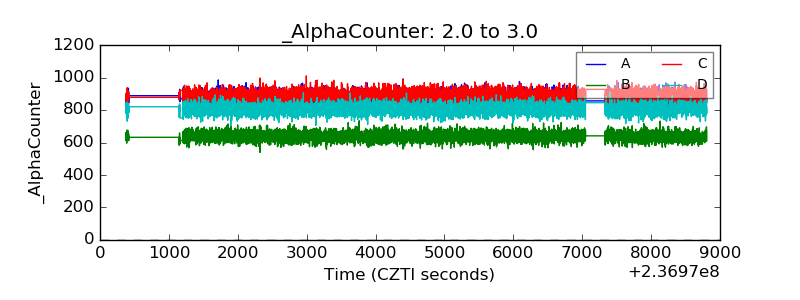 |
| _CPM_Rate | 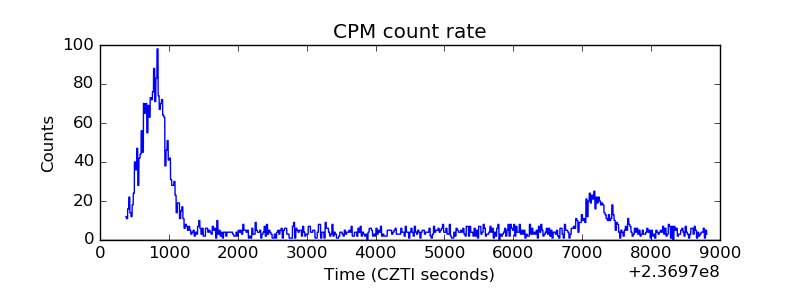 |
| CZT Counter | 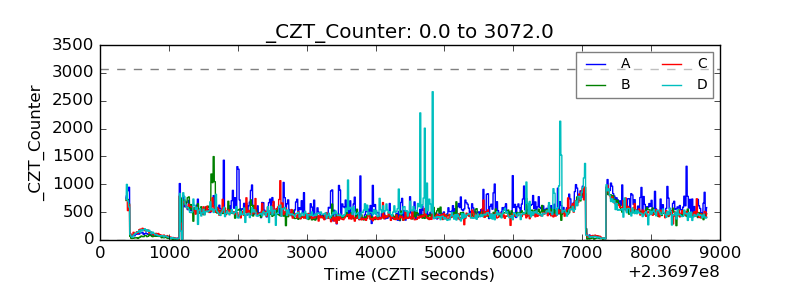 |
| +2.5 Volts monitor |  |
| +5 Volts monitor | 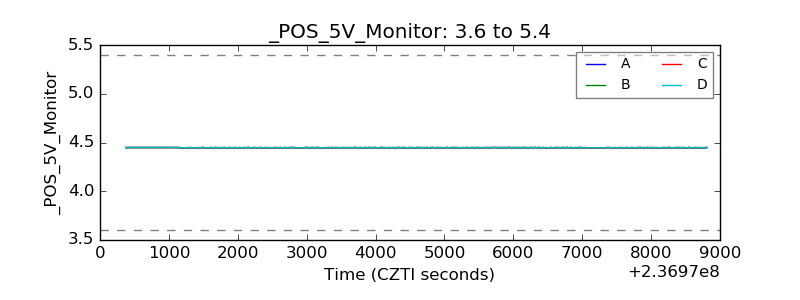 |
| _ROLL_ROT | 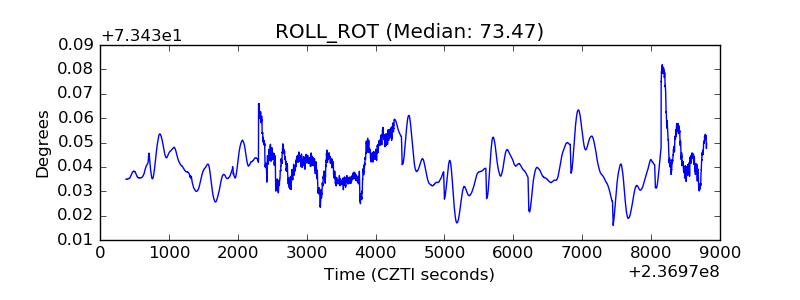 |
| _Roll_DEC | 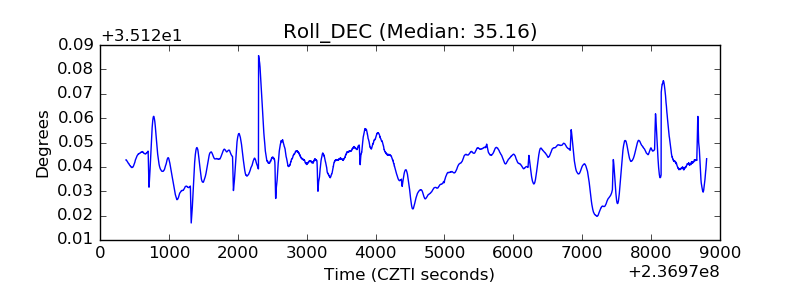 |
| _Roll_RA |  |
| Veto Counter | 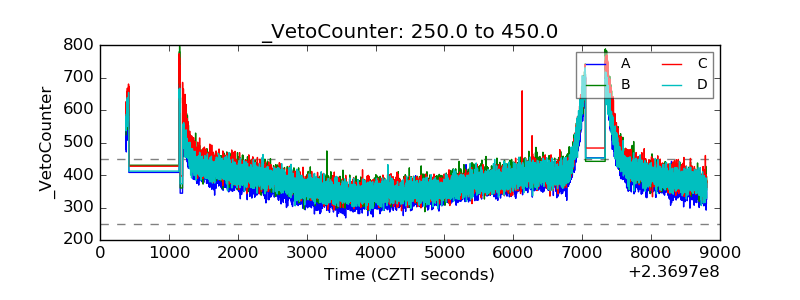 |