| Param | Original file | Final file |
|---|---|---|
| Filename | modeM0/AS1G07_042T01_9000001360_09572cztM0_level2.evt | modeM0/AS1G07_042T01_9000001360_09572cztM0_level2_quad_clean.evt |
| Size (bytes) | 512,222,400 | 109,071,360 |
| Size | 488.5 MB | 104.0 MB |
| Events in quadrant A | 4,265,259 | 703,198 |
| Events in quadrant B | 3,552,091 | 711,119 |
| Events in quadrant C | 3,419,747 | 703,138 |
| Events in quadrant D | 3,778,905 | 676,573 |
| Mode M9 | |||
|---|---|---|---|
| Quadrant | BADHDUFLAG | Total packets | Discarded packets |
| A | 0 | 2 | 0 |
| B | 0 | 2 | 0 |
| C | 0 | 2 | 0 |
| D | 0 | 2 | 0 |
| Mode M0 | |||
|---|---|---|---|
| Quadrant | BADHDUFLAG | Total packets | Discarded packets |
| A | 0 | 17856 | 228 |
| B | 0 | 15549 | 176 |
| C | 0 | 15220 | 135 |
| D | 0 | 16427 | 203 |
| Mode SS | |||
|---|---|---|---|
| Quadrant | BADHDUFLAG | Total packets | Discarded packets |
| A | 0 | 150 | 2 |
| B | 0 | 150 | 2 |
| C | 0 | 150 | 0 |
| D | 0 | 150 | 0 |
| Quadrant | Total seconds | Saturated seconds | Saturation percentage |
|---|---|---|---|
| A | 7301 | 148 | 2.027120% |
| B | 7311 | 94 | 1.285734% |
| C | 7323 | 43 | 0.587191% |
| D | 7307 | 114 | 1.560148% |
Noise dominated data is calculated using 1-second bins in cleaned event files. If a bin has >2000 counts, and if more than 50% of those come from <1% of pixels, then it is considered to be noise-dominated and hence unusable.
| Quadrant | # 1 sec bins | Bins with >0 counts | Bins with >2000 counts | High rate bins dominated by noise | Noise dominated (total time) | Noise dominated (detector-on time) | Marked lightcurve |
|---|---|---|---|---|---|---|---|
| A | 7596 | 7370 | 3 | 3 | 0.04% | 0.04% | 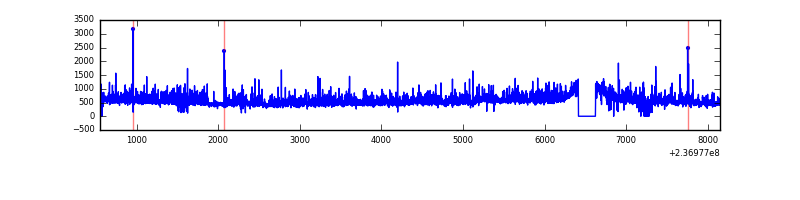 |
| B | 7596 | 7375 | 9 | 9 | 0.12% | 0.12% | 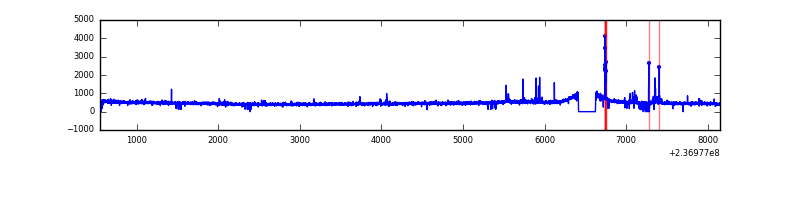 |
| C | 7595 | 7375 | 4 | 4 | 0.05% | 0.05% | 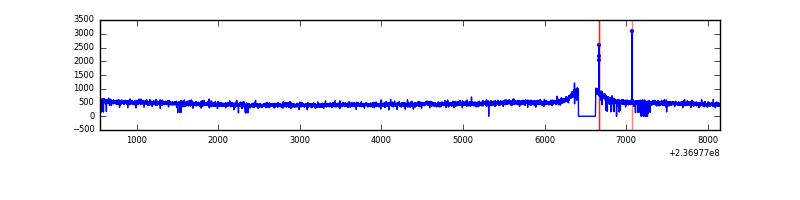 |
| D | 7596 | 7376 | 36 | 36 | 0.47% | 0.49% | 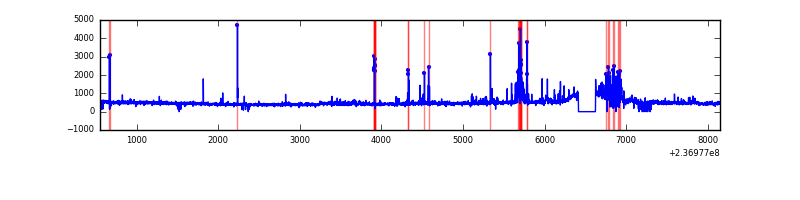 |
Top three noisy pixels from each quadrant. If the there are fewer than three noisy pixels in the level2.evt file, extra rows are filled as -1
| Pixel properties | Quadrant properties | ||||||
|---|---|---|---|---|---|---|---|
| Quadrant | DetID | PixID | Counts | Sigma | Mean | Median | Sigma |
| A | 1 | 162 | 321488 | 1790.86 | 885 | 868 | 179.0 |
| A | 1 | 178 | 168346 | 935.47 | 885 | 868 | 179.0 |
| A | 1 | 161 | 158957 | 883.03 | 885 | 868 | 179.0 |
| B | 10 | 252 | 34523 | 198.05 | 888 | 866 | 169.9 |
| B | 4 | 80 | 30908 | 176.78 | 888 | 866 | 169.9 |
| B | 15 | 85 | 21072 | 118.9 | 888 | 866 | 169.9 |
| C | 14 | 67 | 20033 | 94.91 | 869 | 876 | 201.8 |
| C | 7 | 221 | 11246 | 51.38 | 869 | 876 | 201.8 |
| C | 13 | 61 | 6354 | 27.14 | 869 | 876 | 201.8 |
| D | 1 | 52 | 178193 | 826.7 | 859 | 836 | 214.5 |
| D | 7 | 71 | 151703 | 703.22 | 859 | 836 | 214.5 |
| D | 12 | 233 | 74725 | 344.41 | 859 | 836 | 214.5 |
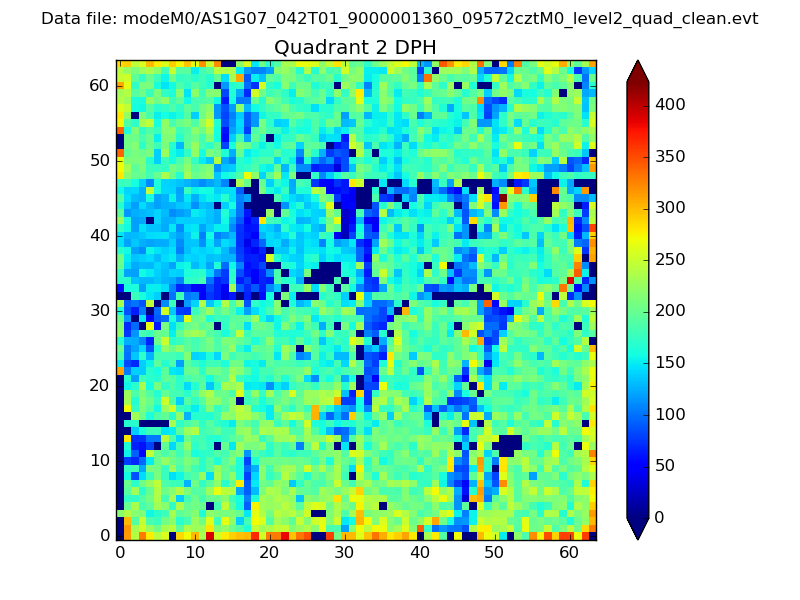
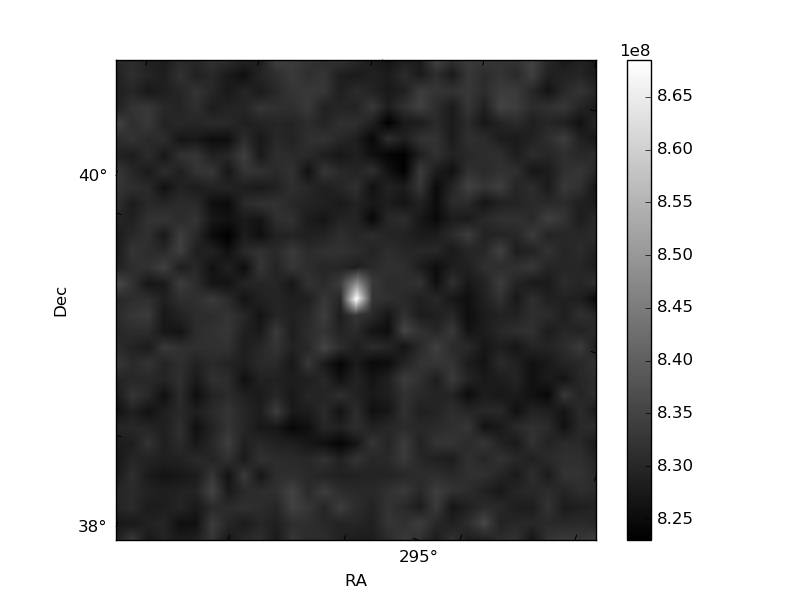
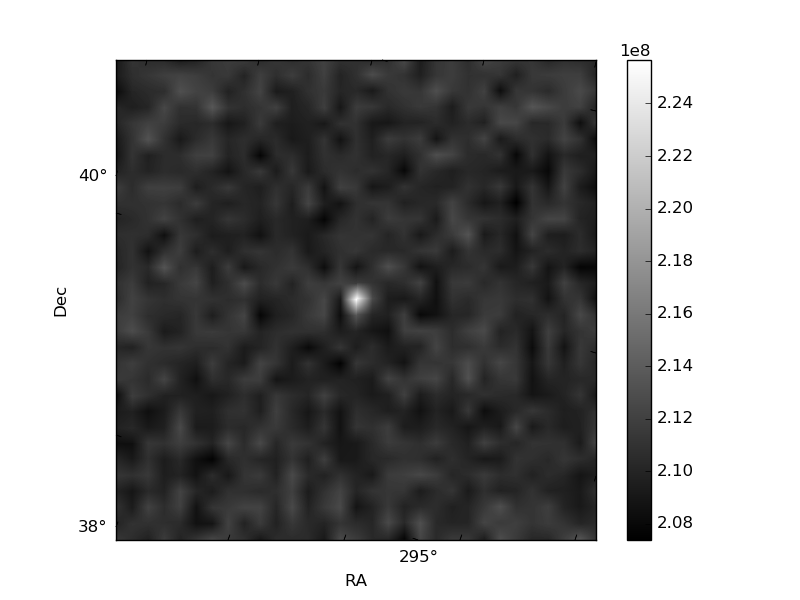
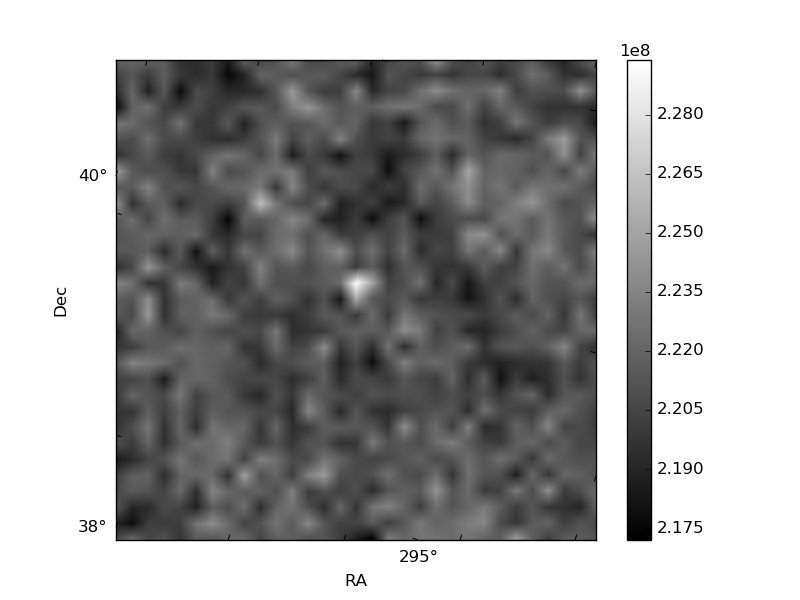
Histogram calculated using DETX and DETY for each event in the final _common_clean file
| Quadrant A | 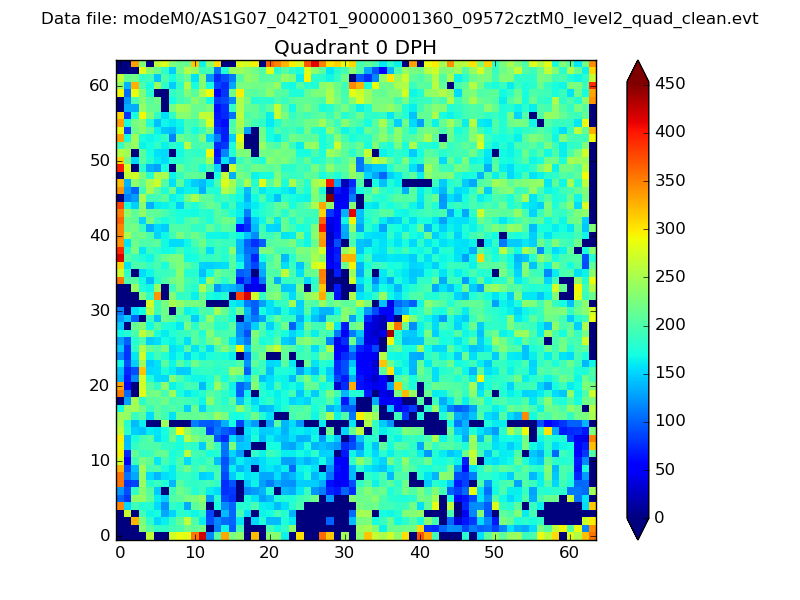 |
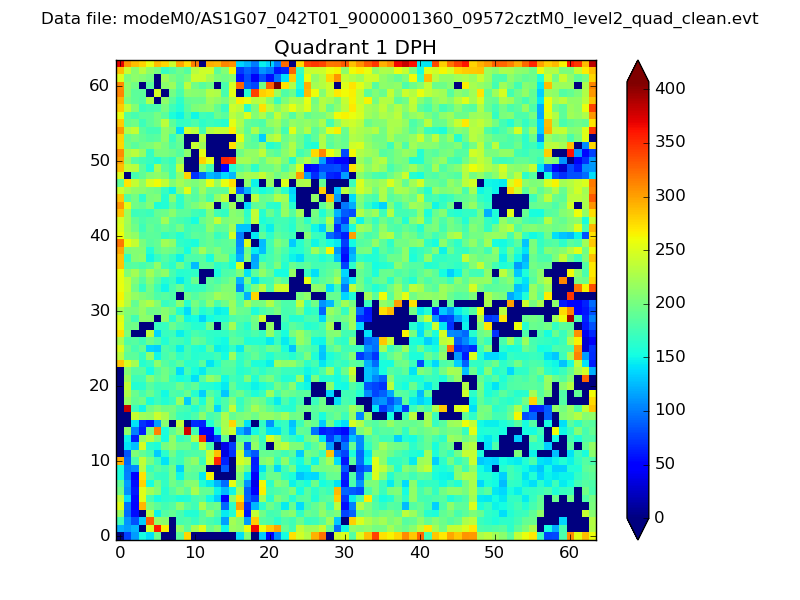 |
Quadrant B |
|---|---|---|---|
| Quadrant D | 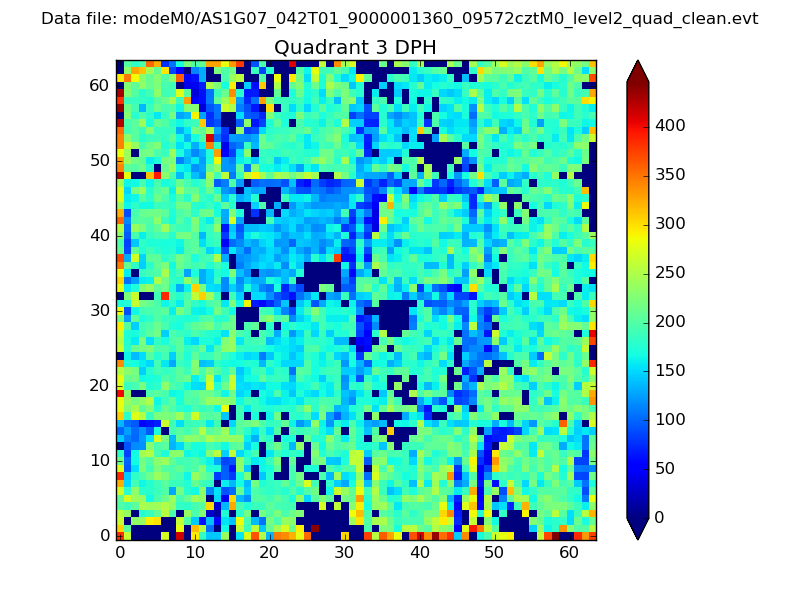 |
 |
Quadrant C |
| Plot type | Count rate plots | Images |
|---|---|---|
| Comparison with Poisson distribution Blue bars denote a histogram of data divided into 1 sec bins. Red curve is a Poisson curve with rate = median count rate of data. |
 |
 |
| Quadrant-wise count rates Data is divided into 100 sec bins |
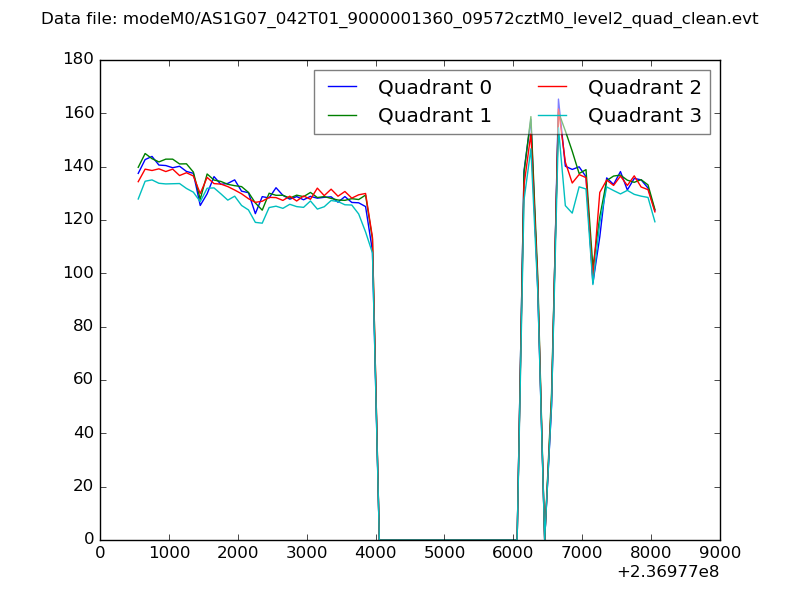 |
|
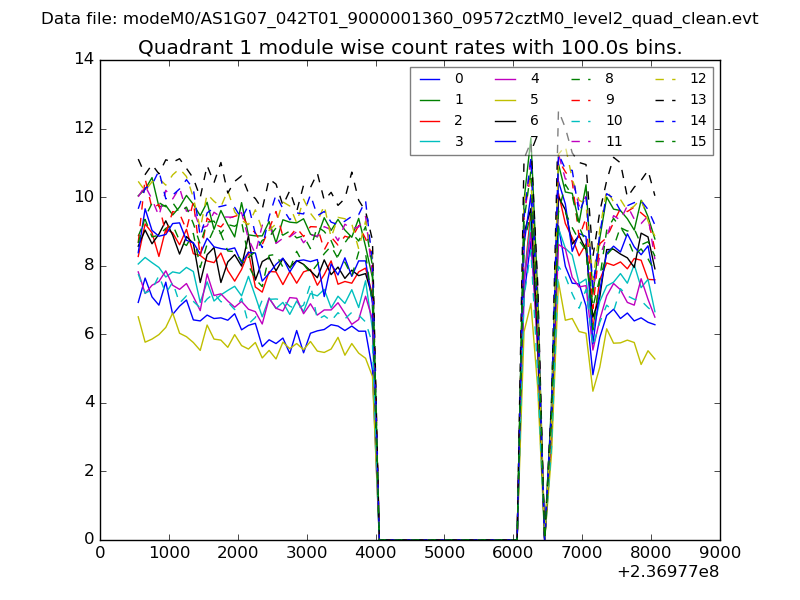
| Module-wise count rates for Quadrant A Data is divided into 100 sec bins |
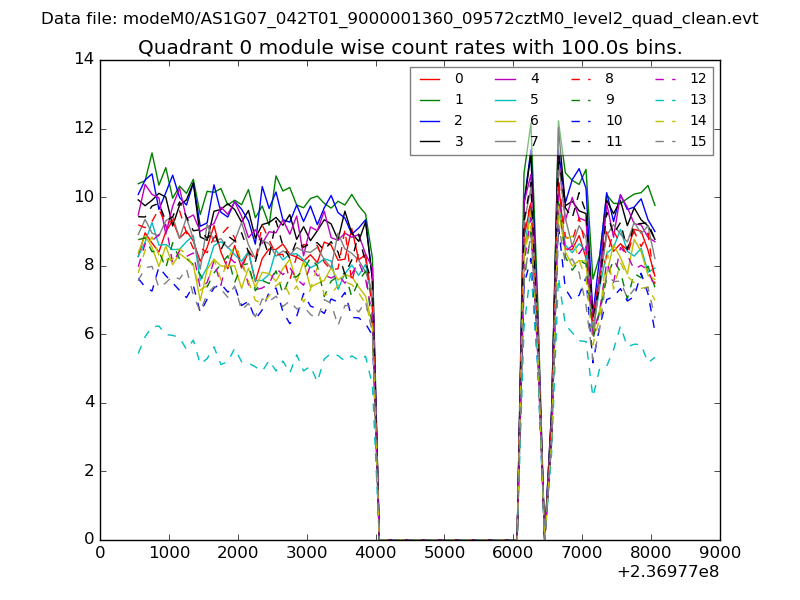 |
 |
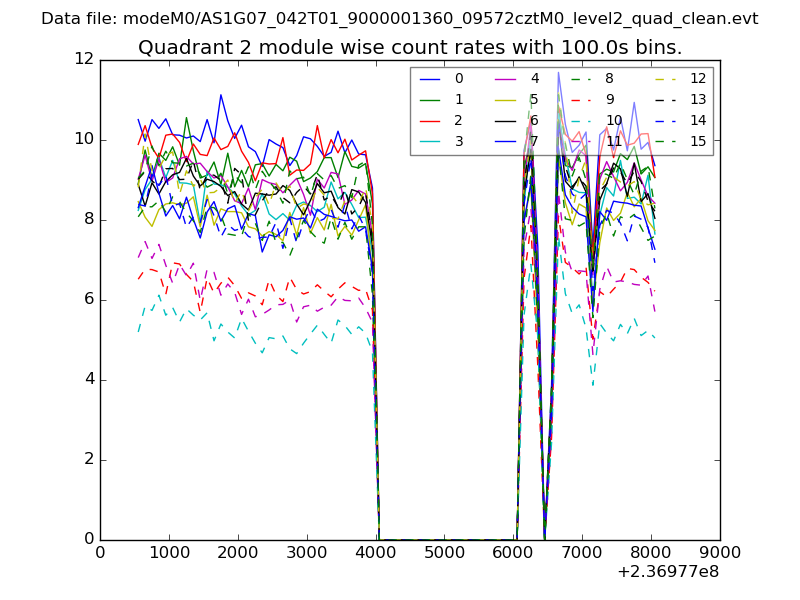
| Module-wise count rates for Quadrant B Data is divided into 100 sec bins |
 |
 |
| Module-wise count rates for Quadrant C Data is divided into 100 sec bins |
 |
 |
| Module-wise count rates for Quadrant D Data is divided into 100 sec bins |
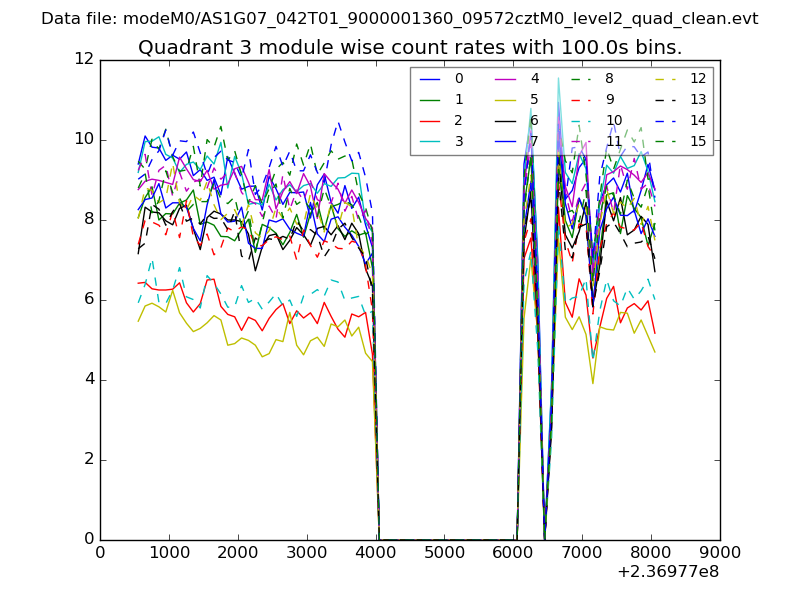 |
 |
| Parameter | Plot |
|---|---|
| CZT HV Monitor | 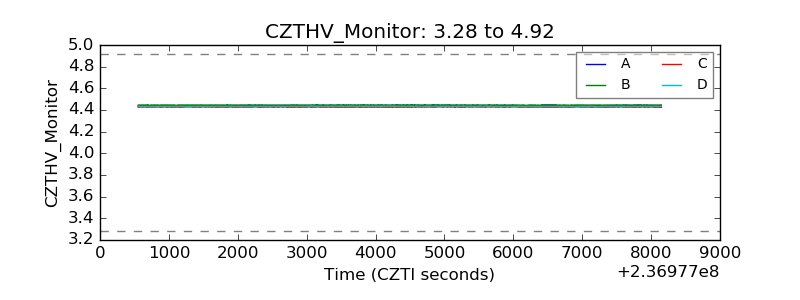 |
| D_VDD | 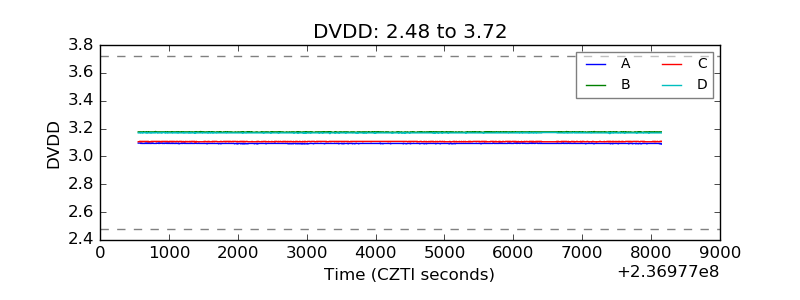 |
| Temperature 1 | 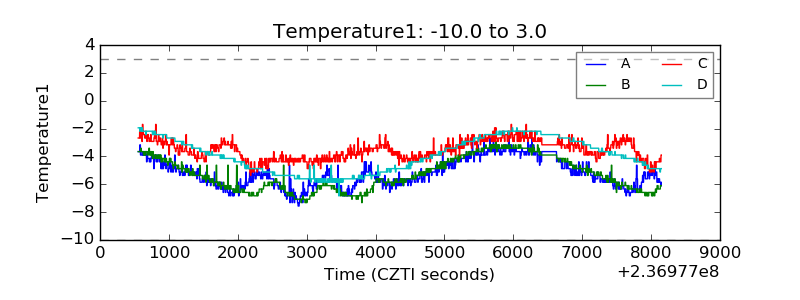 |
| Veto HV Monitor | 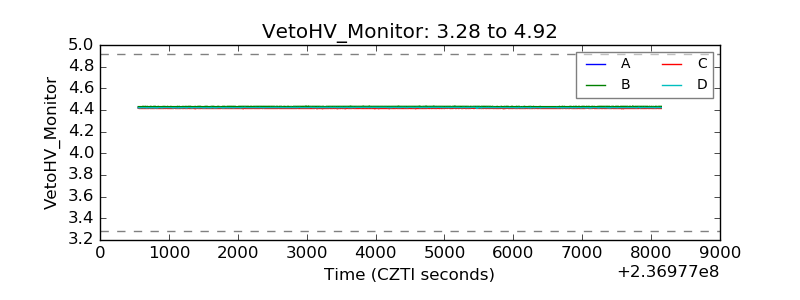 |
| Veto LLD | 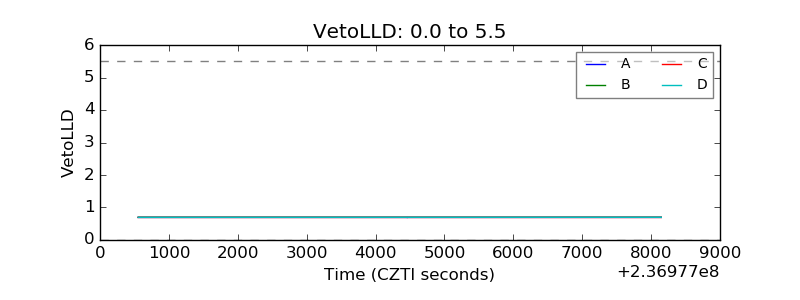 |
| Alpha Counter | 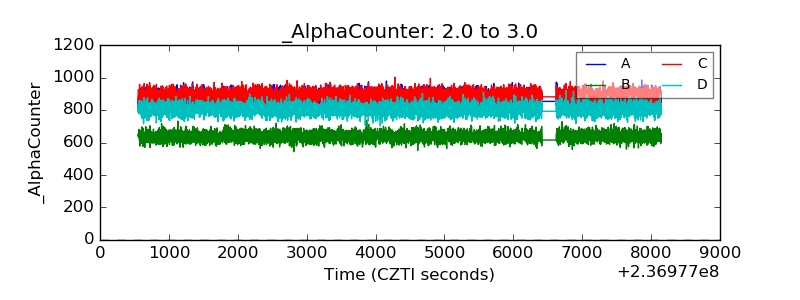 |
| _CPM_Rate | 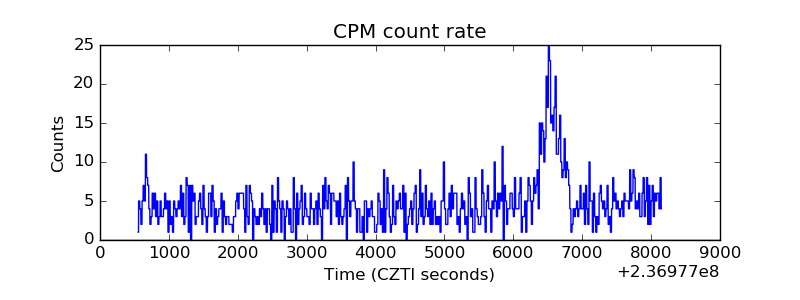 |
| CZT Counter | 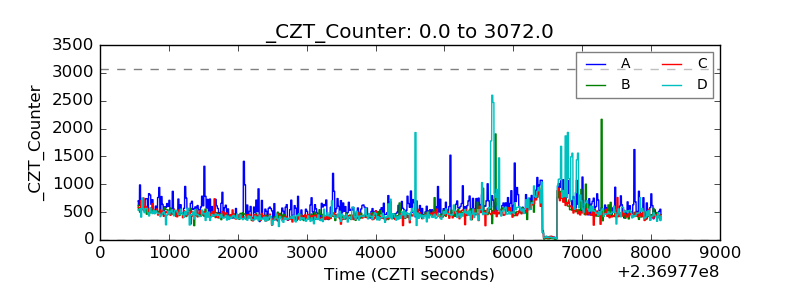 |
| +2.5 Volts monitor |  |
| +5 Volts monitor |  |
| _ROLL_ROT | 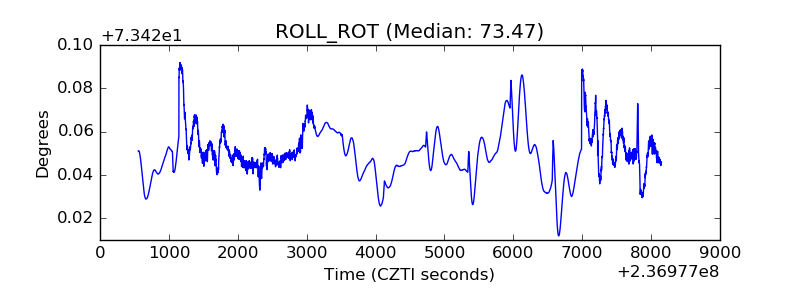 |
| _Roll_DEC | 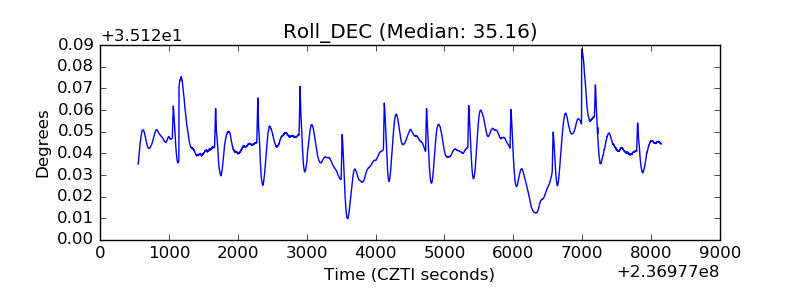 |
| _Roll_RA | 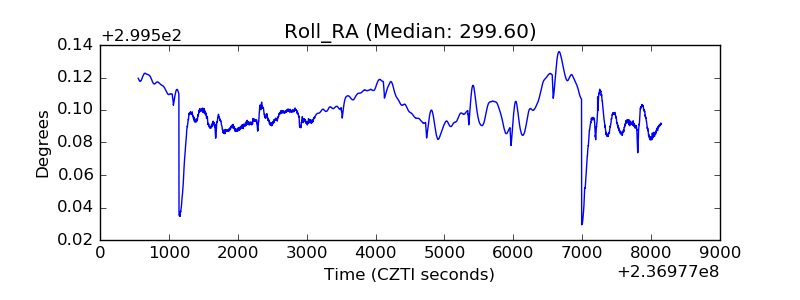 |
| Veto Counter | 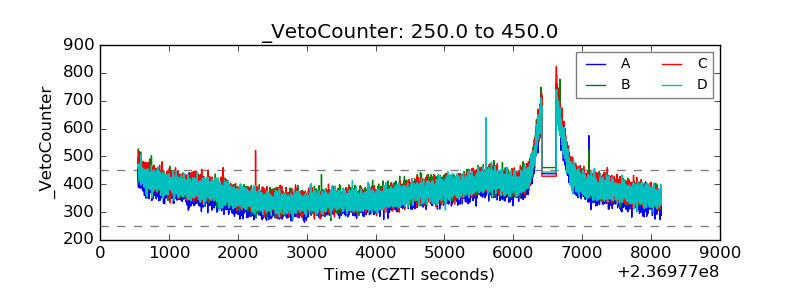 |