| Param | Original file | Final file |
|---|---|---|
| Filename | modeM0/AS1G07_042T01_9000001360_09573cztM0_level2.evt | modeM0/AS1G07_042T01_9000001360_09573cztM0_level2_quad_clean.evt |
| Size (bytes) | 443,010,240 | 95,472,000 |
| Size | 422.5 MB | 91.0 MB |
| Events in quadrant A | 3,638,612 | 612,340 |
| Events in quadrant B | 3,142,970 | 621,247 |
| Events in quadrant C | 3,005,929 | 613,238 |
| Events in quadrant D | 3,185,698 | 590,179 |
| Mode M9 | |||
|---|---|---|---|
| Quadrant | BADHDUFLAG | Total packets | Discarded packets |
| A | 0 | 5 | 1 |
| B | 0 | 5 | 2 |
| C | 0 | 5 | 2 |
| D | 0 | 5 | 2 |
| Mode M0 | |||
|---|---|---|---|
| Quadrant | BADHDUFLAG | Total packets | Discarded packets |
| A | 0 | 18381 | 3223 |
| B | 0 | 16538 | 2823 |
| C | 0 | 16131 | 2690 |
| D | 0 | 17165 | 3240 |
| Mode SS | |||
|---|---|---|---|
| Quadrant | BADHDUFLAG | Total packets | Discarded packets |
| A | 0 | 160 | 24 |
| B | 0 | 160 | 32 |
| C | 0 | 160 | 26 |
| D | 0 | 159 | 23 |
| Quadrant | Total seconds | Saturated seconds | Saturation percentage |
|---|---|---|---|
| A | 6494 | 97 | 1.493686% |
| B | 6522 | 80 | 1.226618% |
| C | 6503 | 36 | 0.553591% |
| D | 6476 | 54 | 0.833848% |
Noise dominated data is calculated using 1-second bins in cleaned event files. If a bin has >2000 counts, and if more than 50% of those come from <1% of pixels, then it is considered to be noise-dominated and hence unusable.
| Quadrant | # 1 sec bins | Bins with >0 counts | Bins with >2000 counts | High rate bins dominated by noise | Noise dominated (total time) | Noise dominated (detector-on time) | Marked lightcurve |
|---|---|---|---|---|---|---|---|
| A | 8343 | 7049 | 1 | 1 | 0.01% | 0.01% | 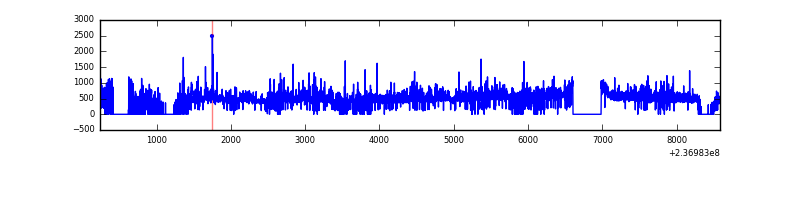 |
| B | 8343 | 7099 | 5 | 5 | 0.06% | 0.07% | 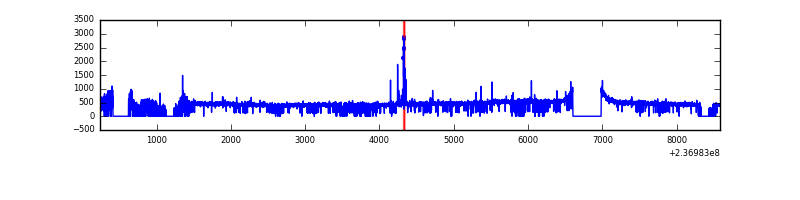 |
| C | 8343 | 7078 | 0 | 0 | 0.00% | 0.00% | 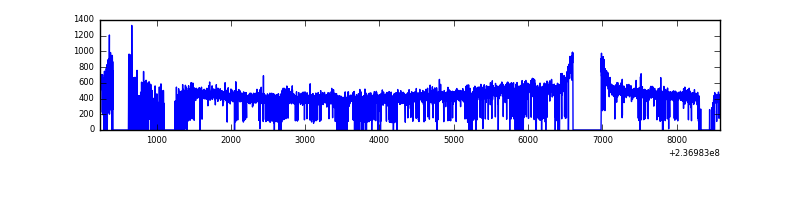 |
| D | 8343 | 7031 | 11 | 11 | 0.13% | 0.16% | 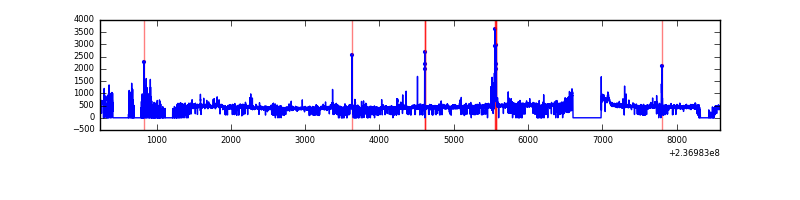 |
Top three noisy pixels from each quadrant. If the there are fewer than three noisy pixels in the level2.evt file, extra rows are filled as -1
| Pixel properties | Quadrant properties | ||||||
|---|---|---|---|---|---|---|---|
| Quadrant | DetID | PixID | Counts | Sigma | Mean | Median | Sigma |
| A | 1 | 162 | 248252 | 1557.77 | 779 | 763 | 158.9 |
| A | 1 | 178 | 127672 | 798.8 | 779 | 763 | 158.9 |
| A | 1 | 161 | 120666 | 754.71 | 779 | 763 | 158.9 |
| B | 4 | 80 | 50940 | 327.88 | 790 | 769 | 153.0 |
| B | 12 | 111 | 17257 | 107.75 | 790 | 769 | 153.0 |
| B | 11 | 111 | 14010 | 86.53 | 790 | 769 | 153.0 |
| C | 9 | 68 | 11460 | 59.82 | 767 | 775 | 178.6 |
| C | 13 | 61 | 5724 | 27.71 | 767 | 775 | 178.6 |
| C | 7 | 221 | 2788 | 11.27 | 767 | 775 | 178.6 |
| D | 1 | 52 | 164370 | 872.84 | 755 | 737 | 187.5 |
| D | 7 | 71 | 80567 | 425.82 | 755 | 737 | 187.5 |
| D | 2 | 234 | 32999 | 172.09 | 755 | 737 | 187.5 |
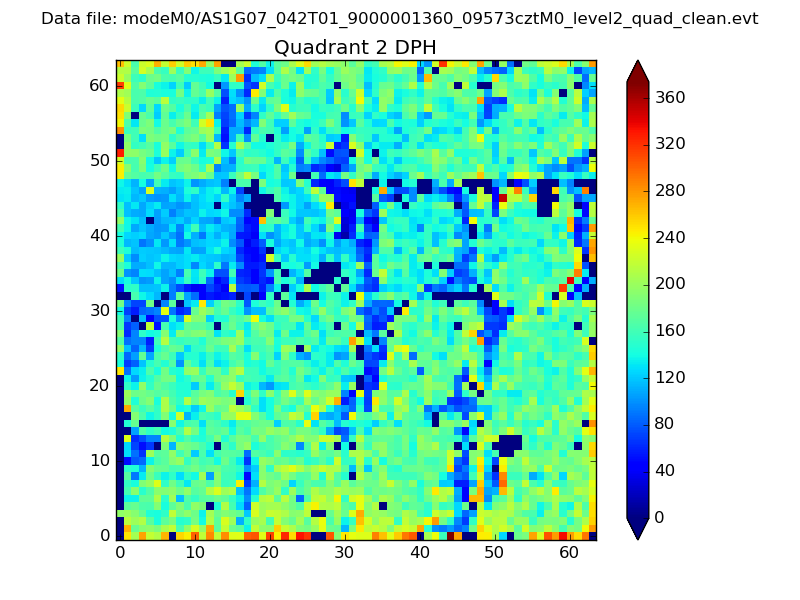
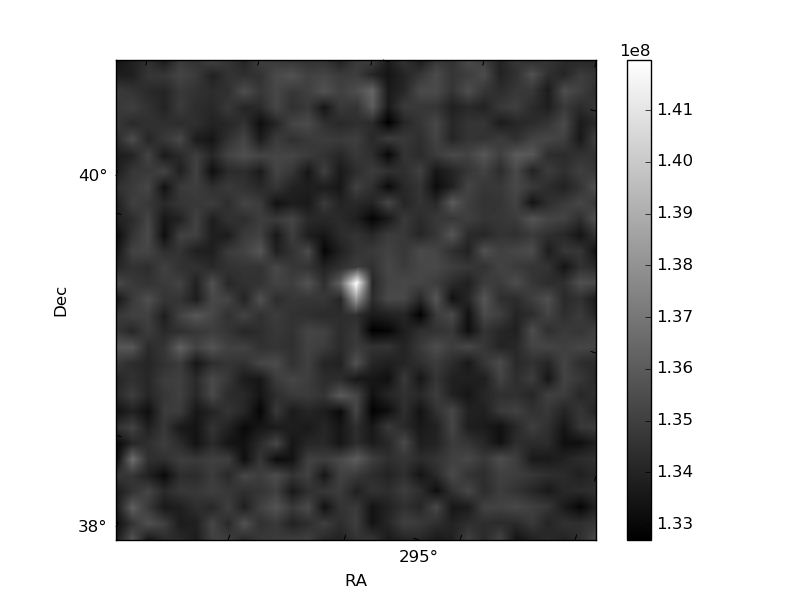
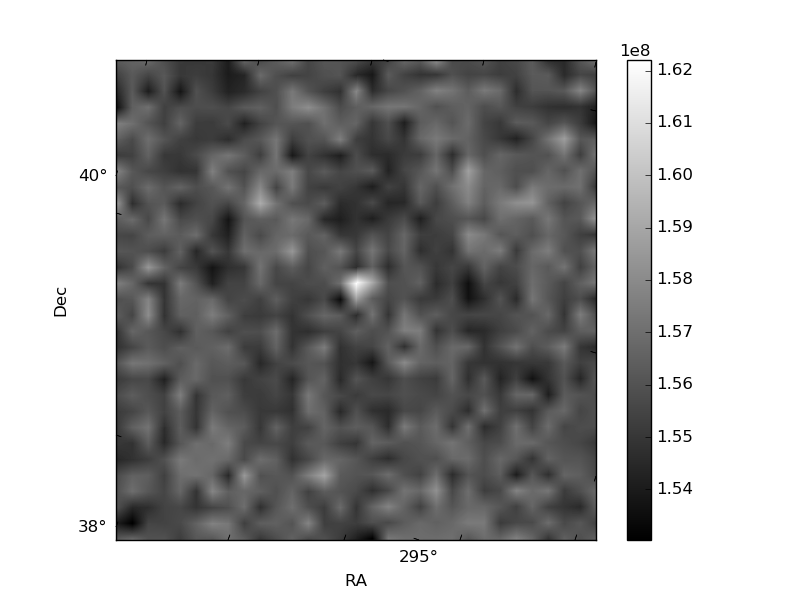
Histogram calculated using DETX and DETY for each event in the final _common_clean file
| Quadrant A | 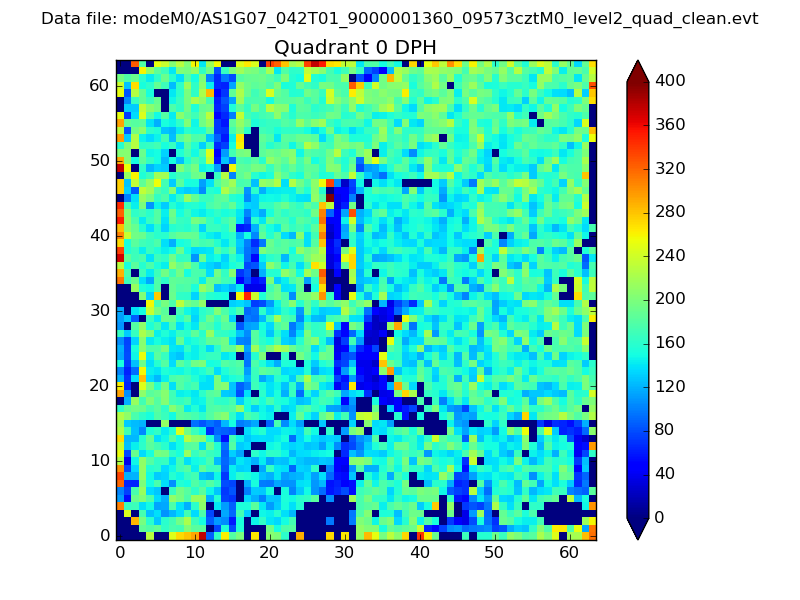 |
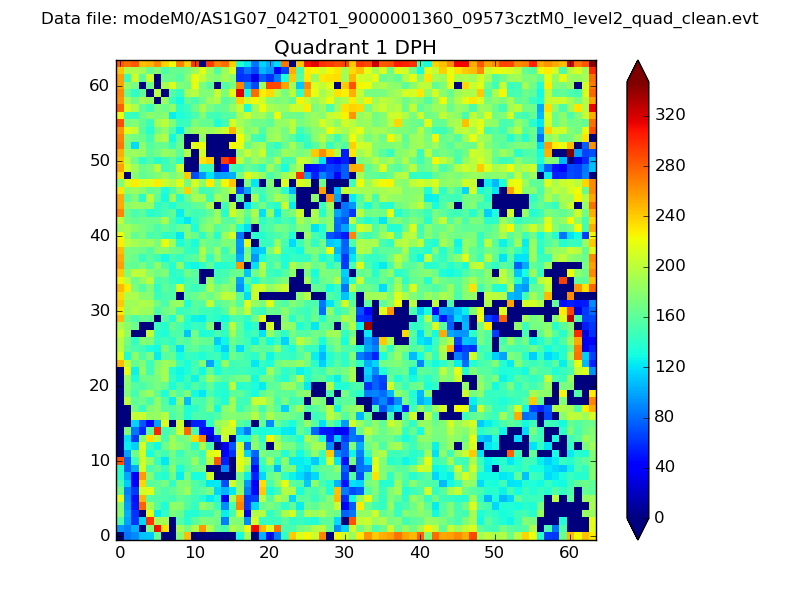 |
Quadrant B |
|---|---|---|---|
| Quadrant D | 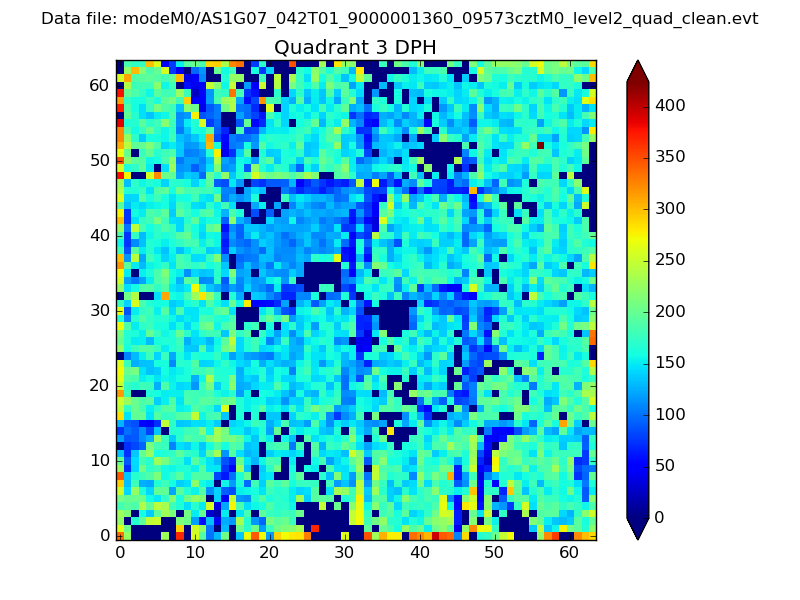 |
 |
Quadrant C |
| Plot type | Count rate plots | Images |
|---|---|---|
| Comparison with Poisson distribution Blue bars denote a histogram of data divided into 1 sec bins. Red curve is a Poisson curve with rate = median count rate of data. |
 |
 |
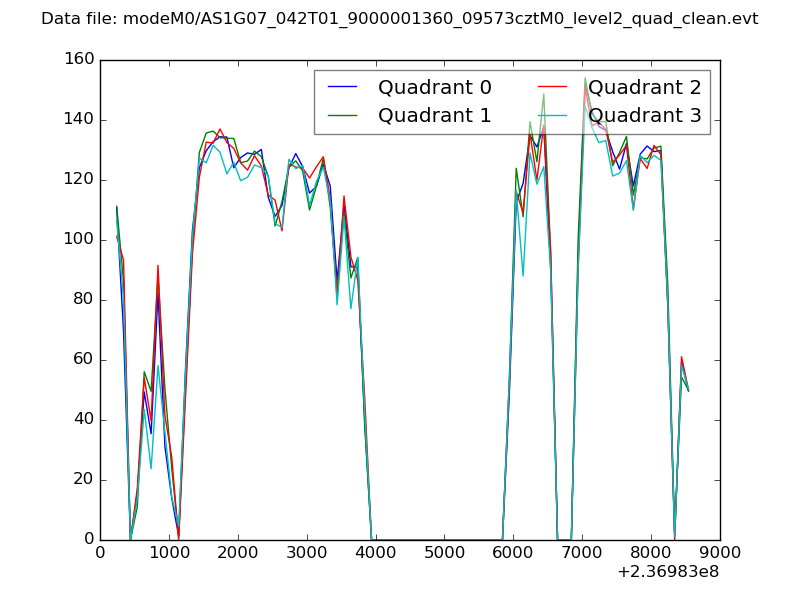
| Quadrant-wise count rates Data is divided into 100 sec bins |
 |
|
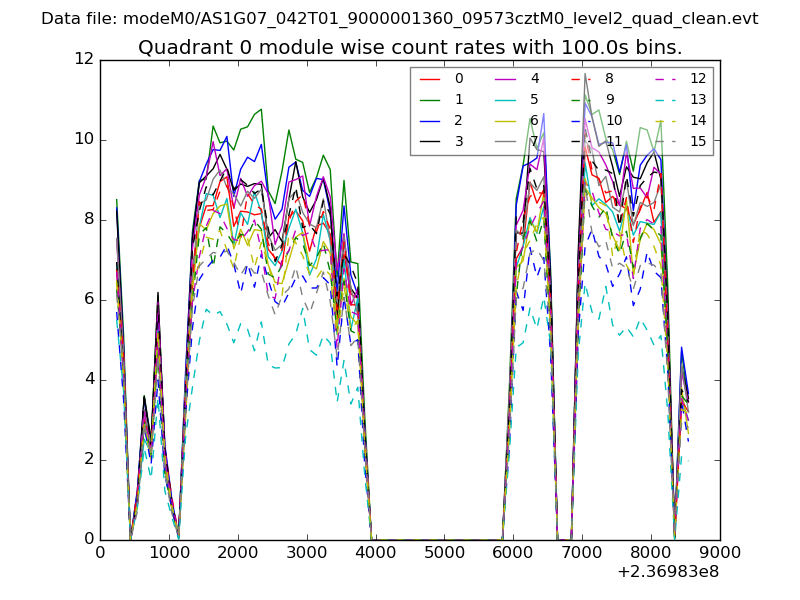
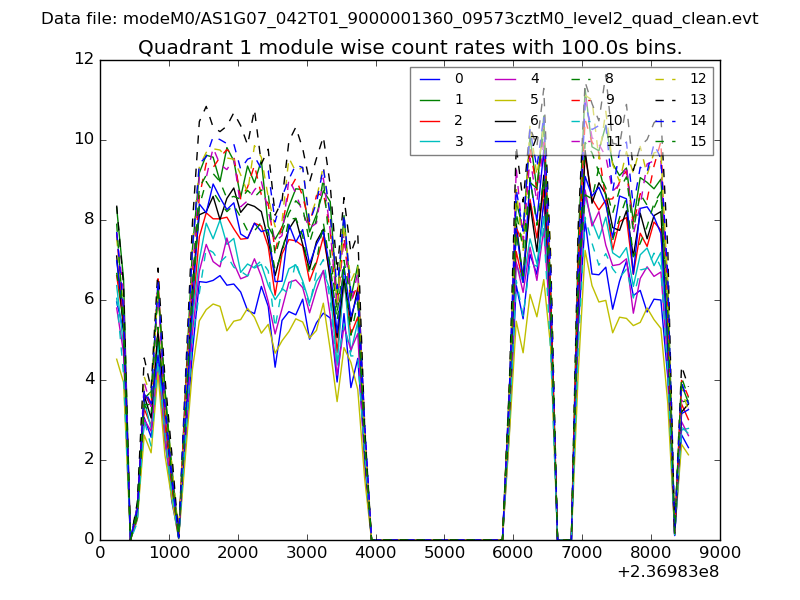
| Module-wise count rates for Quadrant A Data is divided into 100 sec bins |
 |
 |
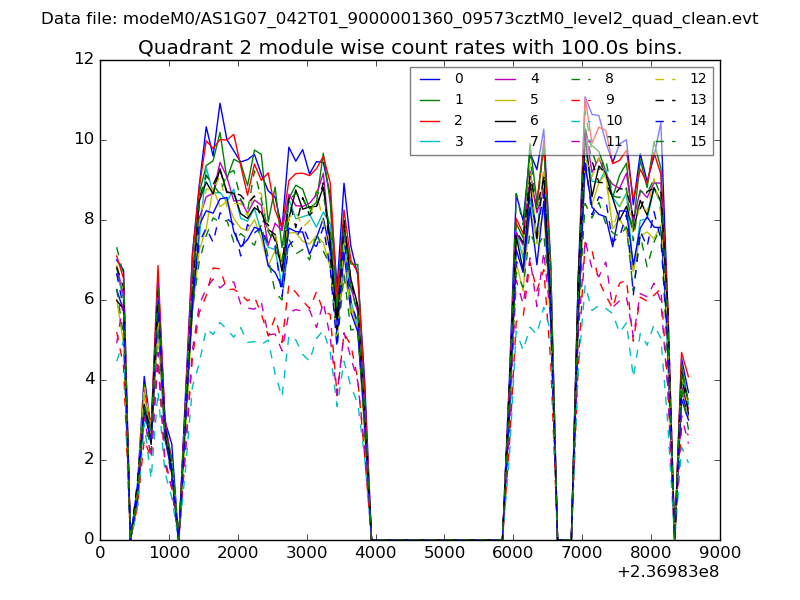
| Module-wise count rates for Quadrant B Data is divided into 100 sec bins |
 |
 |
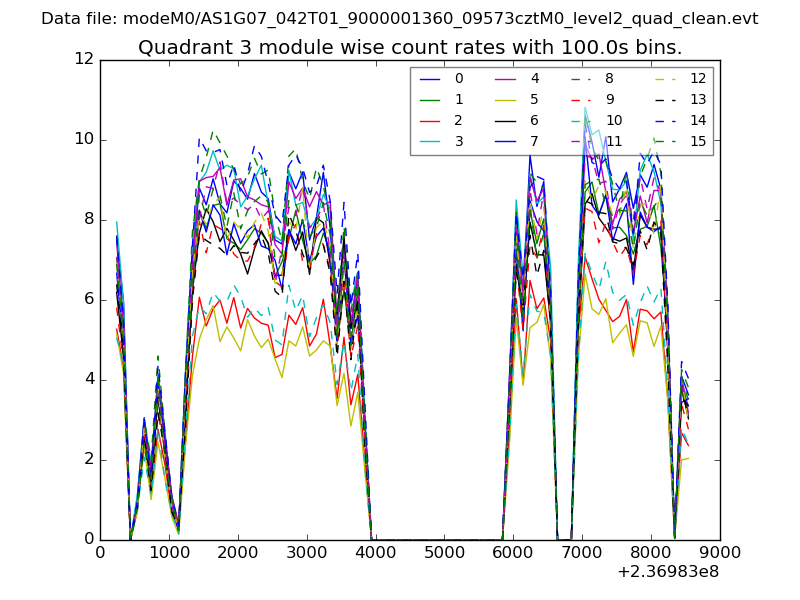
| Module-wise count rates for Quadrant C Data is divided into 100 sec bins |
 |
 |
| Module-wise count rates for Quadrant D Data is divided into 100 sec bins |
 |
 |
| Parameter | Plot |
|---|---|
| CZT HV Monitor | 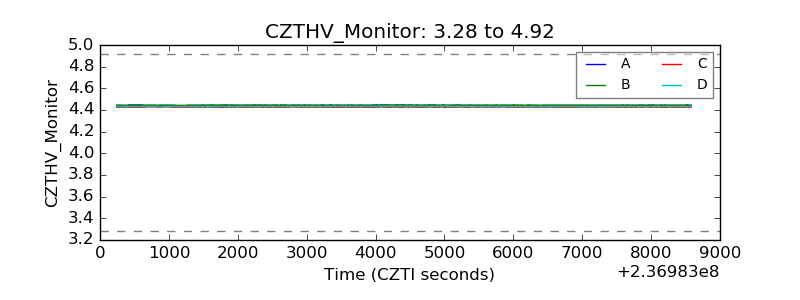 |
| D_VDD | 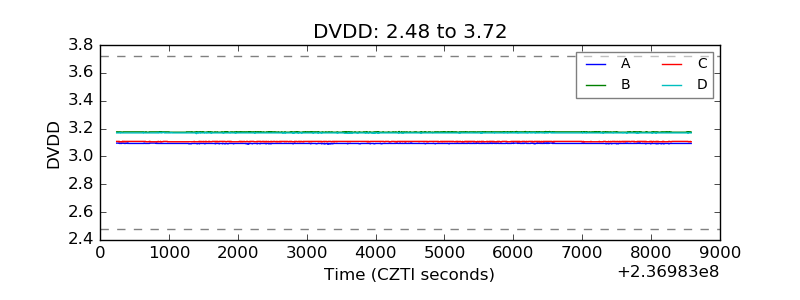 |
| Temperature 1 | 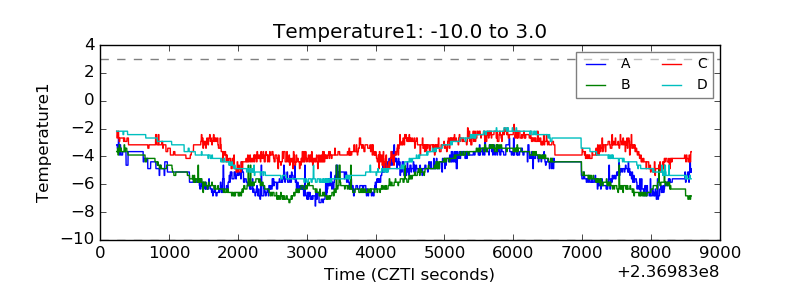 |
| Veto HV Monitor | 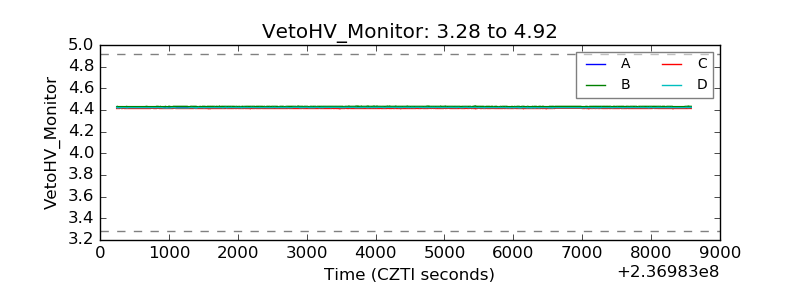 |
| Veto LLD | 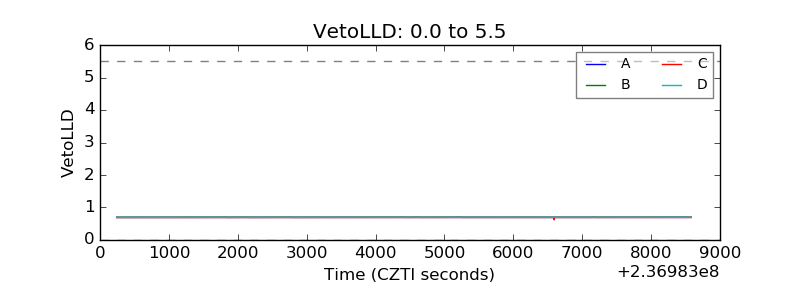 |
| Alpha Counter |  |
| _CPM_Rate | 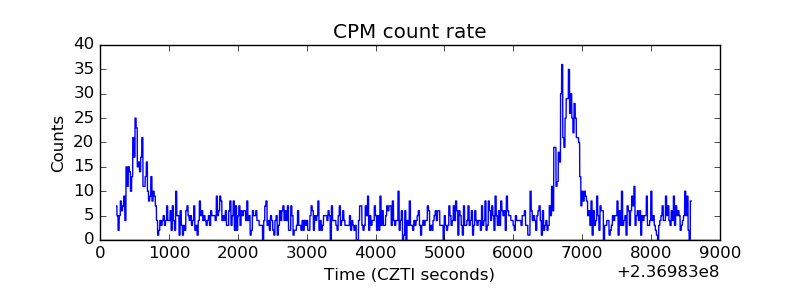 |
| CZT Counter | 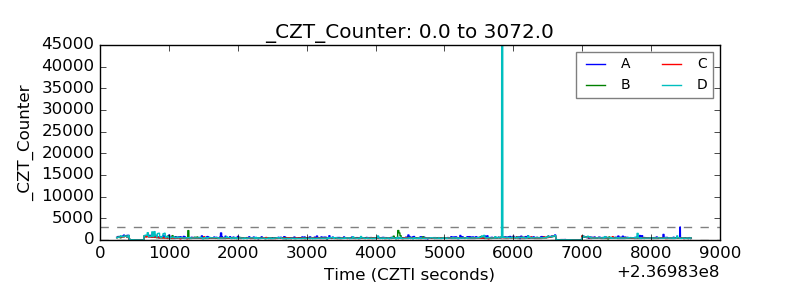 |
| +2.5 Volts monitor |  |
| +5 Volts monitor |  |
| _ROLL_ROT | 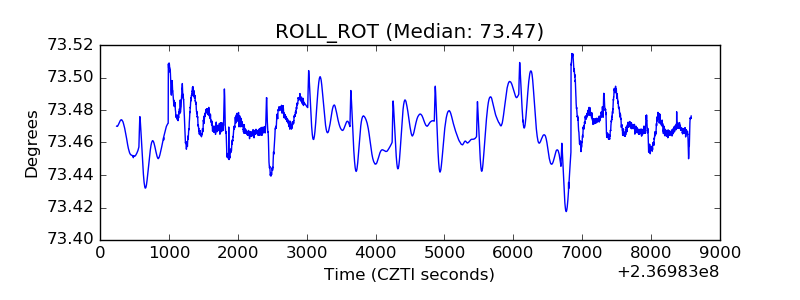 |
| _Roll_DEC | 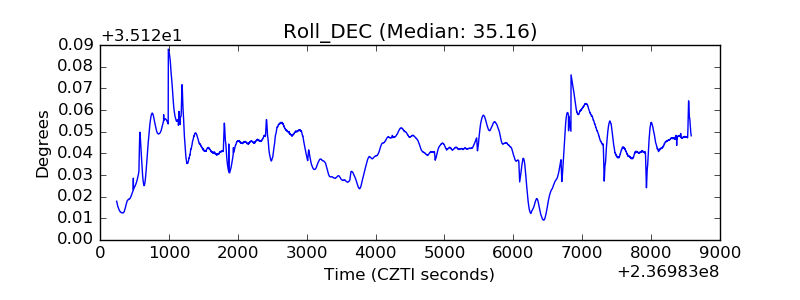 |
| _Roll_RA | 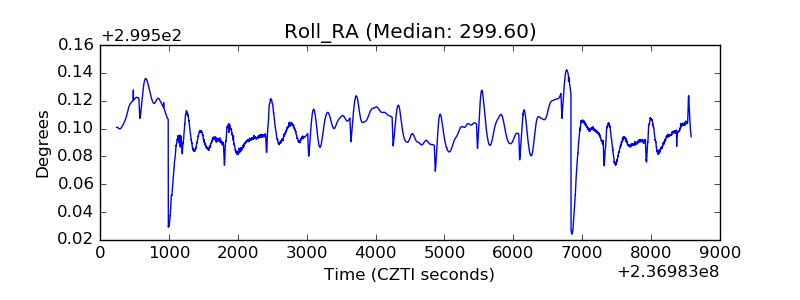 |
| Veto Counter | 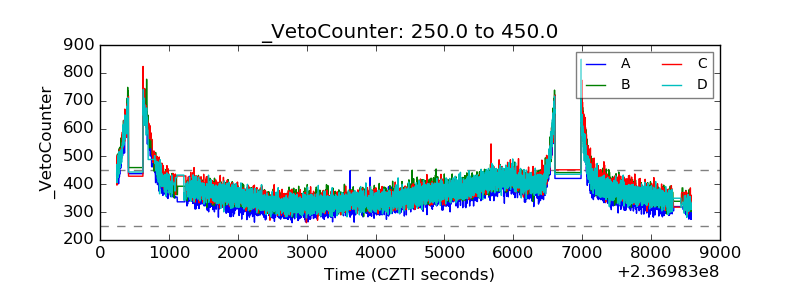 |