| Param | Original file | Final file |
|---|---|---|
| Filename | modeM0/AS1G07_042T01_9000001360_09575cztM0_level2.evt | modeM0/AS1G07_042T01_9000001360_09575cztM0_level2_quad_clean.evt |
| Size (bytes) | 875,839,680 | 178,260,480 |
| Size | 835.3 MB | 170.0 MB |
| Events in quadrant A | 6,995,366 | 1,142,834 |
| Events in quadrant B | 5,886,222 | 1,155,204 |
| Events in quadrant C | 5,663,170 | 1,142,154 |
| Events in quadrant D | 7,126,658 | 1,087,520 |
| Mode M9 | |||
|---|---|---|---|
| Quadrant | BADHDUFLAG | Total packets | Discarded packets |
| A | 0 | 13 | 0 |
| B | 0 | 13 | 0 |
| C | 0 | 13 | 0 |
| D | 0 | 13 | 0 |
| Mode M0 | |||
|---|---|---|---|
| Quadrant | BADHDUFLAG | Total packets | Discarded packets |
| A | 0 | 29261 | 26 |
| B | 0 | 26034 | 14 |
| C | 0 | 25712 | 22 |
| D | 0 | 29970 | 23 |
| Mode SS | |||
|---|---|---|---|
| Quadrant | BADHDUFLAG | Total packets | Discarded packets |
| A | 0 | 256 | 0 |
| B | 0 | 256 | 0 |
| C | 0 | 256 | 0 |
| D | 0 | 256 | 0 |
| Quadrant | Total seconds | Saturated seconds | Saturation percentage |
|---|---|---|---|
| A | 12604 | 165 | 1.309108% |
| B | 12608 | 76 | 0.602792% |
| C | 12604 | 45 | 0.357030% |
| D | 12604 | 394 | 3.125992% |
Noise dominated data is calculated using 1-second bins in cleaned event files. If a bin has >2000 counts, and if more than 50% of those come from <1% of pixels, then it is considered to be noise-dominated and hence unusable.
| Quadrant | # 1 sec bins | Bins with >0 counts | Bins with >2000 counts | High rate bins dominated by noise | Noise dominated (total time) | Noise dominated (detector-on time) | Marked lightcurve |
|---|---|---|---|---|---|---|---|
| A | 13874 | 12616 | 6 | 6 | 0.04% | 0.05% | 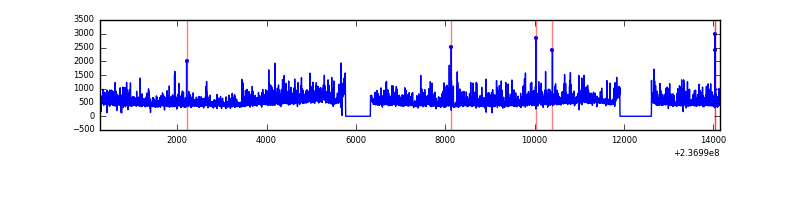 |
| B | 13874 | 12616 | 2 | 2 | 0.01% | 0.02% | 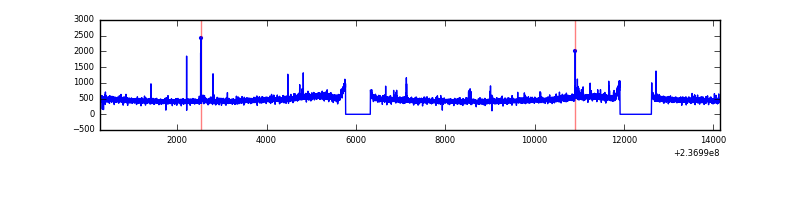 |
| C | 13874 | 12616 | 0 | 0 | 0.00% | 0.00% | 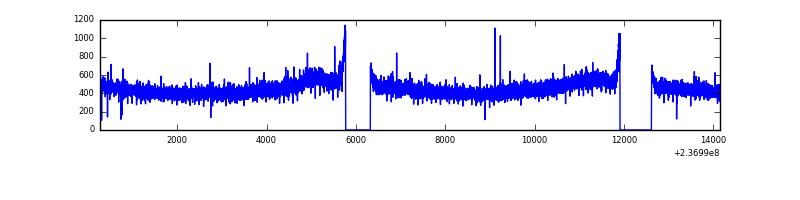 |
| D | 13874 | 12616 | 292 | 292 | 2.10% | 2.31% | 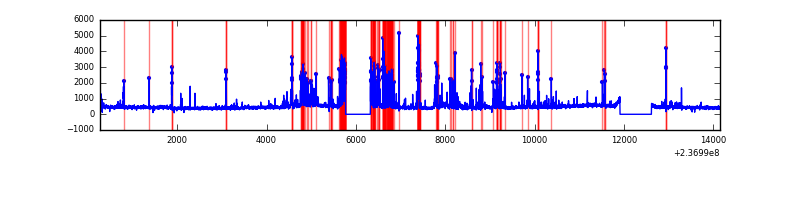 |
Top three noisy pixels from each quadrant. If the there are fewer than three noisy pixels in the level2.evt file, extra rows are filled as -1
| Pixel properties | Quadrant properties | ||||||
|---|---|---|---|---|---|---|---|
| Quadrant | DetID | PixID | Counts | Sigma | Mean | Median | Sigma |
| A | 1 | 162 | 498116 | 1644.98 | 1483 | 1457 | 301.9 |
| A | 1 | 178 | 257922 | 849.44 | 1483 | 1457 | 301.9 |
| A | 1 | 161 | 243694 | 802.31 | 1483 | 1457 | 301.9 |
| B | 4 | 80 | 48181 | 164.24 | 1491 | 1458 | 284.5 |
| B | 12 | 111 | 32349 | 108.59 | 1491 | 1458 | 284.5 |
| B | 15 | 85 | 28396 | 94.69 | 1491 | 1458 | 284.5 |
| C | 9 | 68 | 20451 | 56.68 | 1448 | 1458 | 335.1 |
| C | 13 | 61 | 10753 | 27.74 | 1448 | 1458 | 335.1 |
| C | 3 | 202 | 3725 | 6.77 | 1448 | 1458 | 335.1 |
| D | 1 | 52 | 886923 | 2476.98 | 1415 | 1383 | 357.5 |
| D | 12 | 233 | 524368 | 1462.86 | 1415 | 1383 | 357.5 |
| D | 13 | 122 | 190413 | 528.74 | 1415 | 1383 | 357.5 |
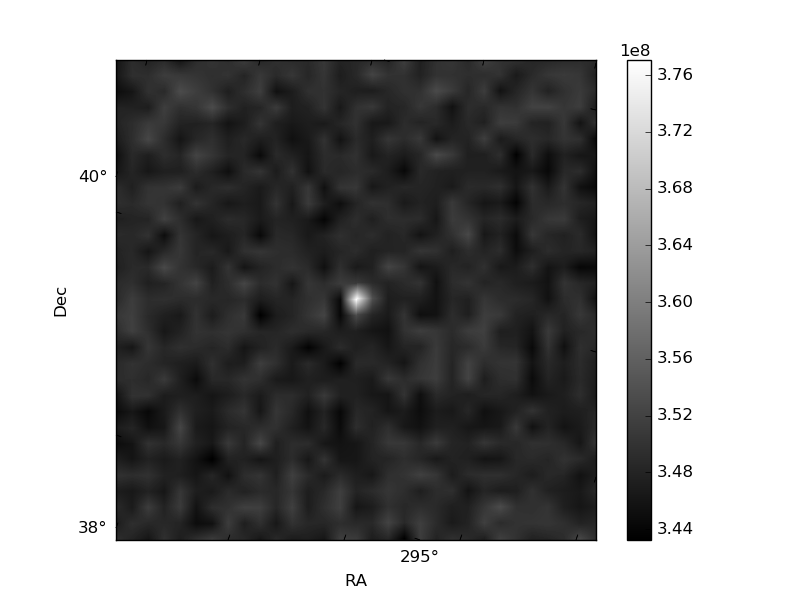
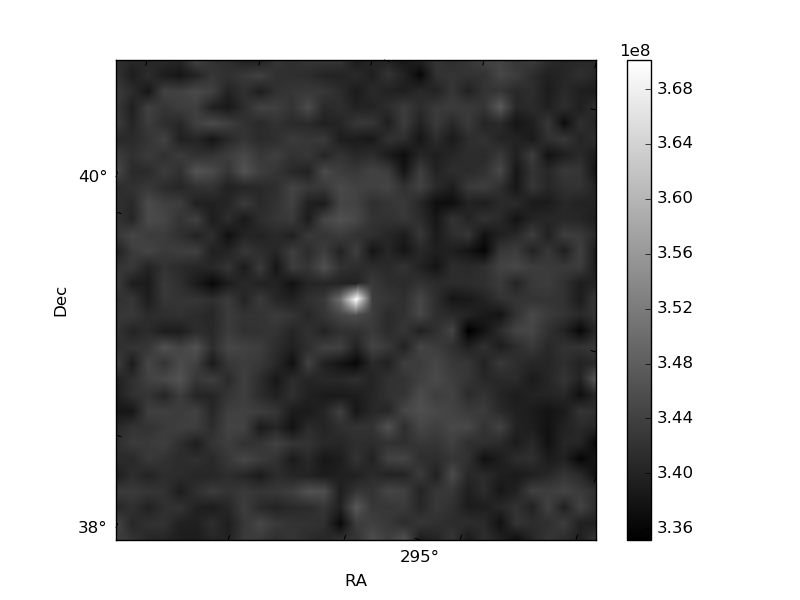
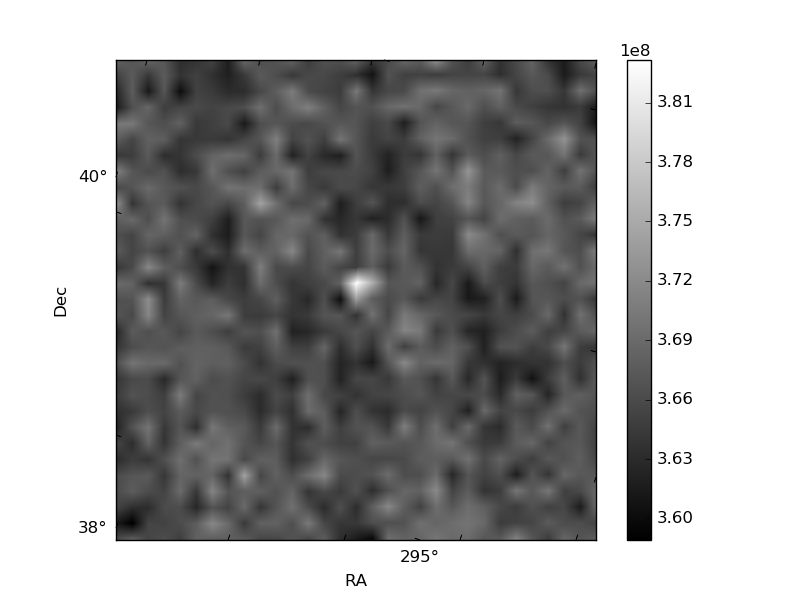
Histogram calculated using DETX and DETY for each event in the final _common_clean file
| Quadrant A | 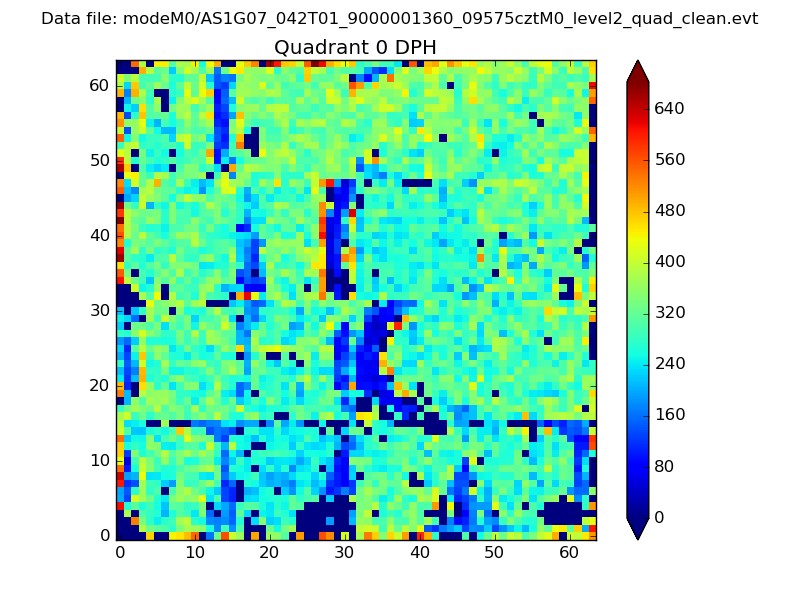 |
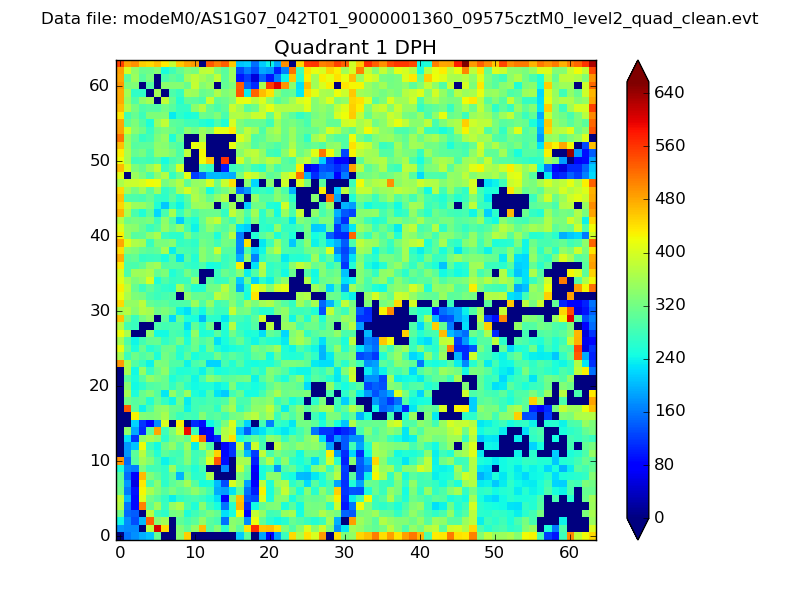 |
Quadrant B |
|---|---|---|---|
| Quadrant D | 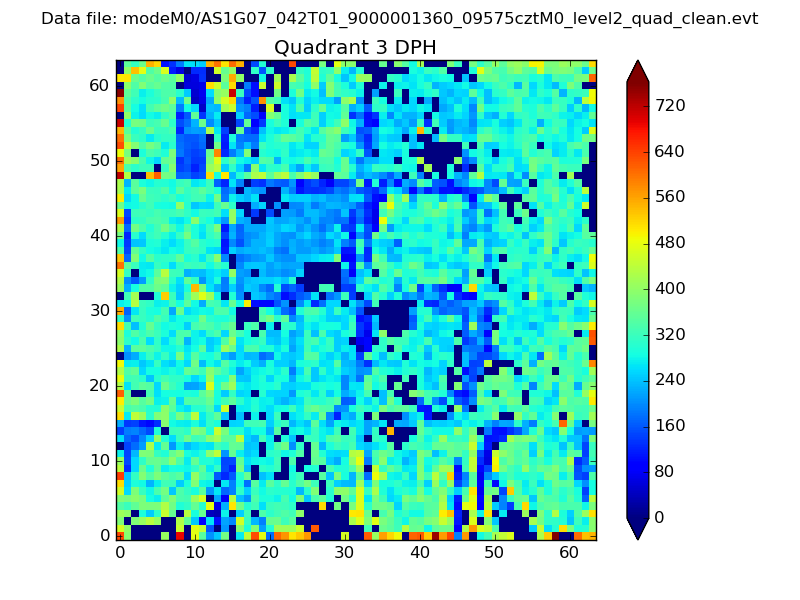 |
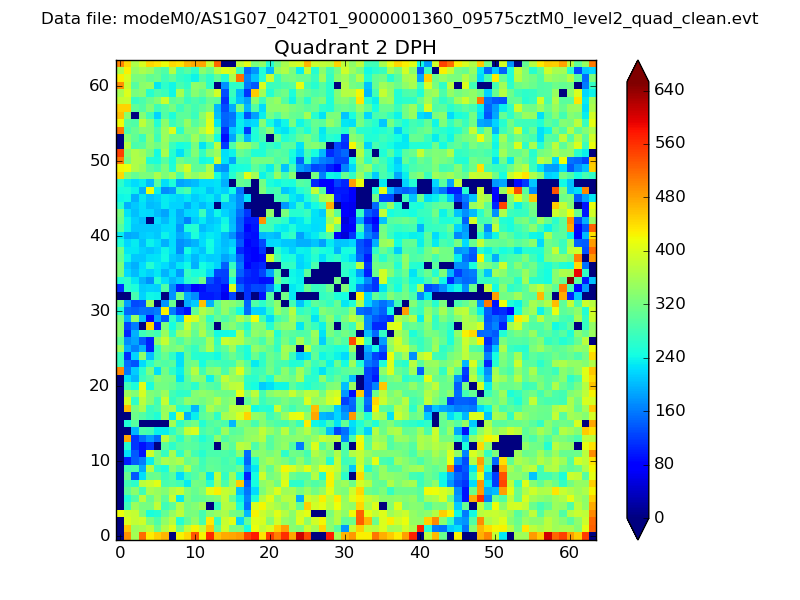 |
Quadrant C |
| Plot type | Count rate plots | Images |
|---|---|---|
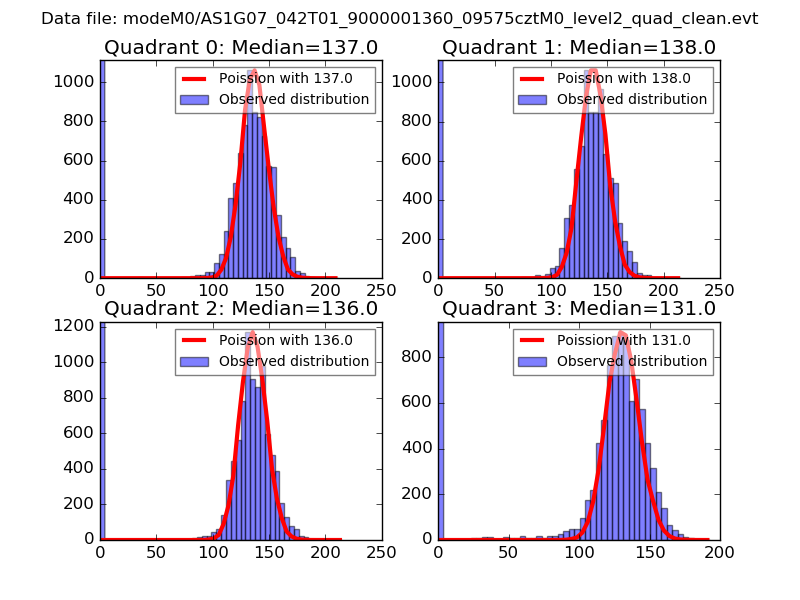
| Comparison with Poisson distribution Blue bars denote a histogram of data divided into 1 sec bins. Red curve is a Poisson curve with rate = median count rate of data. |
 |
 |
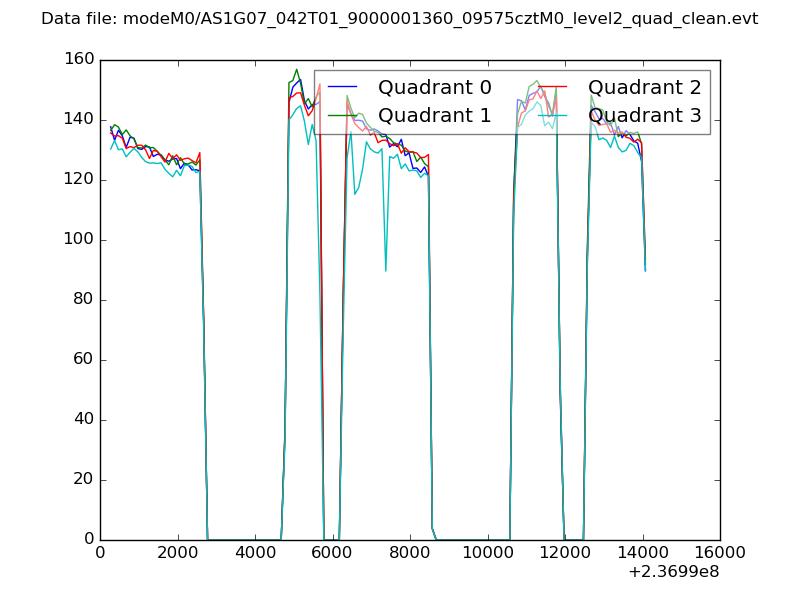
| Quadrant-wise count rates Data is divided into 100 sec bins |
 |
|
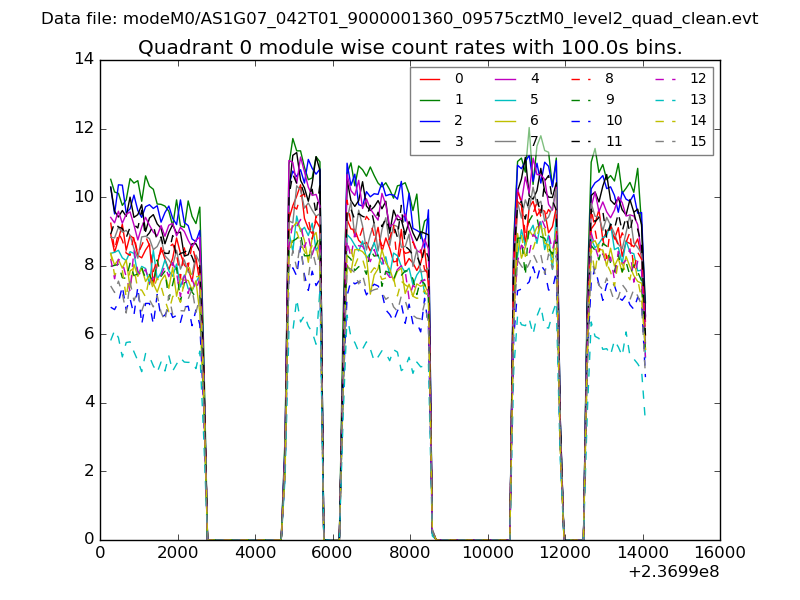
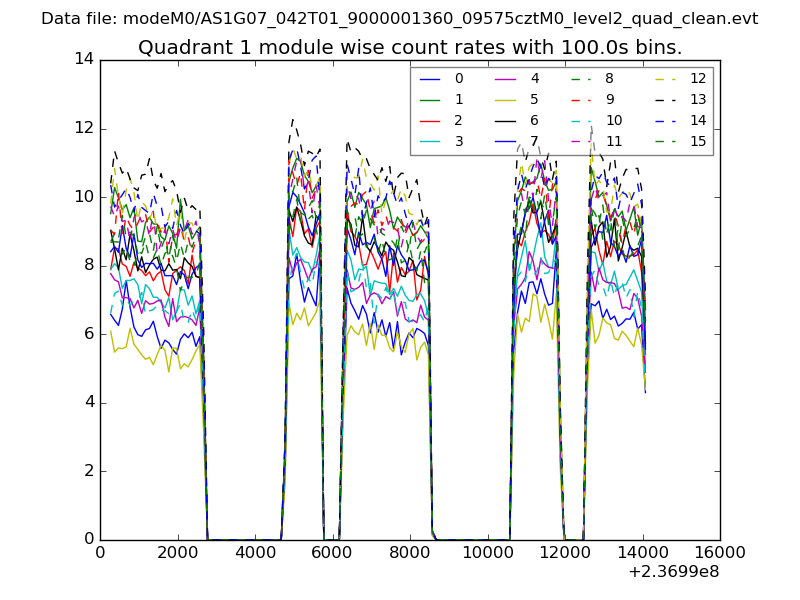
| Module-wise count rates for Quadrant A Data is divided into 100 sec bins |
 |
 |
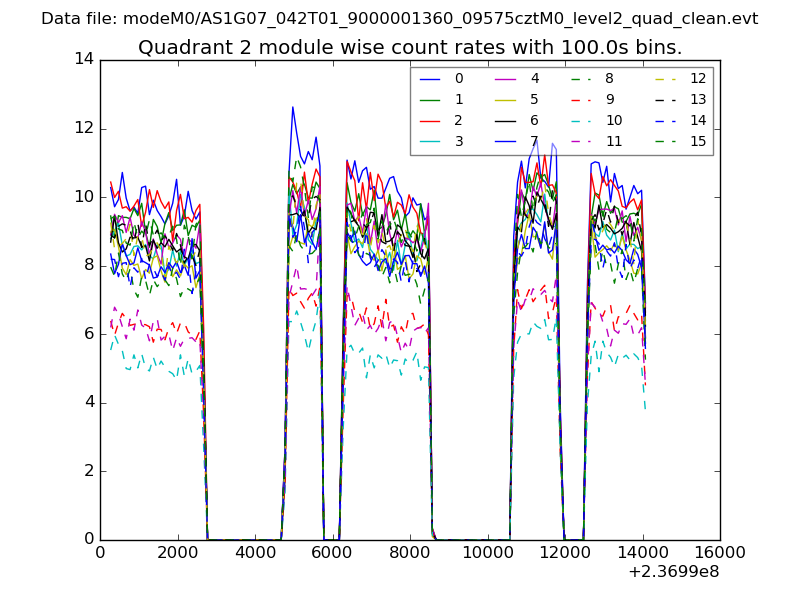
| Module-wise count rates for Quadrant B Data is divided into 100 sec bins |
 |
 |
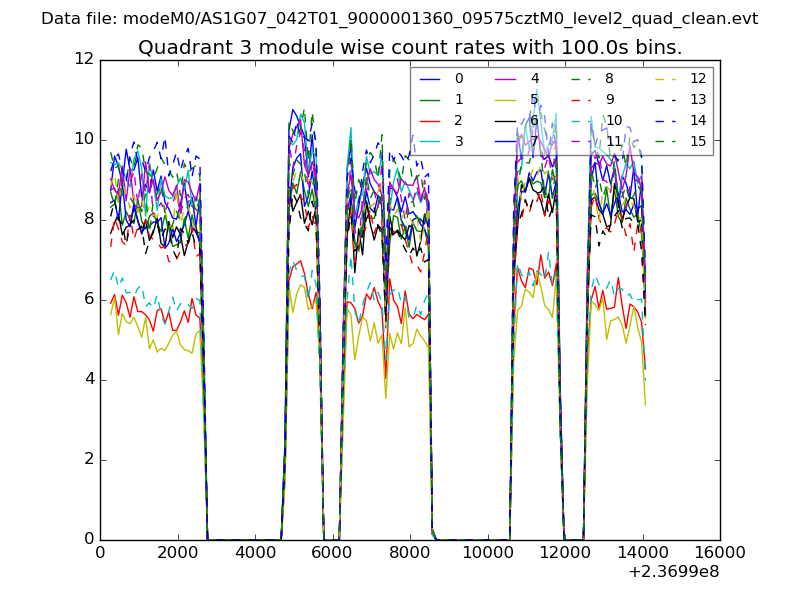
| Module-wise count rates for Quadrant C Data is divided into 100 sec bins |
 |
 |
| Module-wise count rates for Quadrant D Data is divided into 100 sec bins |
 |
 |
| Parameter | Plot |
|---|---|
| CZT HV Monitor | 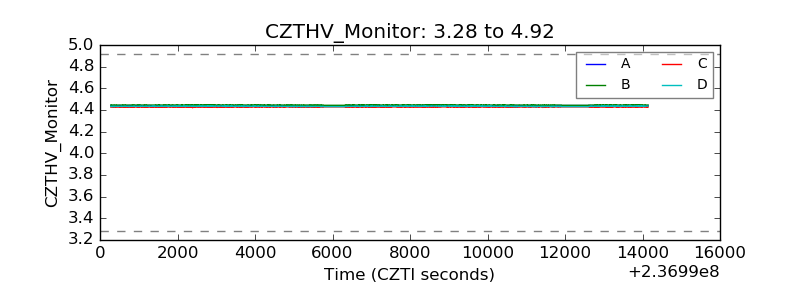 |
| D_VDD | 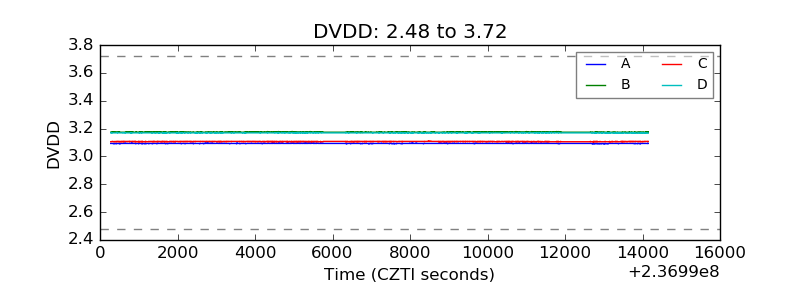 |
| Temperature 1 |  |
| Veto HV Monitor | 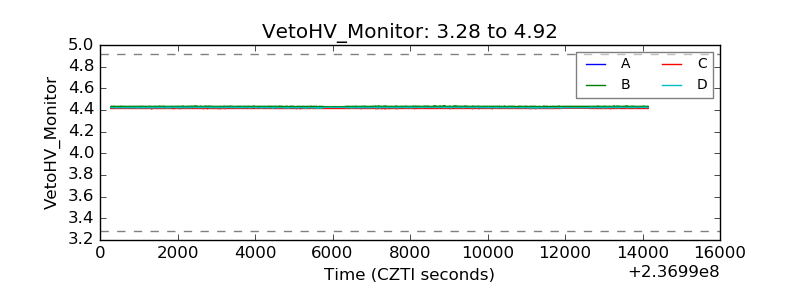 |
| Veto LLD | 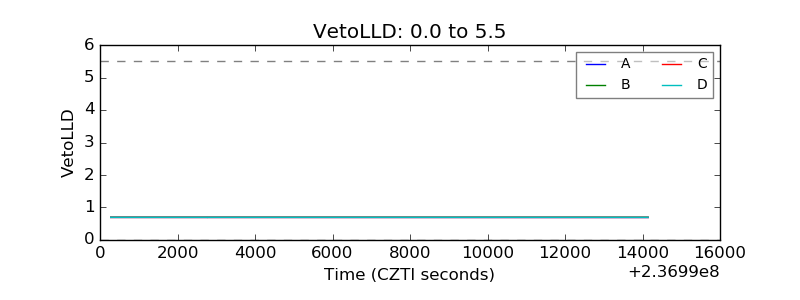 |
| Alpha Counter |  |
| _CPM_Rate | 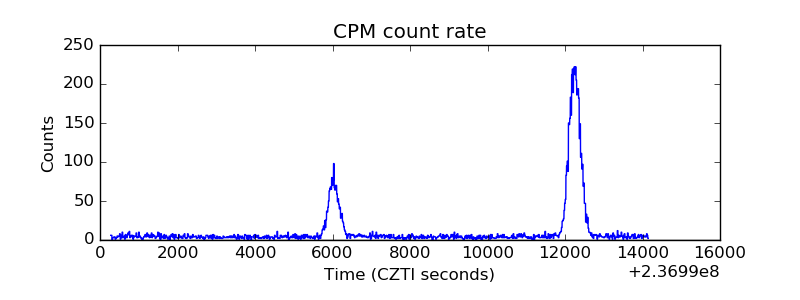 |
| CZT Counter | 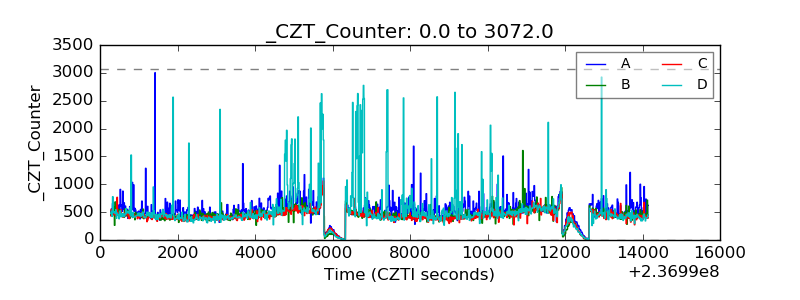 |
| +2.5 Volts monitor |  |
| +5 Volts monitor |  |
| _ROLL_ROT | 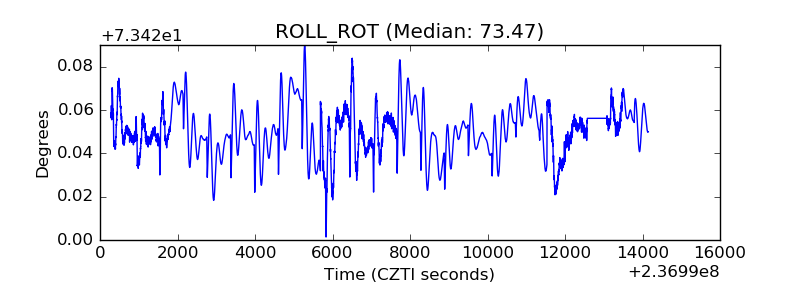 |
| _Roll_DEC |  |
| _Roll_RA | 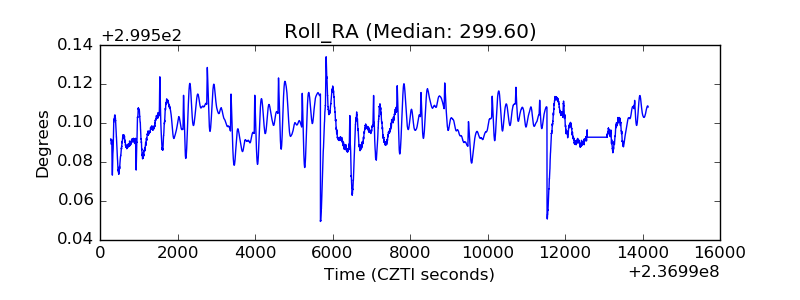 |
| Veto Counter | 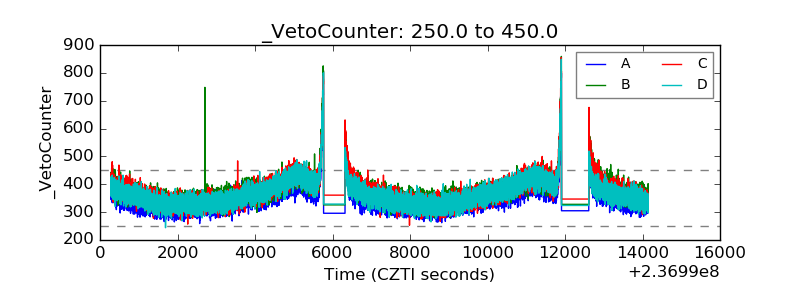 |