| Param | Original file | Final file |
|---|---|---|
| Filename | modeM0/AS1G07_042T01_9000001360_09576cztM0_level2.evt | modeM0/AS1G07_042T01_9000001360_09576cztM0_level2_quad_clean.evt |
| Size (bytes) | 1,590,914,880 | 318,931,200 |
| Size | 1.5 GB | 304.2 MB |
| Events in quadrant A | 12,856,563 | 2,033,467 |
| Events in quadrant B | 10,990,619 | 2,050,704 |
| Events in quadrant C | 10,493,940 | 2,029,744 |
| Events in quadrant D | 12,267,947 | 1,945,682 |
| Mode M9 | |||
|---|---|---|---|
| Quadrant | BADHDUFLAG | Total packets | Discarded packets |
| A | 0 | 25 | 0 |
| B | 0 | 25 | 0 |
| C | 0 | 25 | 0 |
| D | 0 | 25 | 0 |
| Mode M0 | |||
|---|---|---|---|
| Quadrant | BADHDUFLAG | Total packets | Discarded packets |
| A | 0 | 54158 | 463 |
| B | 0 | 48616 | 355 |
| C | 0 | 47804 | 399 |
| D | 0 | 52929 | 368 |
| Mode SS | |||
|---|---|---|---|
| Quadrant | BADHDUFLAG | Total packets | Discarded packets |
| A | 0 | 476 | 0 |
| B | 0 | 476 | 0 |
| C | 0 | 476 | 2 |
| D | 0 | 476 | 4 |
| Quadrant | Total seconds | Saturated seconds | Saturation percentage |
|---|---|---|---|
| A | 23239 | 311 | 1.338268% |
| B | 23262 | 189 | 0.812484% |
| C | 23240 | 95 | 0.408778% |
| D | 23258 | 464 | 1.995012% |
Noise dominated data is calculated using 1-second bins in cleaned event files. If a bin has >2000 counts, and if more than 50% of those come from <1% of pixels, then it is considered to be noise-dominated and hence unusable.
| Quadrant | # 1 sec bins | Bins with >0 counts | Bins with >2000 counts | High rate bins dominated by noise | Noise dominated (total time) | Noise dominated (detector-on time) | Marked lightcurve |
|---|---|---|---|---|---|---|---|
| A | 25936 | 23380 | 10 | 10 | 0.04% | 0.04% | 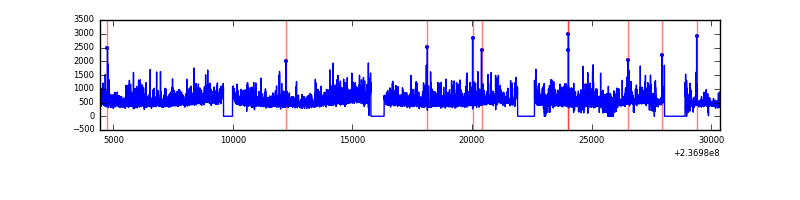 |
| B | 25936 | 23398 | 18 | 18 | 0.07% | 0.08% |  |
| C | 25936 | 23375 | 0 | 0 | 0.00% | 0.00% | 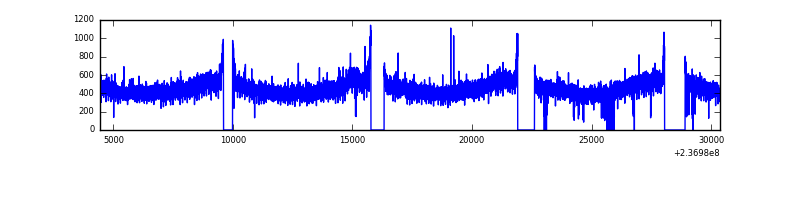 |
| D | 25936 | 23378 | 308 | 308 | 1.19% | 1.32% | 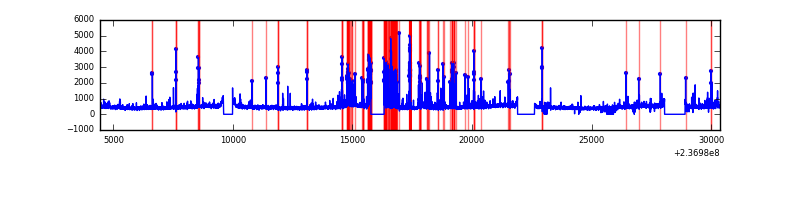 |
Top three noisy pixels from each quadrant. If the there are fewer than three noisy pixels in the level2.evt file, extra rows are filled as -1
| Pixel properties | Quadrant properties | ||||||
|---|---|---|---|---|---|---|---|
| Quadrant | DetID | PixID | Counts | Sigma | Mean | Median | Sigma |
| A | 1 | 162 | 873306 | 1561.42 | 2755 | 2705 | 557.6 |
| A | 1 | 178 | 452871 | 807.37 | 2755 | 2705 | 557.6 |
| A | 1 | 161 | 427831 | 762.46 | 2755 | 2705 | 557.6 |
| B | 4 | 80 | 112116 | 207.46 | 2769 | 2704 | 527.4 |
| B | 12 | 111 | 60517 | 109.62 | 2769 | 2704 | 527.4 |
| B | 11 | 111 | 49184 | 88.13 | 2769 | 2704 | 527.4 |
| C | 9 | 68 | 33430 | 49.68 | 2684 | 2706 | 618.4 |
| C | 13 | 61 | 19974 | 27.92 | 2684 | 2706 | 618.4 |
| C | 3 | 202 | 6833 | 6.67 | 2684 | 2706 | 618.4 |
| D | 1 | 52 | 1149581 | 1718.57 | 2646 | 2585 | 667.4 |
| D | 12 | 233 | 531995 | 793.23 | 2646 | 2585 | 667.4 |
| D | 13 | 122 | 202186 | 299.07 | 2646 | 2585 | 667.4 |
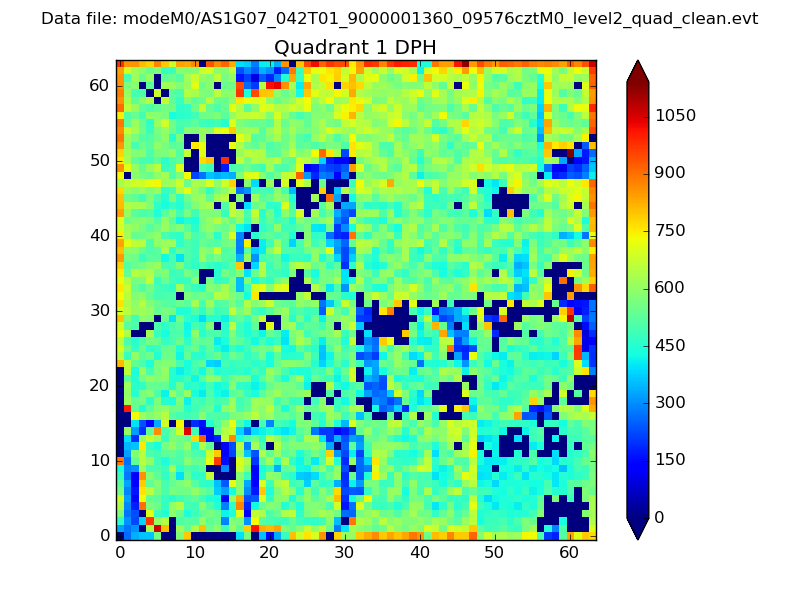
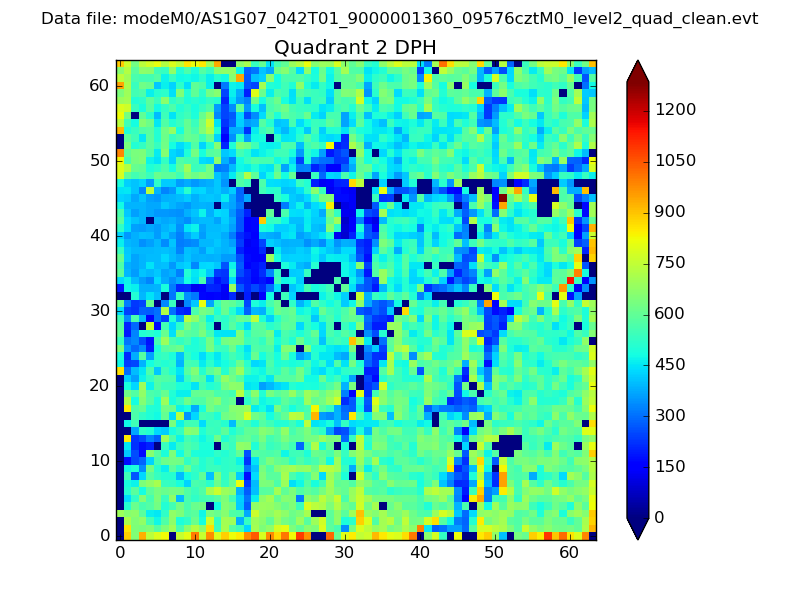
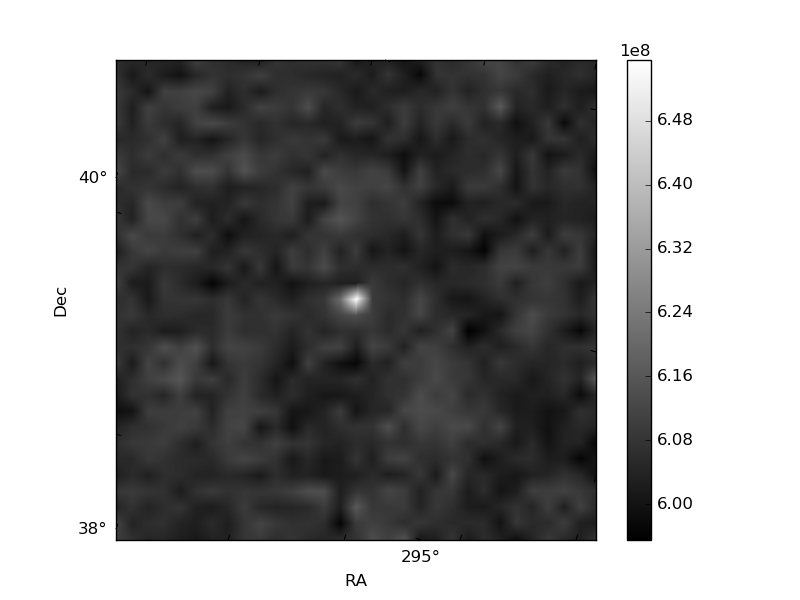
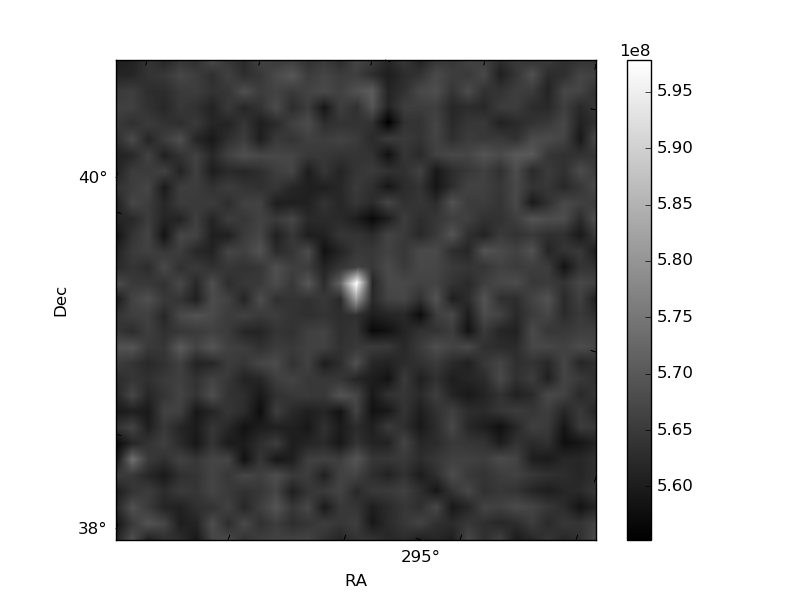
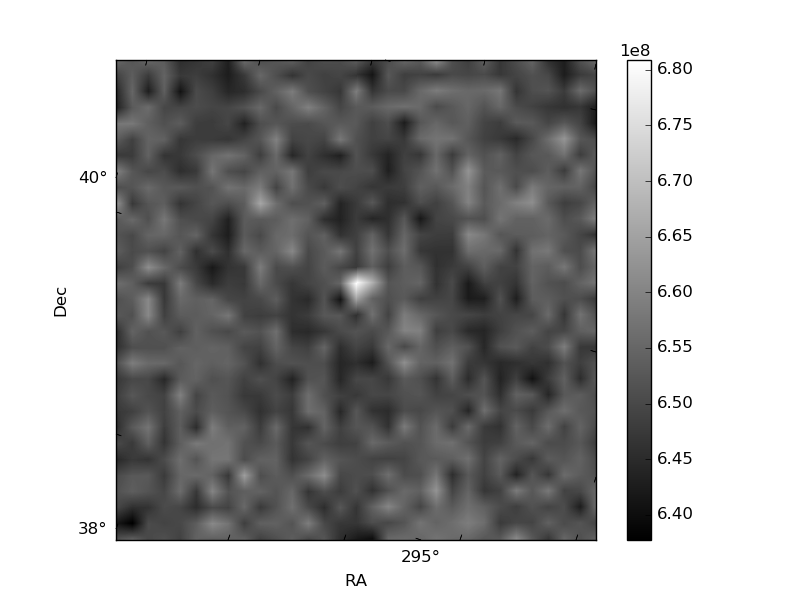
Histogram calculated using DETX and DETY for each event in the final _common_clean file
| Quadrant A | 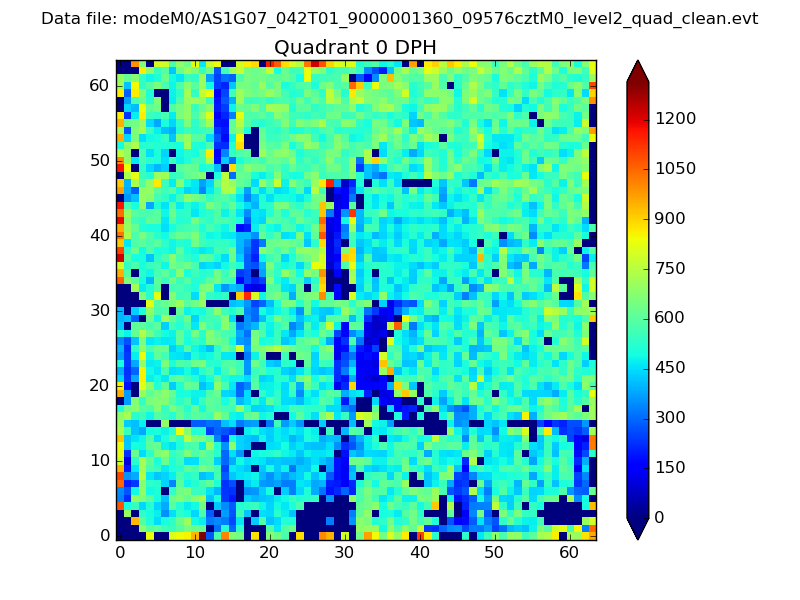 |
 |
Quadrant B |
|---|---|---|---|
| Quadrant D | 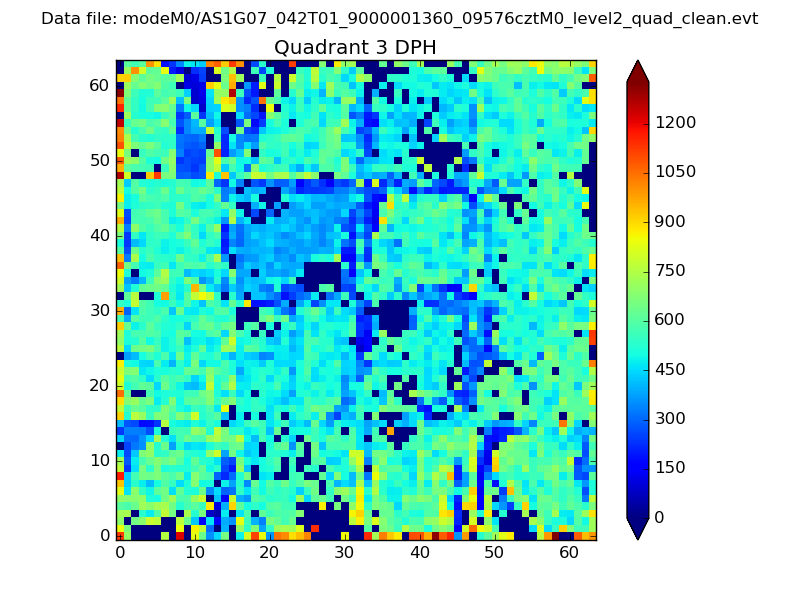 |
 |
Quadrant C |
| Plot type | Count rate plots | Images |
|---|---|---|
| Comparison with Poisson distribution Blue bars denote a histogram of data divided into 1 sec bins. Red curve is a Poisson curve with rate = median count rate of data. |
 |
 |
| Quadrant-wise count rates Data is divided into 100 sec bins |
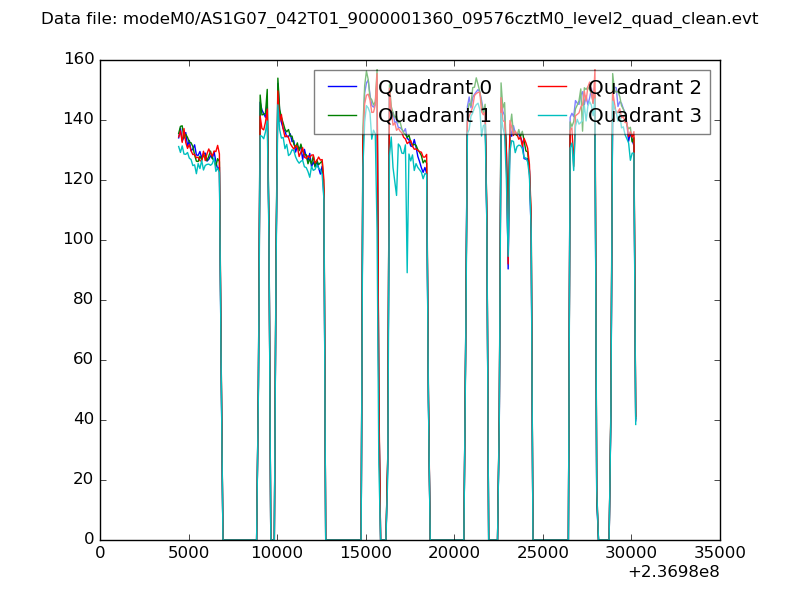 |
|
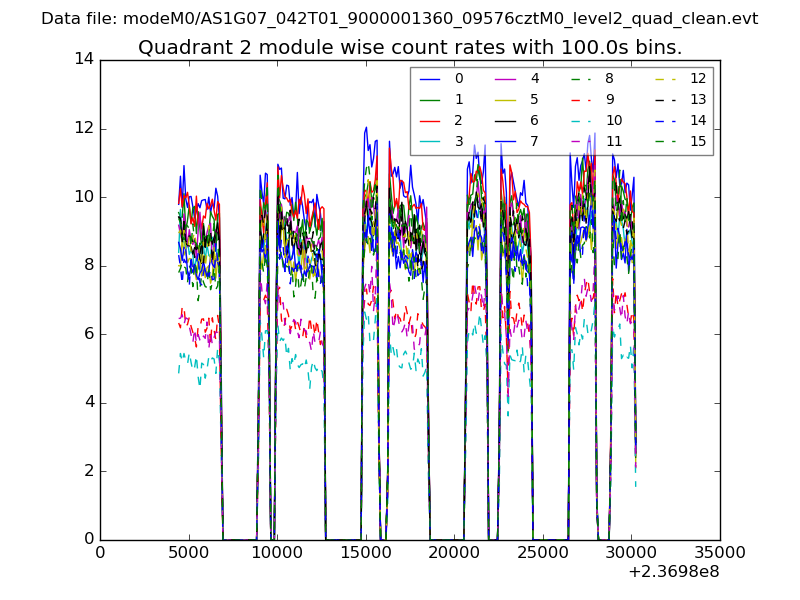
| Module-wise count rates for Quadrant A Data is divided into 100 sec bins |
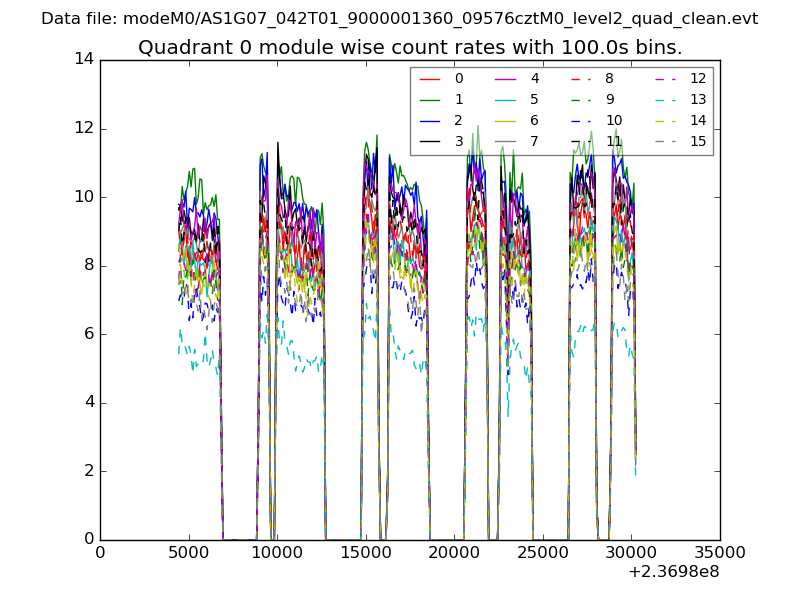 |
 |
| Module-wise count rates for Quadrant B Data is divided into 100 sec bins |
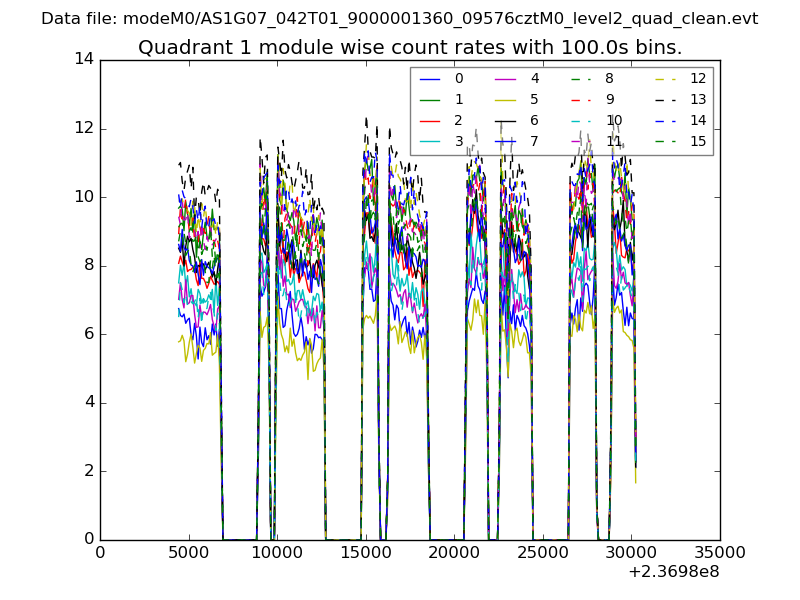 |
 |
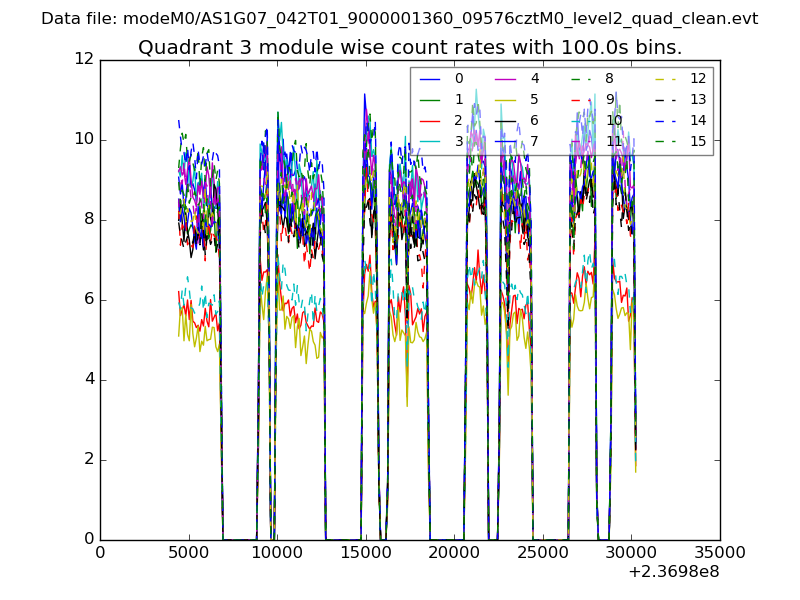
| Module-wise count rates for Quadrant C Data is divided into 100 sec bins |
 |
 |
| Module-wise count rates for Quadrant D Data is divided into 100 sec bins |
 |
 |
| Parameter | Plot |
|---|---|
| CZT HV Monitor | 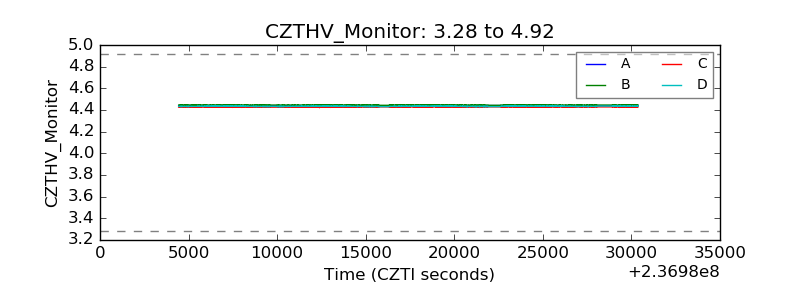 |
| D_VDD | 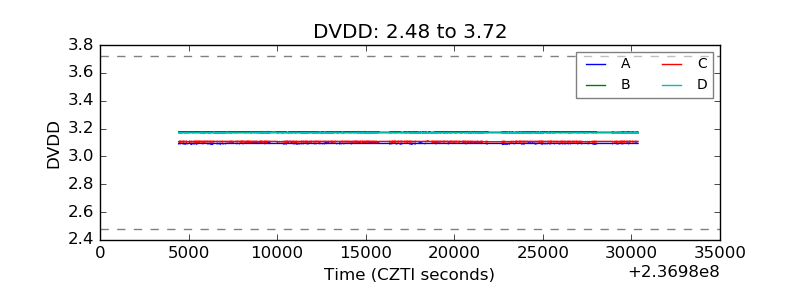 |
| Temperature 1 | 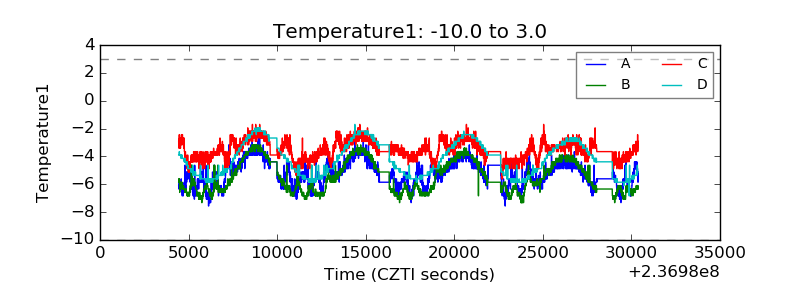 |
| Veto HV Monitor | 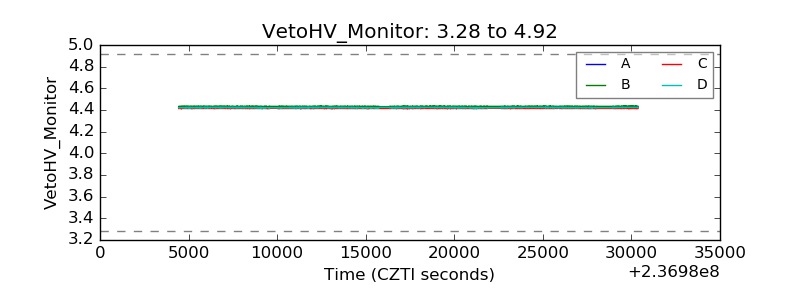 |
| Veto LLD | 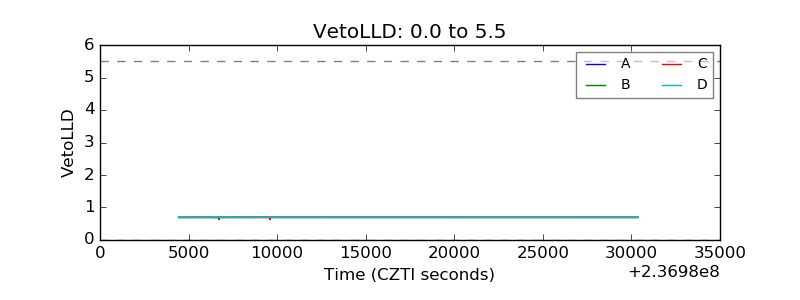 |
| Alpha Counter | 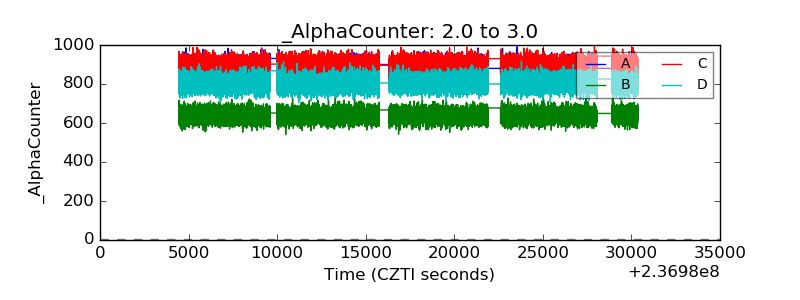 |
| _CPM_Rate | 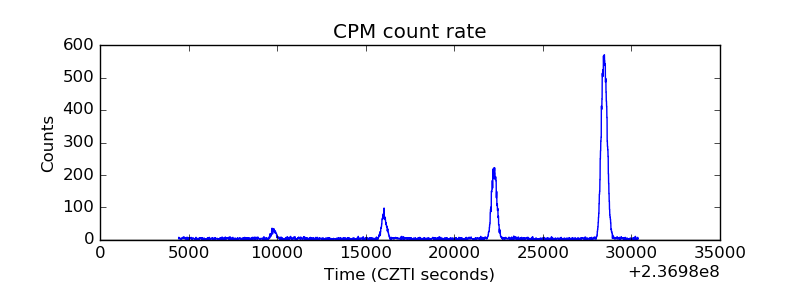 |
| CZT Counter | 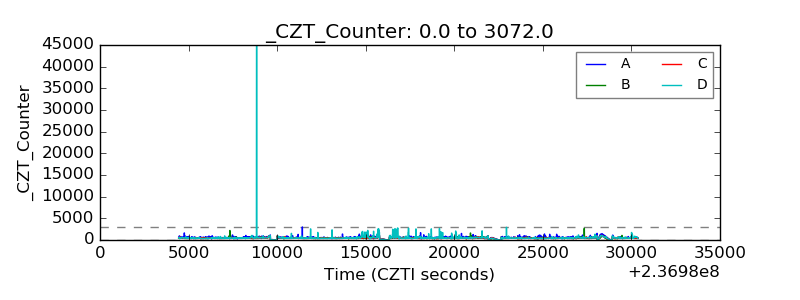 |
| +2.5 Volts monitor |  |
| +5 Volts monitor | 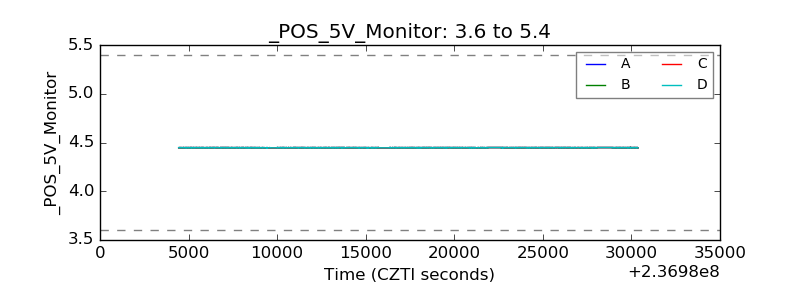 |
| _ROLL_ROT | 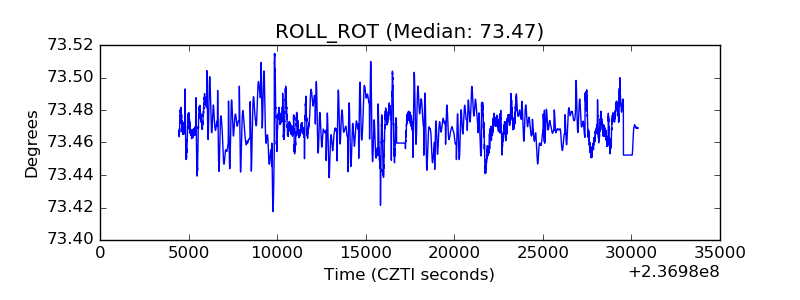 |
| _Roll_DEC | 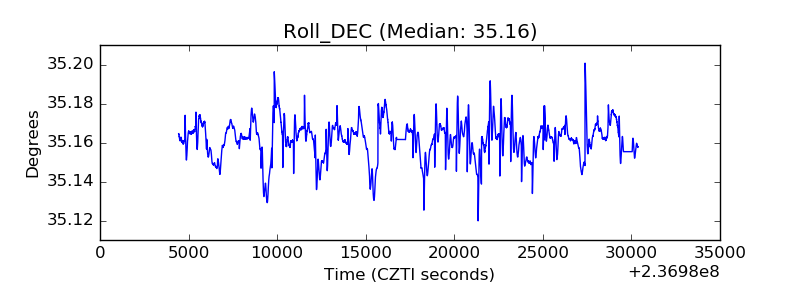 |
| _Roll_RA | 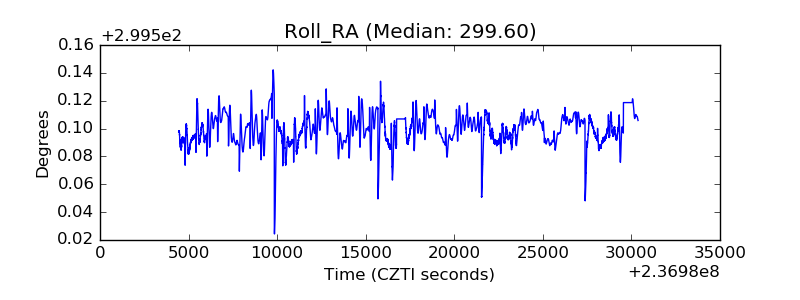 |
| Veto Counter | 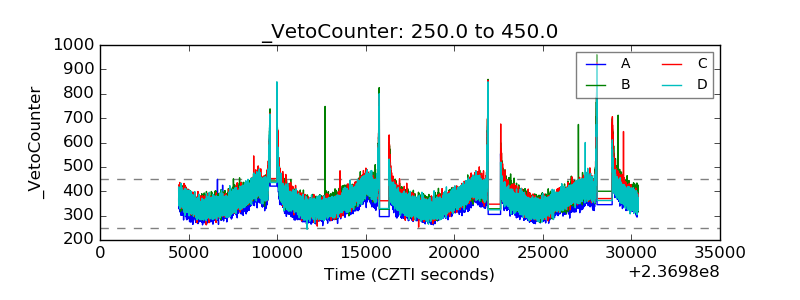 |