| Param | Original file | Final file |
|---|---|---|
| Filename | modeM0/AS1G07_042T01_9000001360_09577cztM0_level2.evt | modeM0/AS1G07_042T01_9000001360_09577cztM0_level2_quad_clean.evt |
| Size (bytes) | 330,408,000 | 64,445,760 |
| Size | 315.1 MB | 61.5 MB |
| Events in quadrant A | 2,573,468 | 403,658 |
| Events in quadrant B | 2,376,036 | 412,191 |
| Events in quadrant C | 2,229,406 | 404,922 |
| Events in quadrant D | 2,496,219 | 389,942 |
| Mode M9 | |||
|---|---|---|---|
| Quadrant | BADHDUFLAG | Total packets | Discarded packets |
| A | 0 | 10 | 0 |
| B | 0 | 10 | 0 |
| C | 0 | 10 | 0 |
| D | 0 | 10 | 0 |
| Mode M0 | |||
|---|---|---|---|
| Quadrant | BADHDUFLAG | Total packets | Discarded packets |
| A | 0 | 12933 | 2049 |
| B | 0 | 11908 | 1804 |
| C | 0 | 11637 | 1761 |
| D | 0 | 12613 | 2024 |
| Mode SS | |||
|---|---|---|---|
| Quadrant | BADHDUFLAG | Total packets | Discarded packets |
| A | 0 | 118 | 16 |
| B | 0 | 118 | 20 |
| C | 0 | 118 | 16 |
| D | 0 | 118 | 14 |
| Quadrant | Total seconds | Saturated seconds | Saturation percentage |
|---|---|---|---|
| A | 4812 | 75 | 1.558603% |
| B | 4849 | 61 | 1.257991% |
| C | 4856 | 39 | 0.803130% |
| D | 4839 | 75 | 1.549907% |
Noise dominated data is calculated using 1-second bins in cleaned event files. If a bin has >2000 counts, and if more than 50% of those come from <1% of pixels, then it is considered to be noise-dominated and hence unusable.
| Quadrant | # 1 sec bins | Bins with >0 counts | Bins with >2000 counts | High rate bins dominated by noise | Noise dominated (total time) | Noise dominated (detector-on time) | Marked lightcurve |
|---|---|---|---|---|---|---|---|
| A | 6768 | 5106 | 2 | 2 | 0.03% | 0.04% | 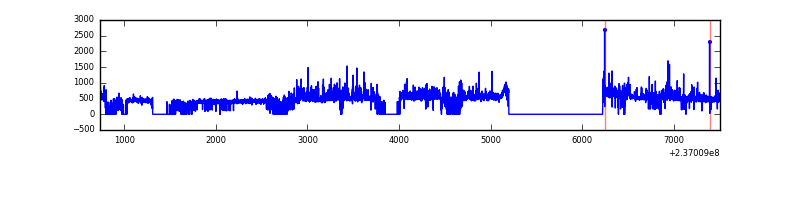 |
| B | 6768 | 5148 | 6 | 6 | 0.09% | 0.12% | 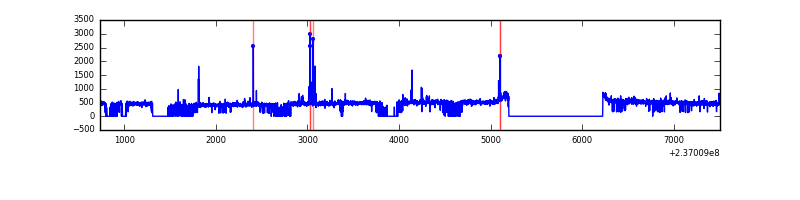 |
| C | 6768 | 5152 | 0 | 0 | 0.00% | 0.00% | 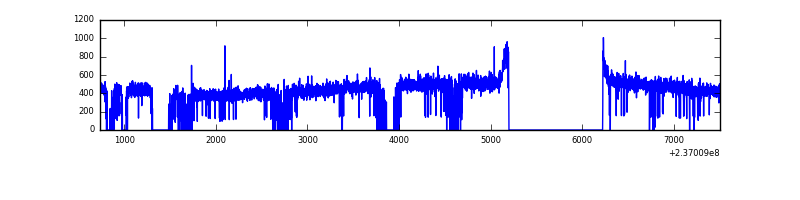 |
| D | 6768 | 5145 | 14 | 14 | 0.21% | 0.27% | 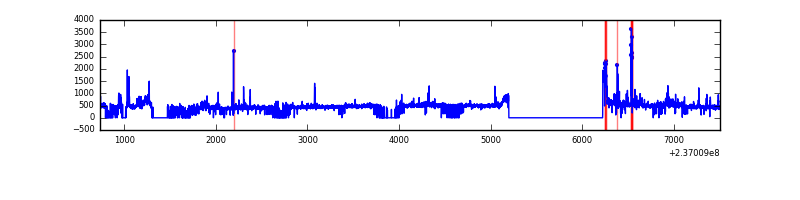 |
Top three noisy pixels from each quadrant. If the there are fewer than three noisy pixels in the level2.evt file, extra rows are filled as -1
| Pixel properties | Quadrant properties | ||||||
|---|---|---|---|---|---|---|---|
| Quadrant | DetID | PixID | Counts | Sigma | Mean | Median | Sigma |
| A | 1 | 162 | 136686 | 1134.84 | 586 | 575 | 119.9 |
| A | 1 | 178 | 66041 | 545.83 | 586 | 575 | 119.9 |
| A | 1 | 161 | 63164 | 521.84 | 586 | 575 | 119.9 |
| B | 10 | 245 | 71185 | 619.33 | 591 | 577 | 114.0 |
| B | 12 | 111 | 13011 | 109.06 | 591 | 577 | 114.0 |
| B | 11 | 111 | 10712 | 88.9 | 591 | 577 | 114.0 |
| C | 13 | 61 | 4169 | 26.95 | 571 | 575 | 133.3 |
| C | 12 | 4 | 1803 | 9.21 | 571 | 575 | 133.3 |
| C | 3 | 202 | 1408 | 6.25 | 571 | 575 | 133.3 |
| D | 1 | 52 | 156078 | 1049.62 | 565 | 554 | 148.2 |
| D | 2 | 136 | 63837 | 427.09 | 565 | 554 | 148.2 |
| D | 10 | 172 | 32140 | 213.17 | 565 | 554 | 148.2 |
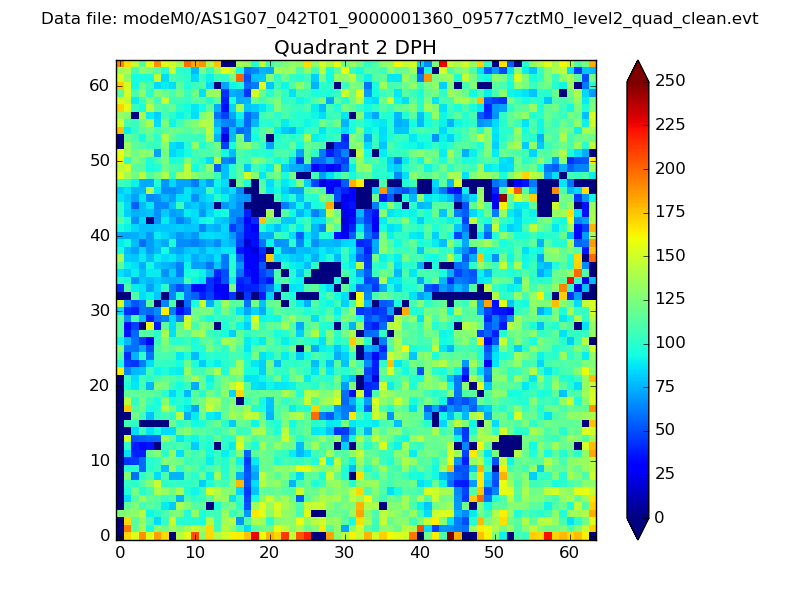
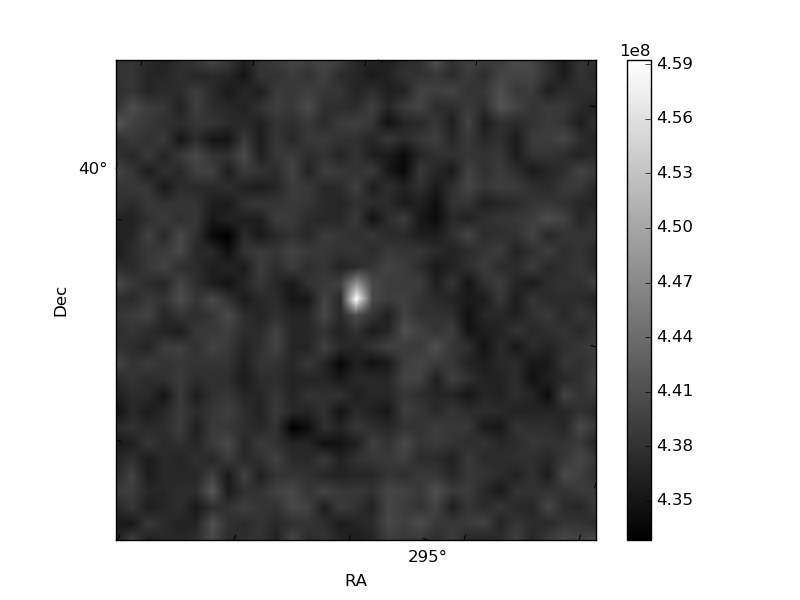
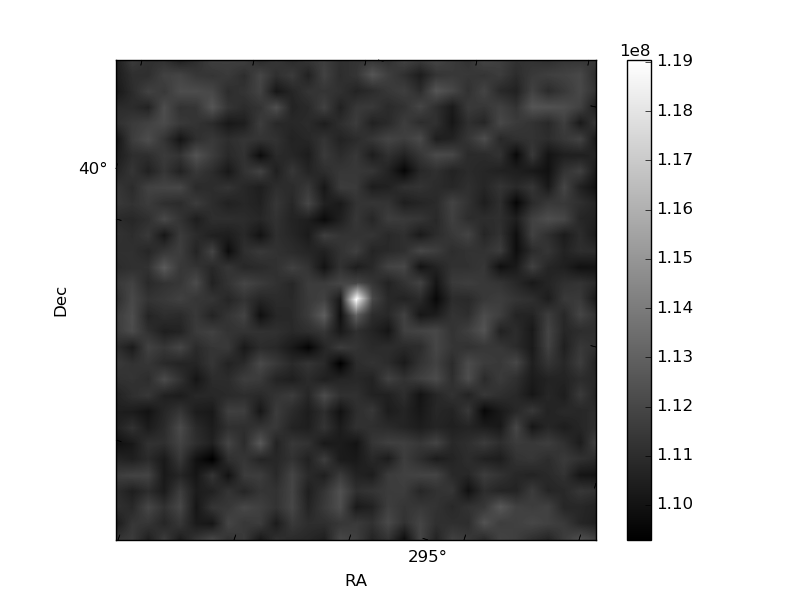
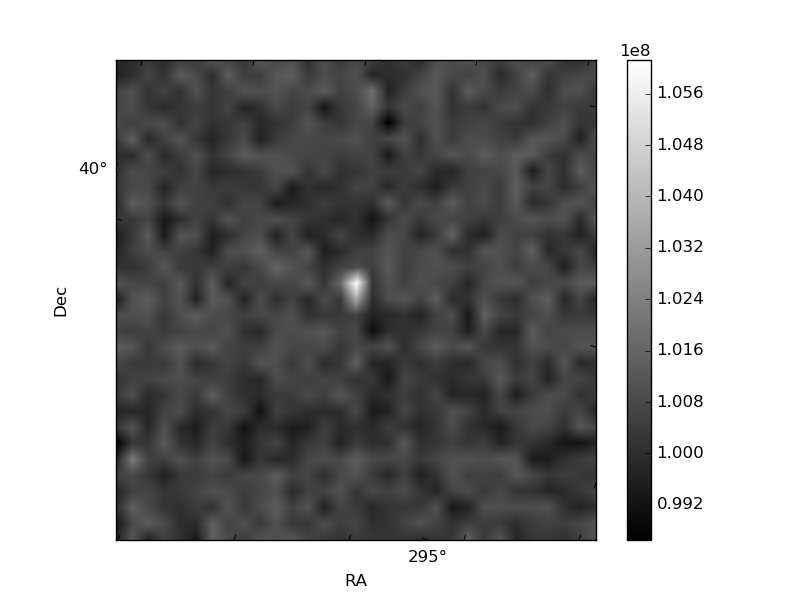
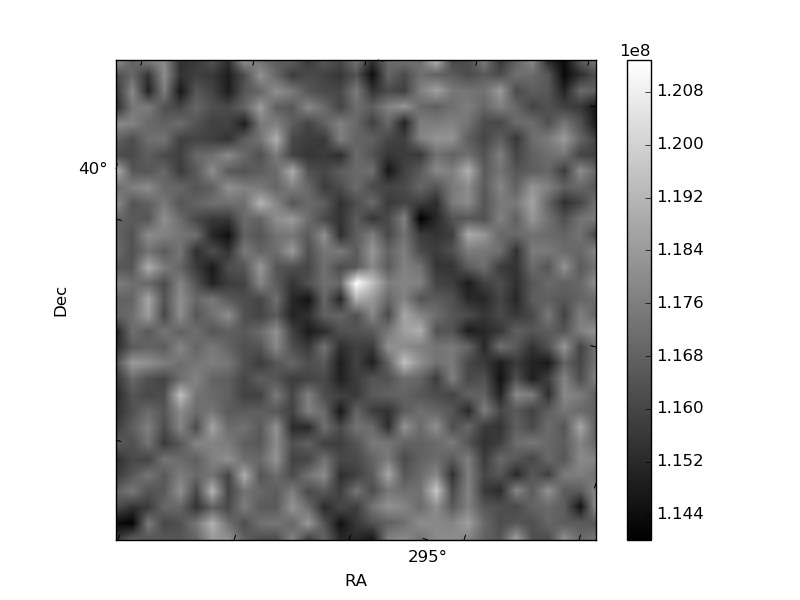
Histogram calculated using DETX and DETY for each event in the final _common_clean file
| Quadrant A | 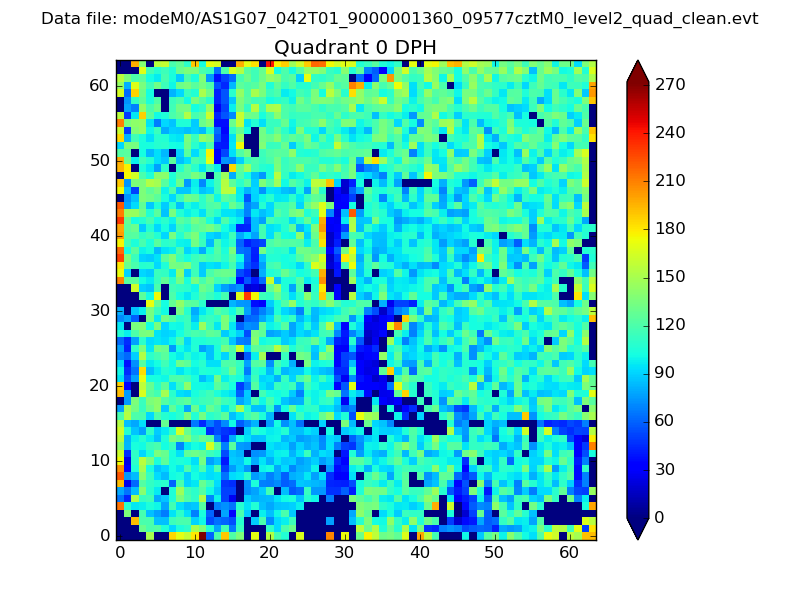 |
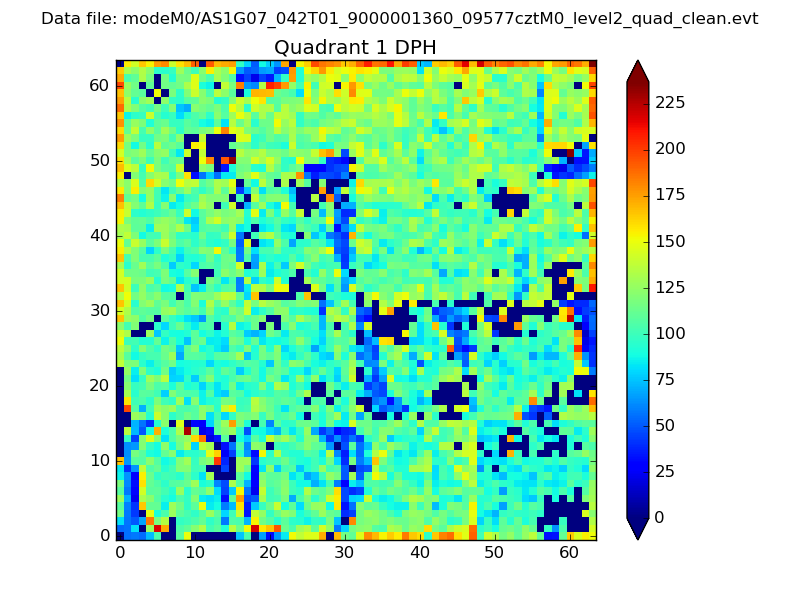 |
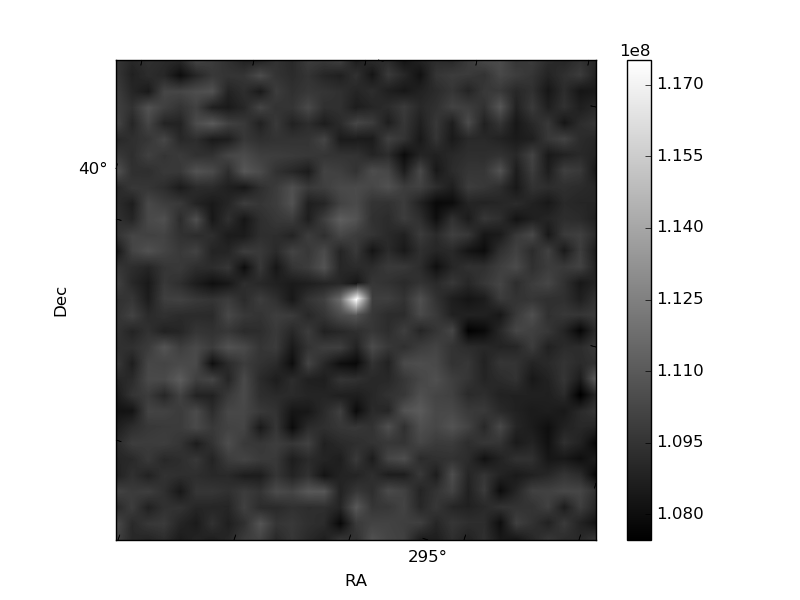
Quadrant B |
|---|---|---|---|
| Quadrant D | 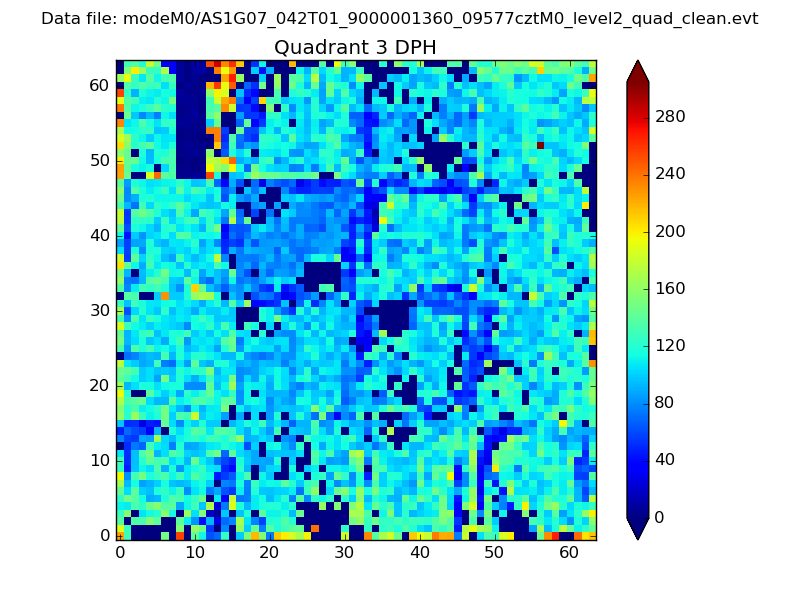 |
 |
Quadrant C |
| Plot type | Count rate plots | Images |
|---|---|---|
| Comparison with Poisson distribution Blue bars denote a histogram of data divided into 1 sec bins. Red curve is a Poisson curve with rate = median count rate of data. |
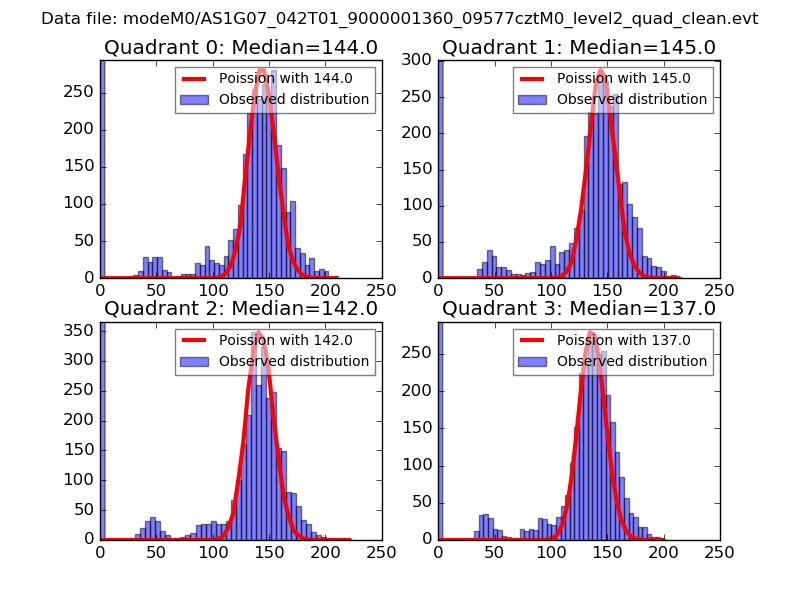 |
 |
| Quadrant-wise count rates Data is divided into 100 sec bins |
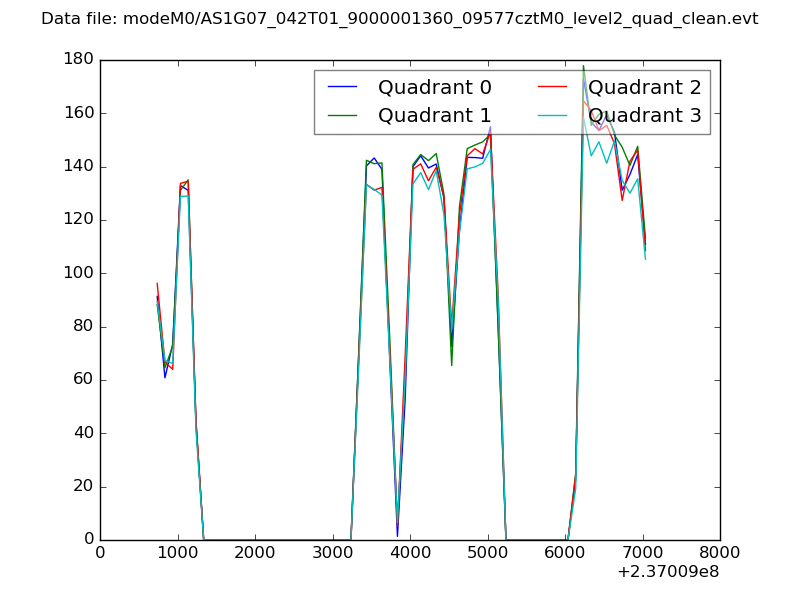 |
|
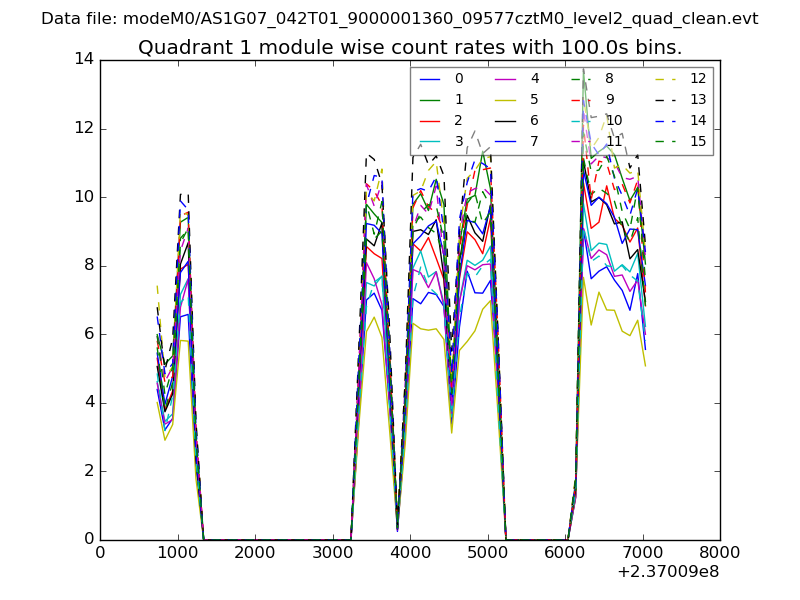
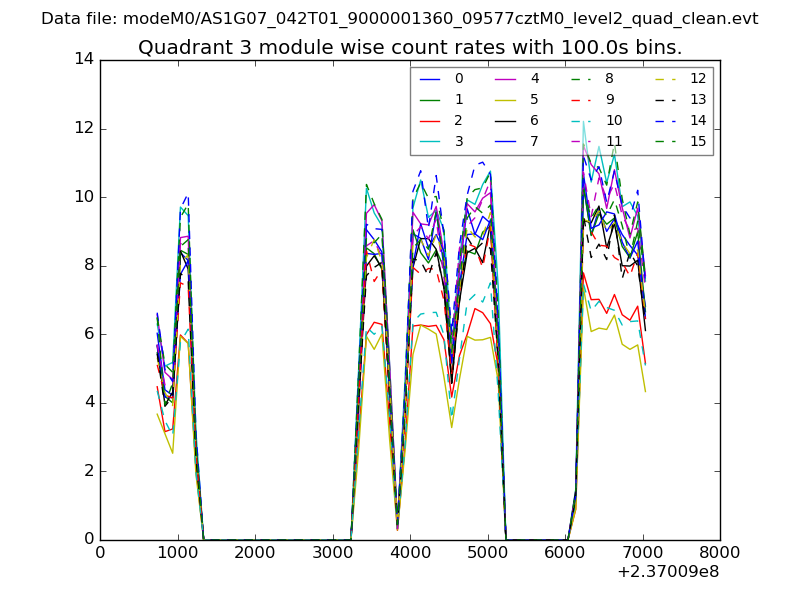
| Module-wise count rates for Quadrant A Data is divided into 100 sec bins |
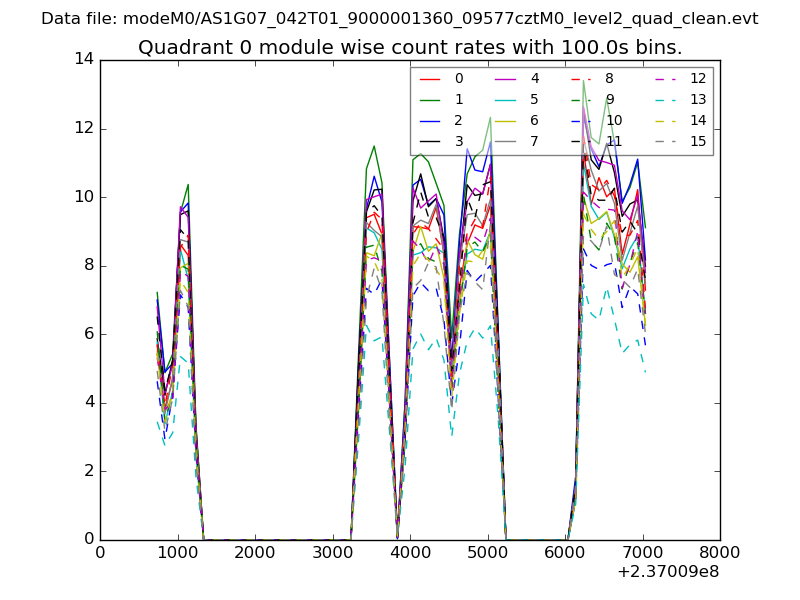 |
 |
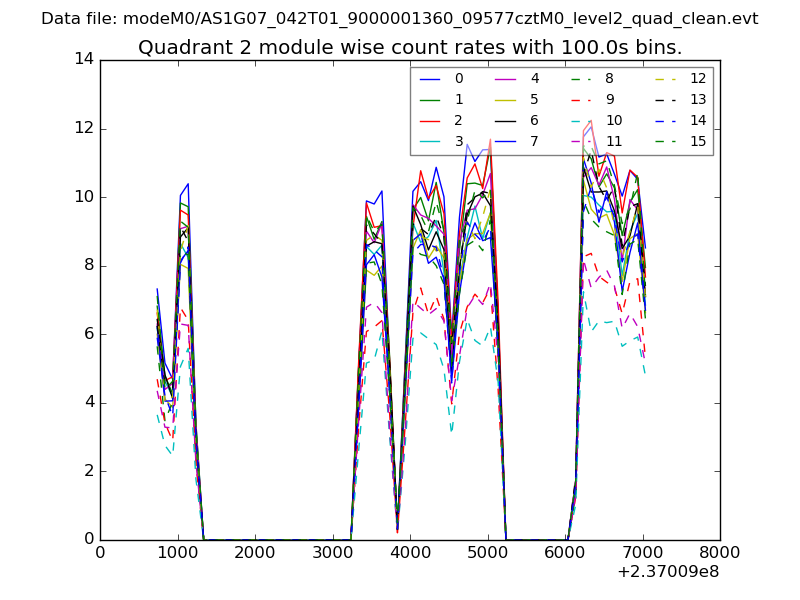
| Module-wise count rates for Quadrant B Data is divided into 100 sec bins |
 |
 |
| Module-wise count rates for Quadrant C Data is divided into 100 sec bins |
 |
 |
| Module-wise count rates for Quadrant D Data is divided into 100 sec bins |
 |
 |
| Parameter | Plot |
|---|---|
| CZT HV Monitor | 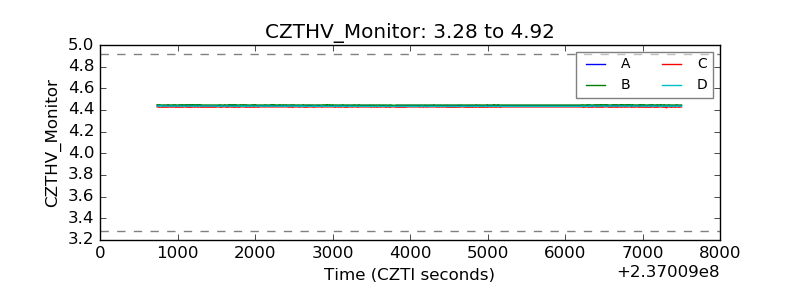 |
| D_VDD | 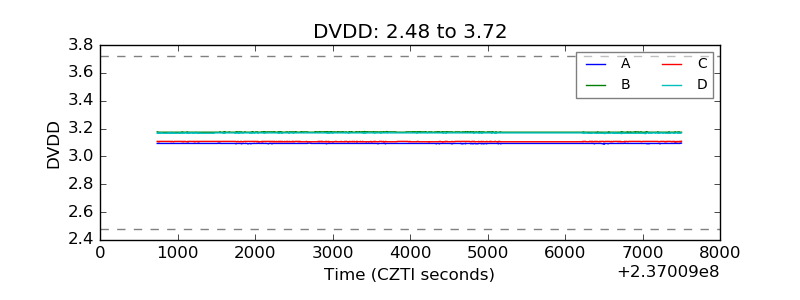 |
| Temperature 1 | 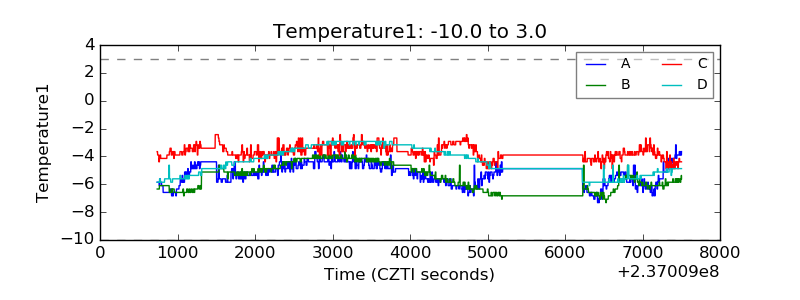 |
| Veto HV Monitor | 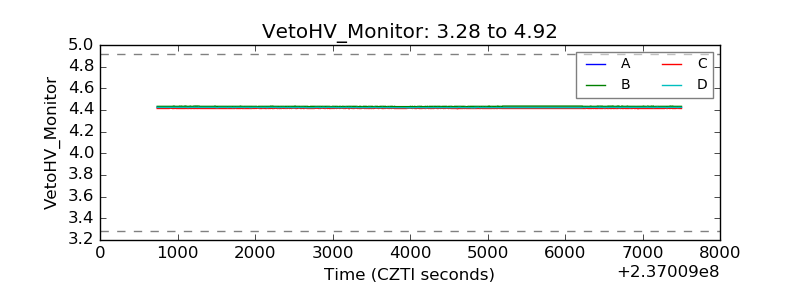 |
| Veto LLD | 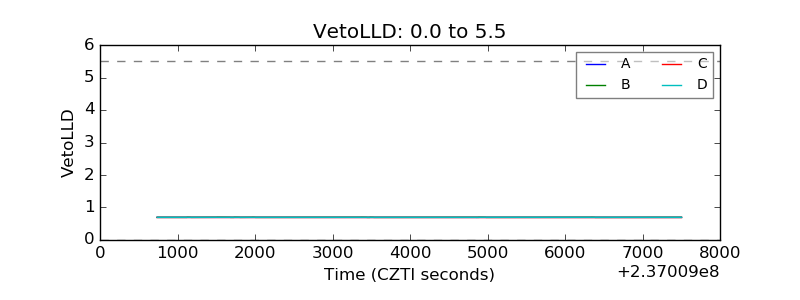 |
| Alpha Counter | 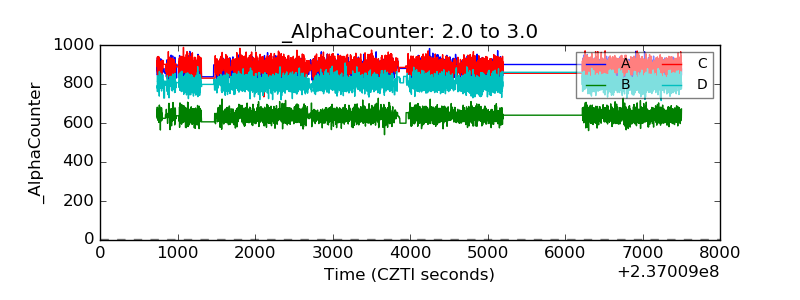 |
| _CPM_Rate | 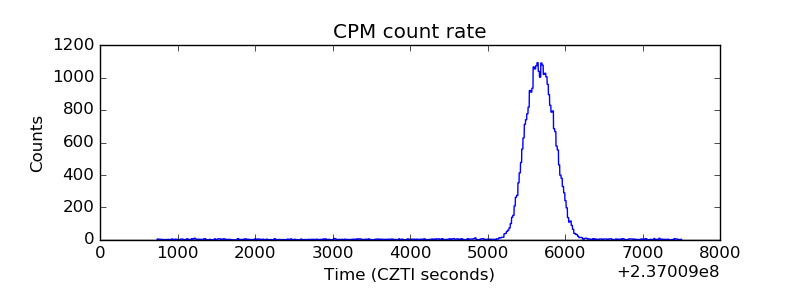 |
| CZT Counter | 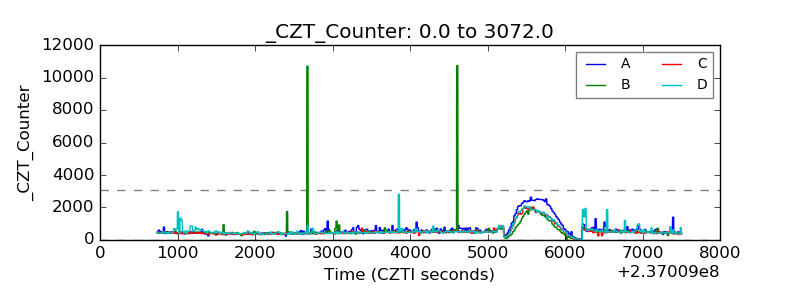 |
| +2.5 Volts monitor |  |
| +5 Volts monitor |  |
| _ROLL_ROT | 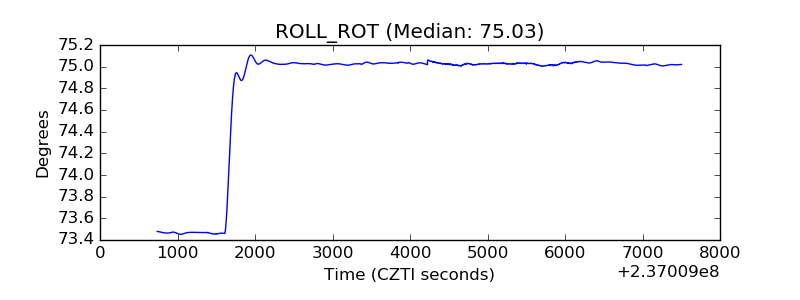 |
| _Roll_DEC | 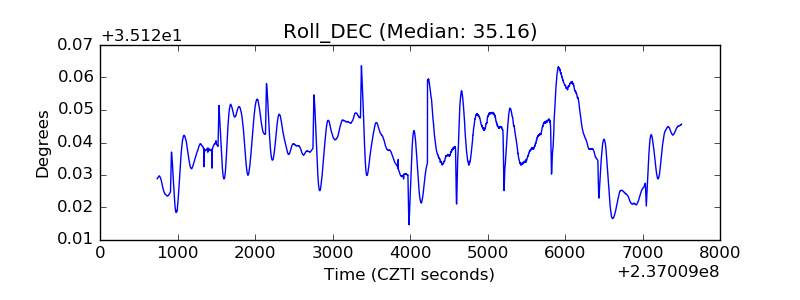 |
| _Roll_RA | 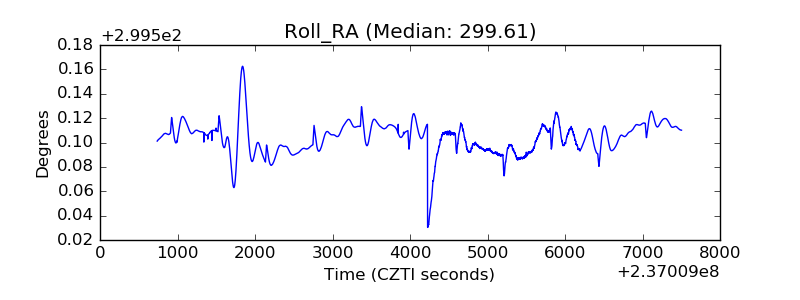 |
| Veto Counter | 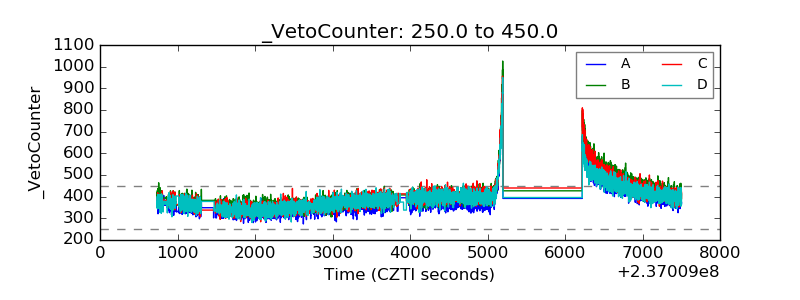 |