| Param | Original file | Final file |
|---|---|---|
| Filename | modeM0/AS1G07_042T01_9000001360_09581cztM0_level2.evt | modeM0/AS1G07_042T01_9000001360_09581cztM0_level2_quad_clean.evt |
| Size (bytes) | 567,348,480 | 69,557,760 |
| Size | 541.1 MB | 66.3 MB |
| Events in quadrant A | 3,919,372 | 432,024 |
| Events in quadrant B | 3,407,603 | 434,958 |
| Events in quadrant C | 3,225,248 | 425,047 |
| Events in quadrant D | 6,202,716 | 373,762 |
| Mode M9 | |||
|---|---|---|---|
| Quadrant | BADHDUFLAG | Total packets | Discarded packets |
| A | 0 | 20 | 0 |
| B | 0 | 20 | 0 |
| C | 0 | 20 | 0 |
| D | 0 | 21 | 0 |
| Mode M0 | |||
|---|---|---|---|
| Quadrant | BADHDUFLAG | Total packets | Discarded packets |
| A | 0 | 15782 | 3 |
| B | 0 | 13768 | 2 |
| C | 0 | 13260 | 2 |
| D | 0 | 22521 | 2 |
| Mode SS | |||
|---|---|---|---|
| Quadrant | BADHDUFLAG | Total packets | Discarded packets |
| A | 0 | 128 | 0 |
| B | 0 | 128 | 0 |
| C | 0 | 128 | 0 |
| D | 0 | 128 | 0 |
| Quadrant | Total seconds | Saturated seconds | Saturation percentage |
|---|---|---|---|
| A | 6305 | 150 | 2.379064% |
| B | 6305 | 100 | 1.586043% |
| C | 6305 | 61 | 0.967486% |
| D | 6305 | 1052 | 16.685170% |
Noise dominated data is calculated using 1-second bins in cleaned event files. If a bin has >2000 counts, and if more than 50% of those come from <1% of pixels, then it is considered to be noise-dominated and hence unusable.
| Quadrant | # 1 sec bins | Bins with >0 counts | Bins with >2000 counts | High rate bins dominated by noise | Noise dominated (total time) | Noise dominated (detector-on time) | Marked lightcurve |
|---|---|---|---|---|---|---|---|
| A | 7630 | 6306 | 3 | 3 | 0.04% | 0.05% | 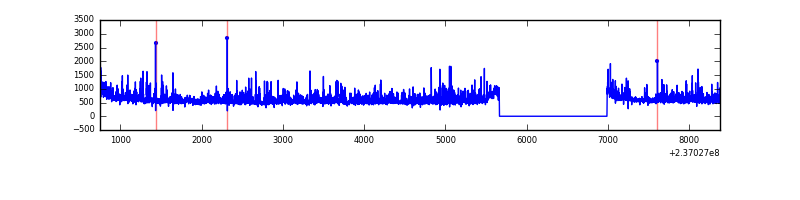 |
| B | 7630 | 6306 | 10 | 10 | 0.13% | 0.16% | 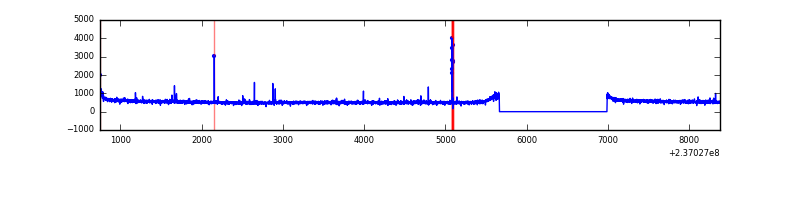 |
| C | 7630 | 6306 | 0 | 0 | 0.00% | 0.00% | 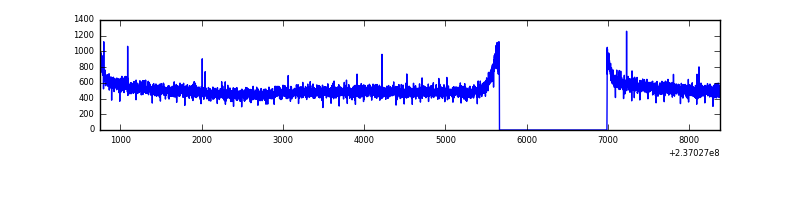 |
| D | 7630 | 6306 | 899 | 899 | 11.78% | 14.26% | 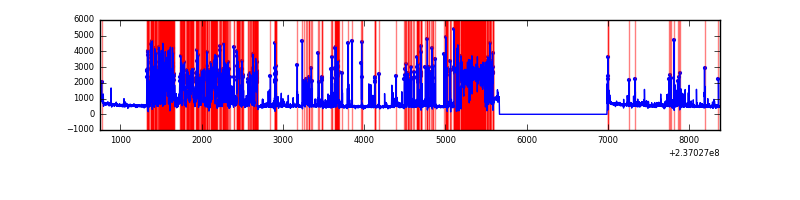 |
Top three noisy pixels from each quadrant. If the there are fewer than three noisy pixels in the level2.evt file, extra rows are filled as -1
| Pixel properties | Quadrant properties | ||||||
|---|---|---|---|---|---|---|---|
| Quadrant | DetID | PixID | Counts | Sigma | Mean | Median | Sigma |
| A | 1 | 162 | 225495 | 1310.04 | 866 | 851 | 171.5 |
| A | 1 | 178 | 119974 | 694.68 | 866 | 851 | 171.5 |
| A | 1 | 161 | 111854 | 647.33 | 866 | 851 | 171.5 |
| B | 10 | 245 | 52204 | 319.24 | 860 | 845 | 160.9 |
| B | 12 | 111 | 17505 | 103.56 | 860 | 845 | 160.9 |
| B | 11 | 111 | 14678 | 85.98 | 860 | 845 | 160.9 |
| C | 13 | 61 | 6292 | 28.98 | 826 | 833 | 188.4 |
| C | 14 | 234 | 2656 | 9.68 | 826 | 833 | 188.4 |
| C | 14 | 67 | 2578 | 9.26 | 826 | 833 | 188.4 |
| D | 1 | 52 | 3043487 | 15307.35 | 772 | 757 | 198.8 |
| D | 10 | 172 | 45058 | 222.87 | 772 | 757 | 198.8 |
| D | 2 | 234 | 38238 | 188.56 | 772 | 757 | 198.8 |
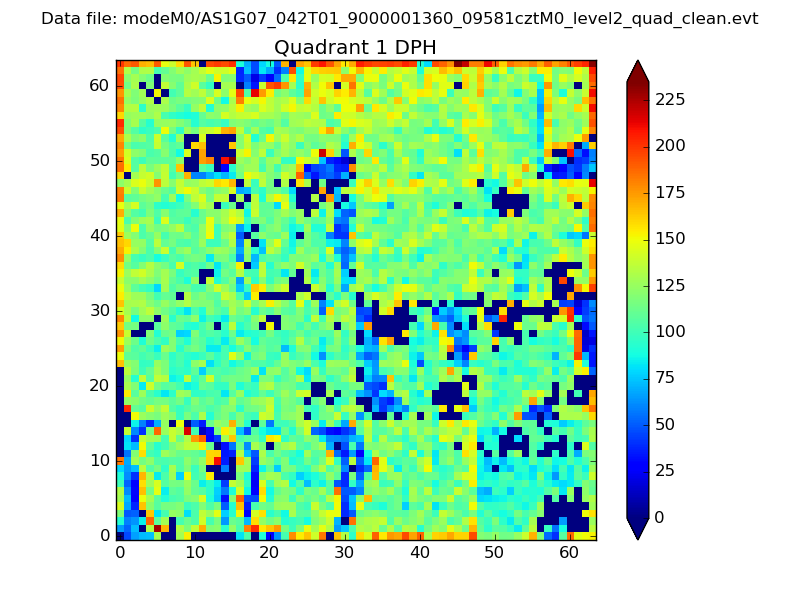
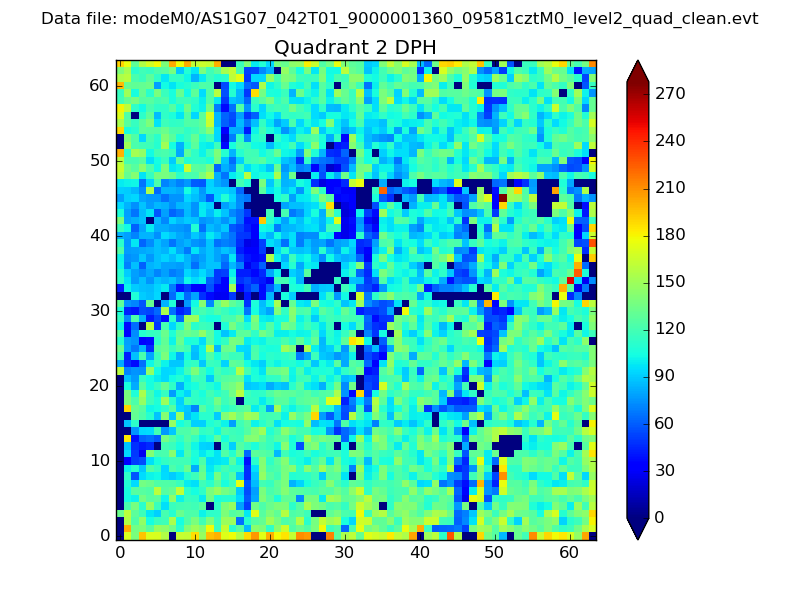
Histogram calculated using DETX and DETY for each event in the final _common_clean file
| Quadrant A |  |
 |
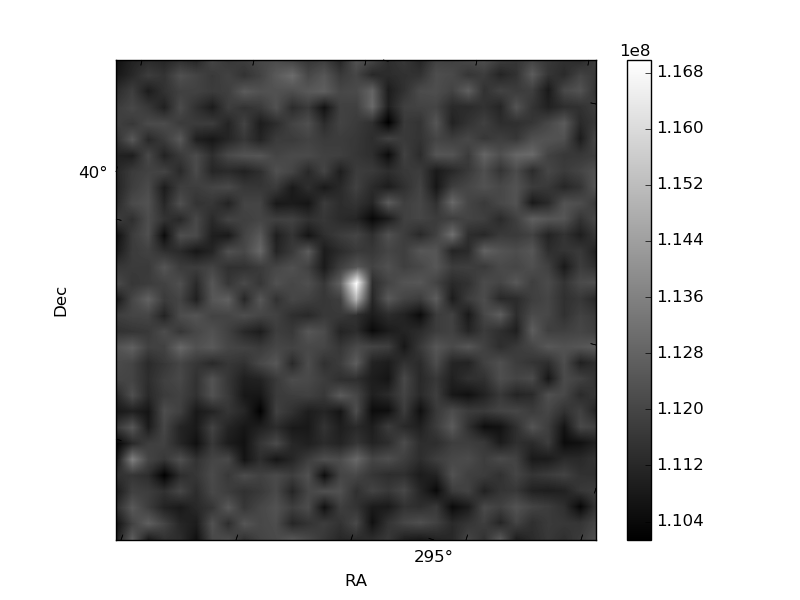
Quadrant B |
|---|---|---|---|
| Quadrant D |  |
 |
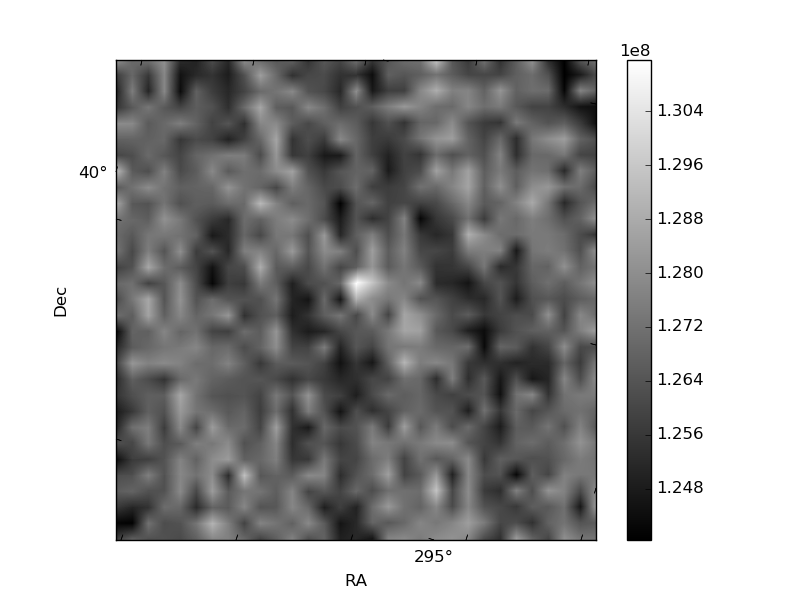
Quadrant C |
| Plot type | Count rate plots | Images |
|---|---|---|
| Comparison with Poisson distribution Blue bars denote a histogram of data divided into 1 sec bins. Red curve is a Poisson curve with rate = median count rate of data. |
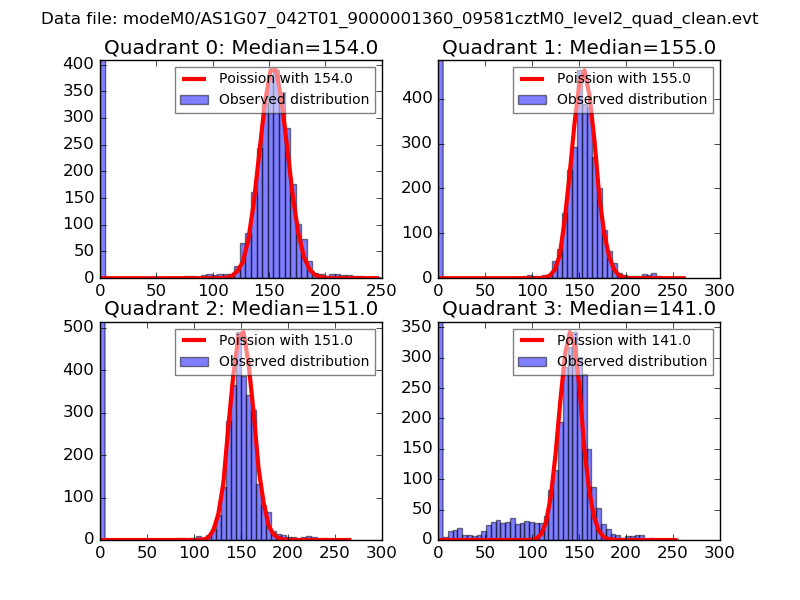 |
 |
| Quadrant-wise count rates Data is divided into 100 sec bins |
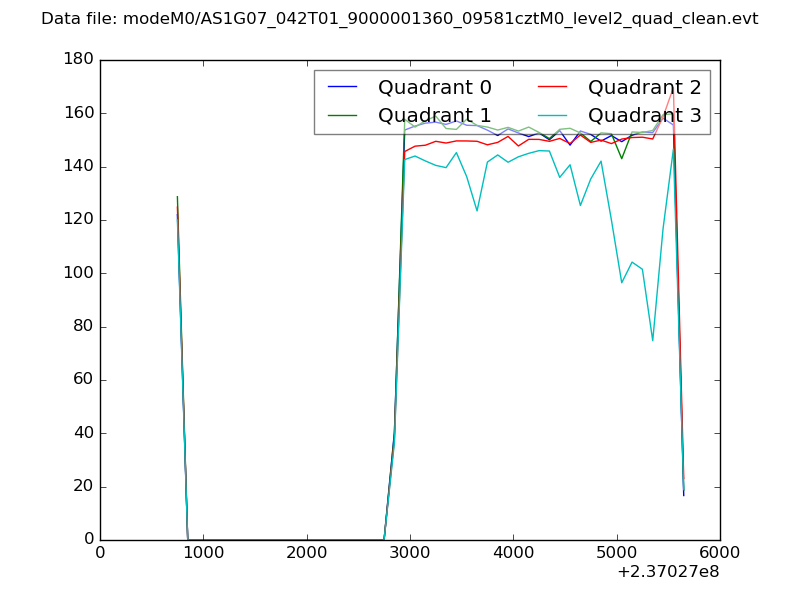 |
|
| Module-wise count rates for Quadrant A Data is divided into 100 sec bins |
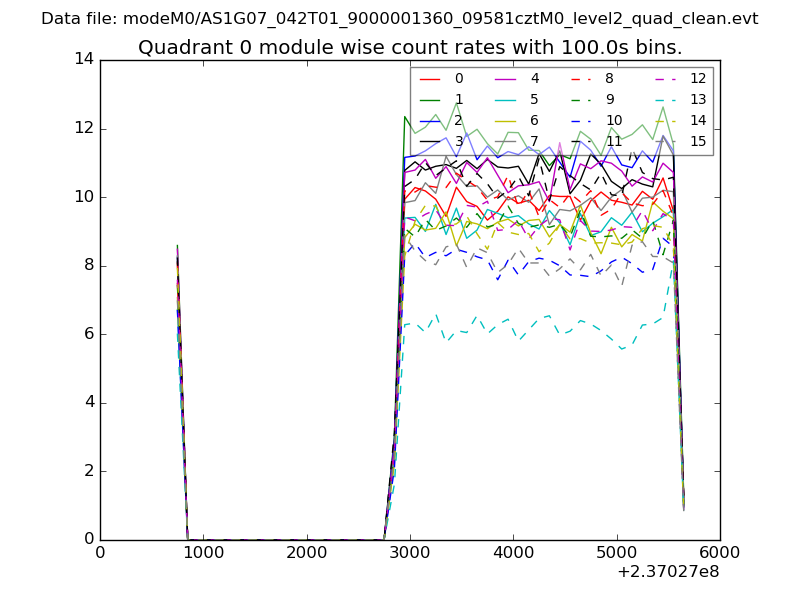 |
 |
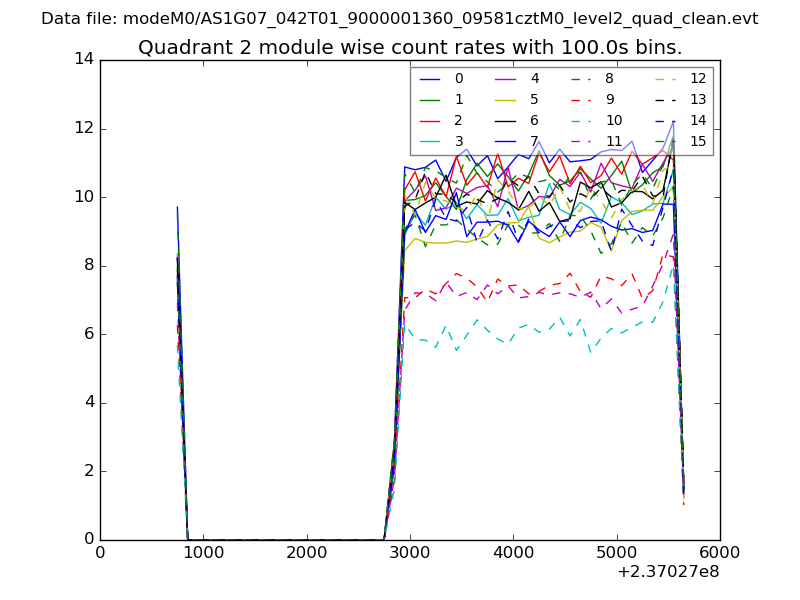
| Module-wise count rates for Quadrant B Data is divided into 100 sec bins |
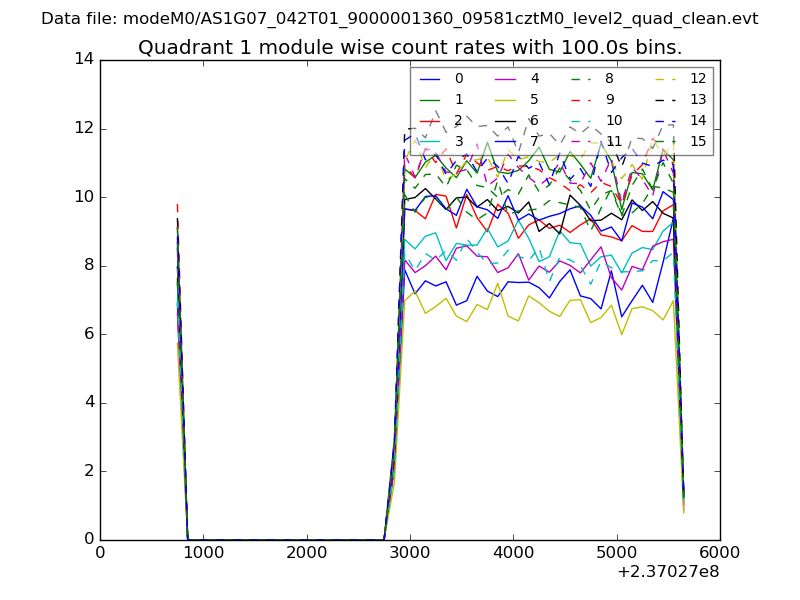 |
 |
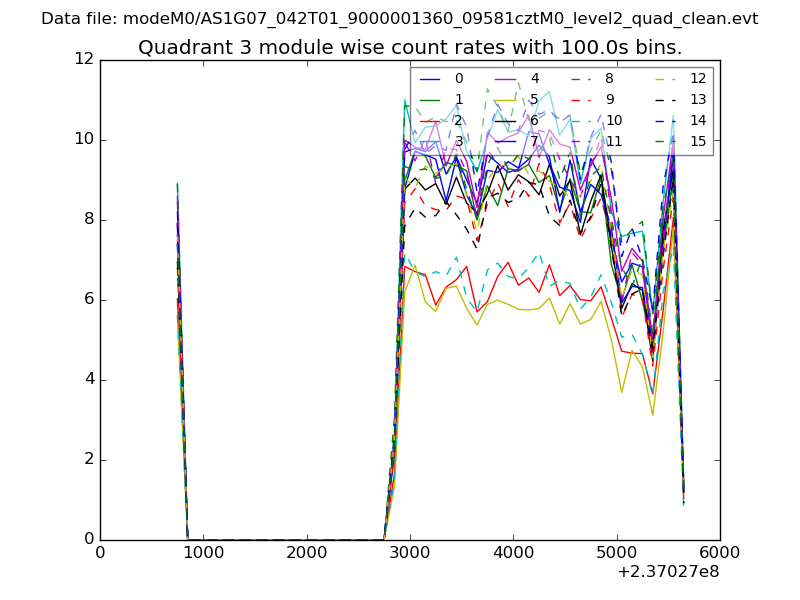
| Module-wise count rates for Quadrant C Data is divided into 100 sec bins |
 |
 |
| Module-wise count rates for Quadrant D Data is divided into 100 sec bins |
 |
 |
| Parameter | Plot |
|---|---|
| CZT HV Monitor | 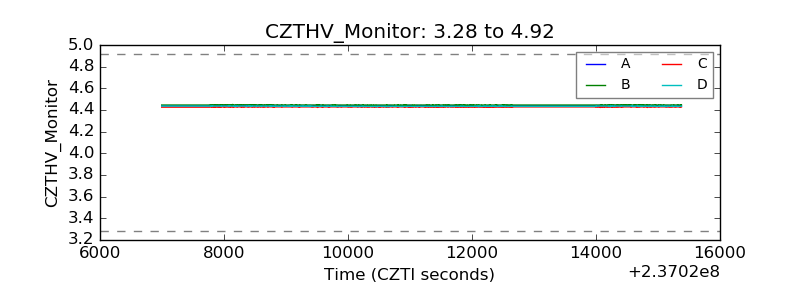 |
| D_VDD | 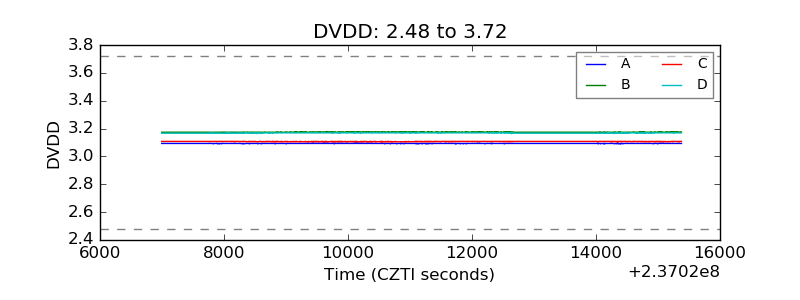 |
| Temperature 1 | 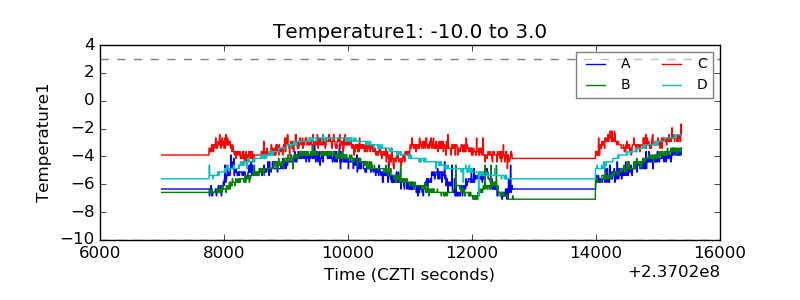 |
| Veto HV Monitor | 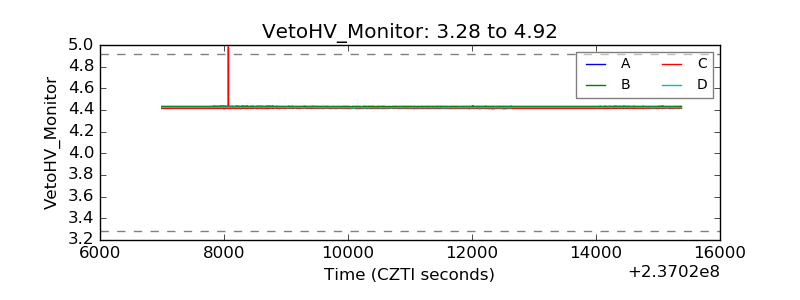 |
| Veto LLD | 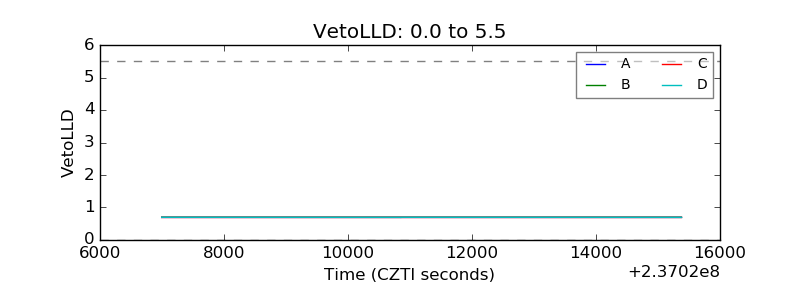 |
| Alpha Counter | 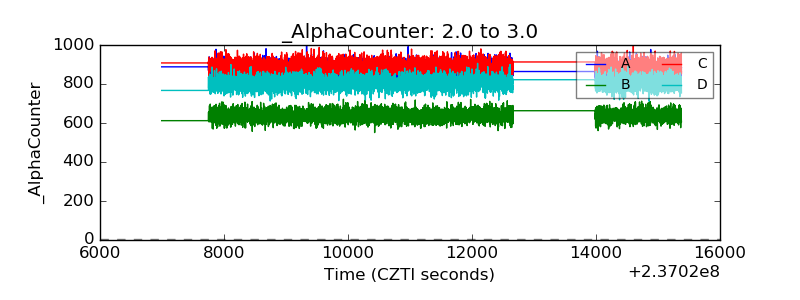 |
| _CPM_Rate | 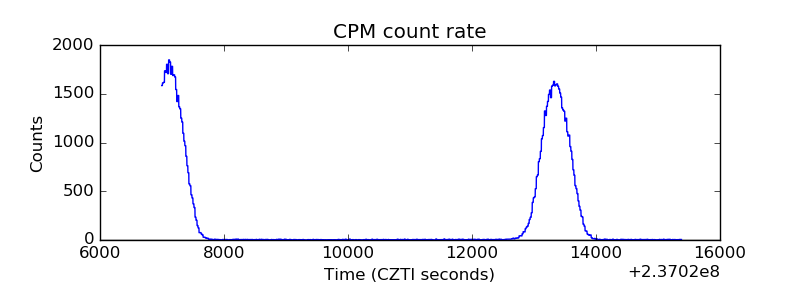 |
| CZT Counter |  |
| +2.5 Volts monitor |  |
| +5 Volts monitor | 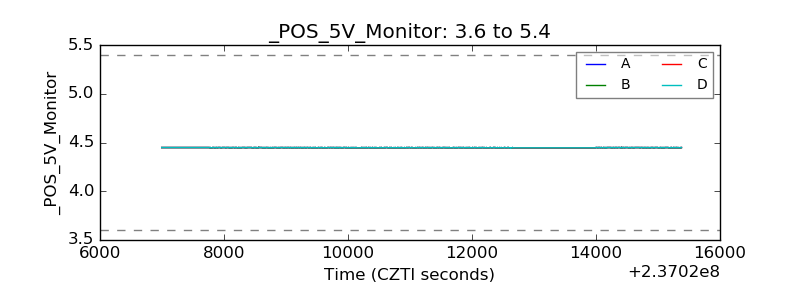 |
| _ROLL_ROT | 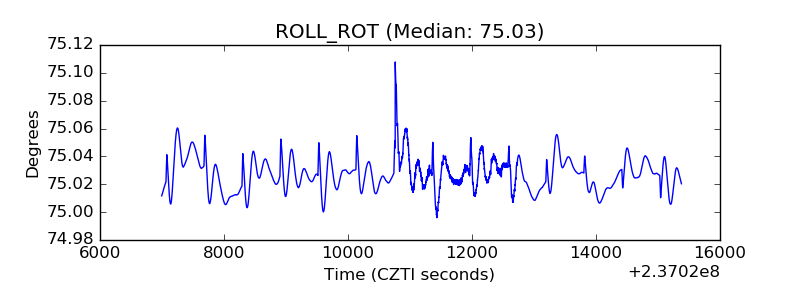 |
| _Roll_DEC | 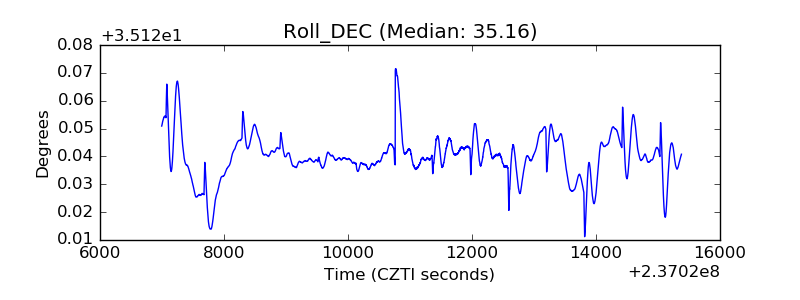 |
| _Roll_RA |  |
| Veto Counter | 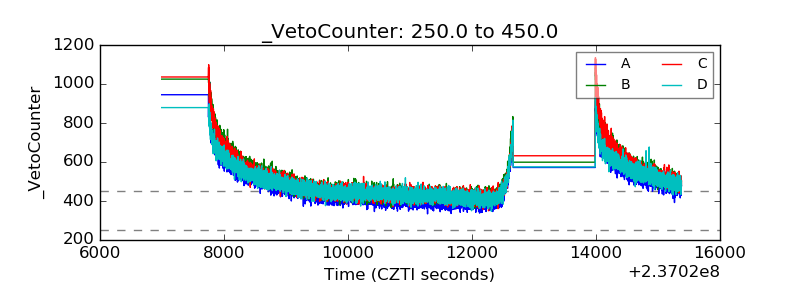 |