| Param | Original file | Final file |
|---|---|---|
| Filename | modeM0/AS1G05_238T01_9000001364_09586cztM0_level2.evt | modeM0/AS1G05_238T01_9000001364_09586cztM0_level2_quad_clean.evt |
| Size (bytes) | 403,015,680 | 46,584,000 |
| Size | 384.3 MB | 44.4 MB |
| Events in quadrant A | 2,493,351 | 290,078 |
| Events in quadrant B | 2,186,890 | 295,343 |
| Events in quadrant C | 1,992,598 | 291,429 |
| Events in quadrant D | 5,245,273 | 236,295 |
| Mode M0 | |||
|---|---|---|---|
| Quadrant | BADHDUFLAG | Total packets | Discarded packets |
| A | 0 | 11543 | 1330 |
| B | 0 | 10413 | 1138 |
| C | 0 | 9869 | 1045 |
| D | 0 | 21670 | 3368 |
| Mode SS | |||
|---|---|---|---|
| Quadrant | BADHDUFLAG | Total packets | Discarded packets |
| A | 0 | 98 | 8 |
| B | 0 | 98 | 10 |
| C | 0 | 98 | 10 |
| D | 0 | 97 | 17 |
| Mode M9 | |||
|---|---|---|---|
| Quadrant | BADHDUFLAG | Total packets | Discarded packets |
| A | 0 | 3 | 0 |
| B | 0 | 3 | 0 |
| C | 0 | 3 | 0 |
| D | 0 | 3 | 0 |
| Quadrant | Total seconds | Saturated seconds | Saturation percentage |
|---|---|---|---|
| A | 4234 | 96 | 2.267359% |
| B | 4260 | 68 | 1.596244% |
| C | 4305 | 19 | 0.441347% |
| D | 4025 | 1201 | 29.838509% |
Noise dominated data is calculated using 1-second bins in cleaned event files. If a bin has >2000 counts, and if more than 50% of those come from <1% of pixels, then it is considered to be noise-dominated and hence unusable.
| Quadrant | # 1 sec bins | Bins with >0 counts | Bins with >2000 counts | High rate bins dominated by noise | Noise dominated (total time) | Noise dominated (detector-on time) | Marked lightcurve |
|---|---|---|---|---|---|---|---|
| A | 5138 | 4589 | 1 | 1 | 0.02% | 0.02% | 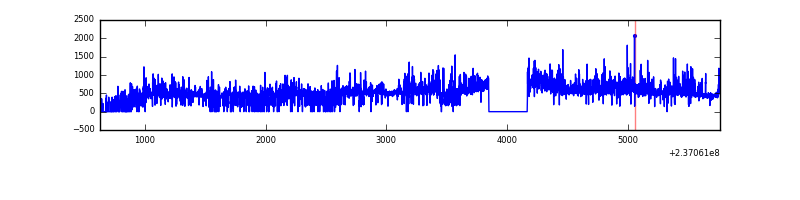 |
| B | 5134 | 4622 | 6 | 6 | 0.12% | 0.13% | 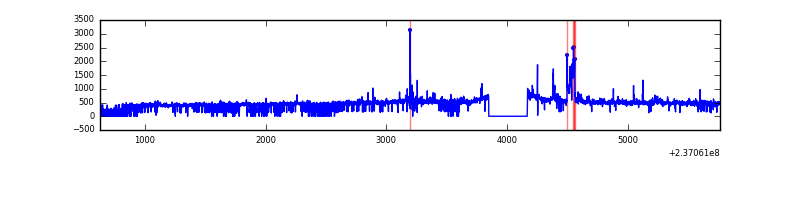 |
| C | 5137 | 4633 | 0 | 0 | 0.00% | 0.00% | 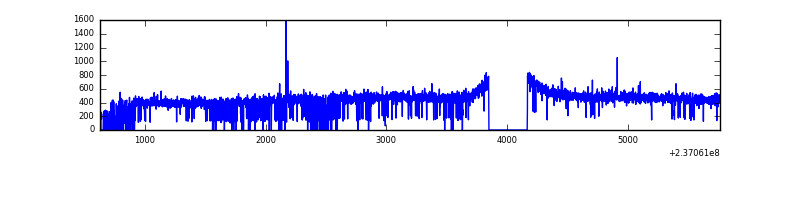 |
| D | 5140 | 4456 | 899 | 899 | 17.49% | 20.18% | 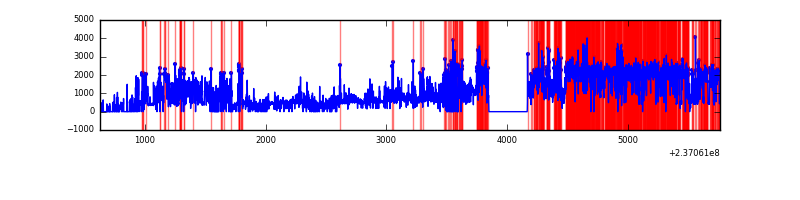 |
Top three noisy pixels from each quadrant. If the there are fewer than three noisy pixels in the level2.evt file, extra rows are filled as -1
| Pixel properties | Quadrant properties | ||||||
|---|---|---|---|---|---|---|---|
| Quadrant | DetID | PixID | Counts | Sigma | Mean | Median | Sigma |
| A | 1 | 162 | 190011 | 1783.86 | 518 | 507 | 106.2 |
| A | 1 | 178 | 104881 | 982.51 | 518 | 507 | 106.2 |
| A | 1 | 161 | 96480 | 903.42 | 518 | 507 | 106.2 |
| B | 15 | 85 | 80735 | 791.36 | 522 | 508 | 101.4 |
| B | 0 | 214 | 22410 | 216.04 | 522 | 508 | 101.4 |
| B | 4 | 80 | 17325 | 165.88 | 522 | 508 | 101.4 |
| C | 13 | 61 | 3934 | 28.36 | 509 | 511 | 120.7 |
| C | 14 | 225 | 3571 | 25.35 | 509 | 511 | 120.7 |
| C | 8 | 222 | 2104 | 13.2 | 509 | 511 | 120.7 |
| D | 1 | 52 | 3486346 | 32562.13 | 434 | 423 | 107.1 |
| D | 8 | 195 | 77346 | 718.54 | 434 | 423 | 107.1 |
| D | 12 | 227 | 24104 | 221.21 | 434 | 423 | 107.1 |
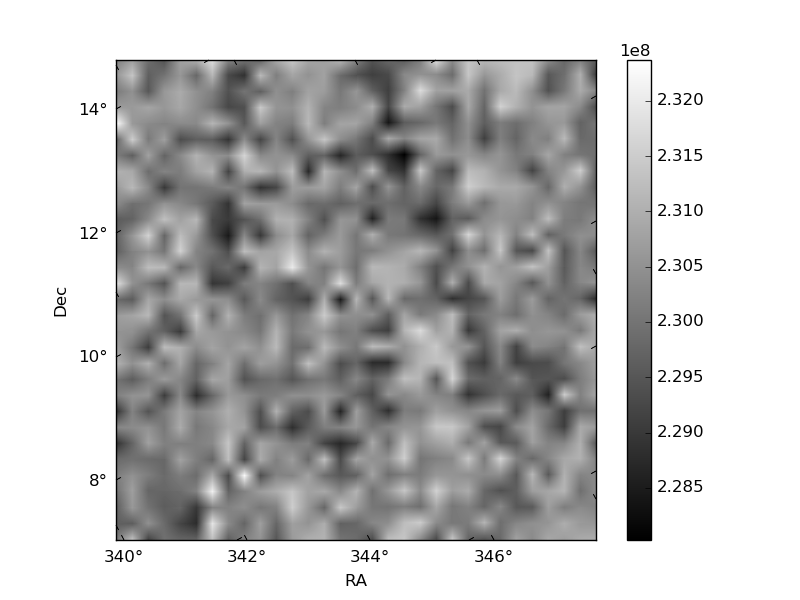
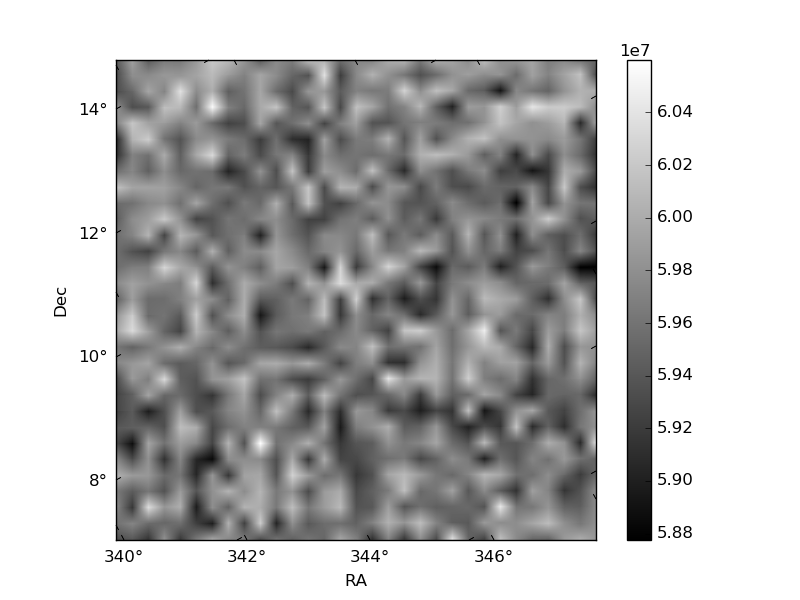
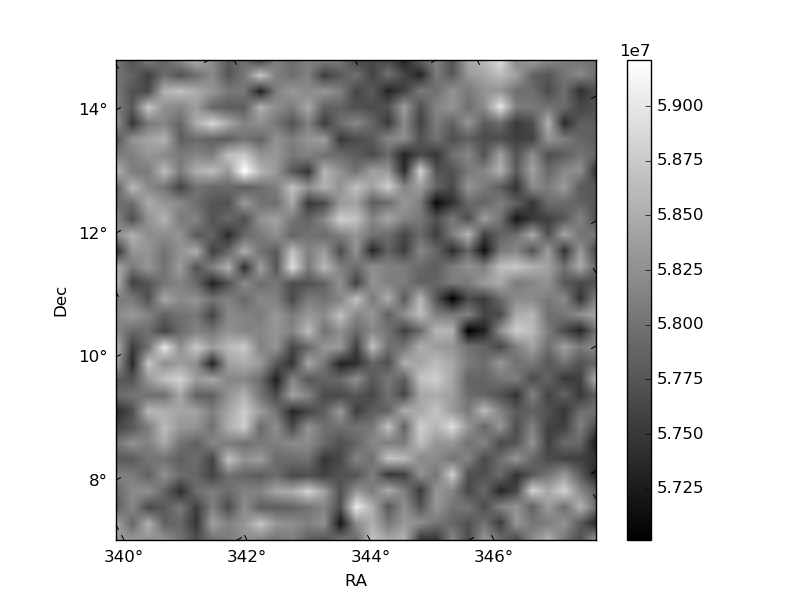
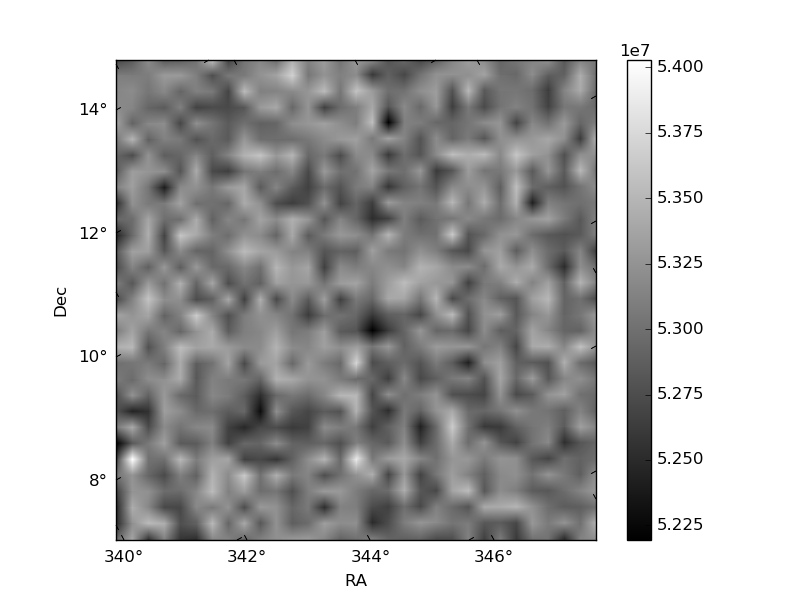
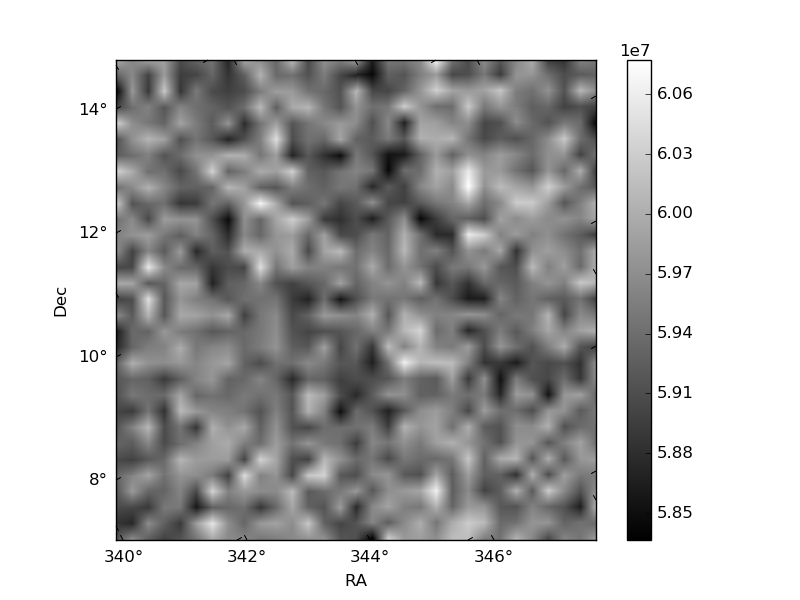
Histogram calculated using DETX and DETY for each event in the final _common_clean file
| Quadrant A | 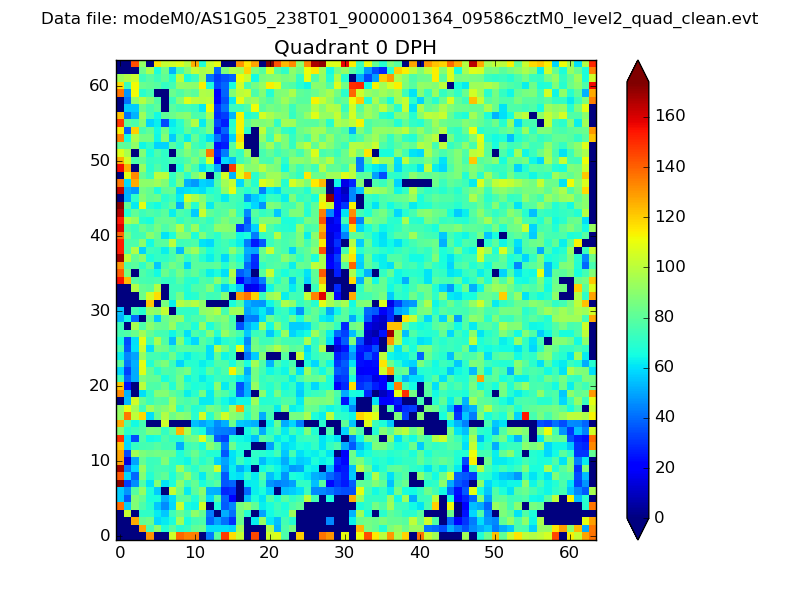 |
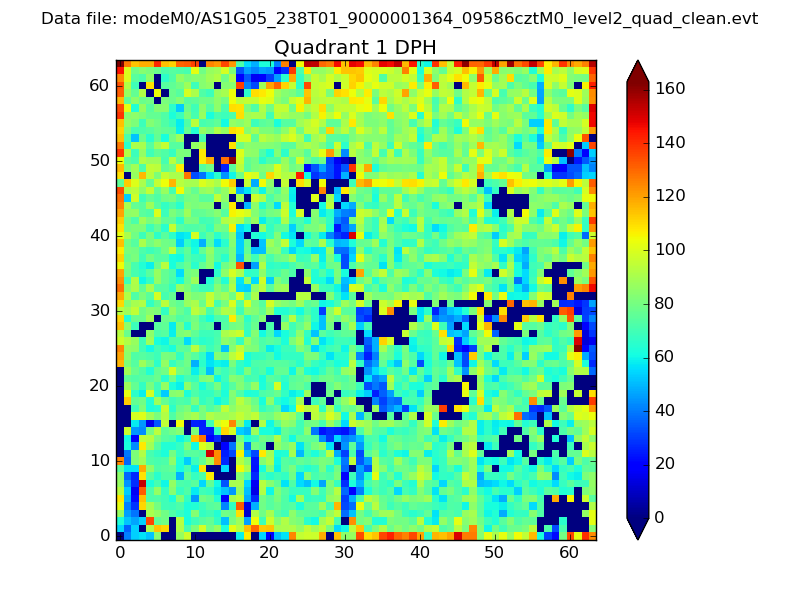 |
Quadrant B |
|---|---|---|---|
| Quadrant D | 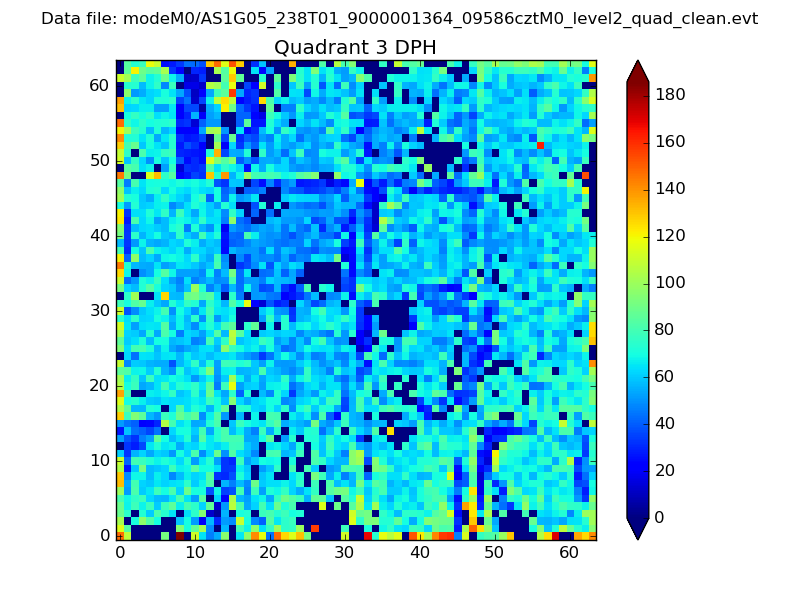 |
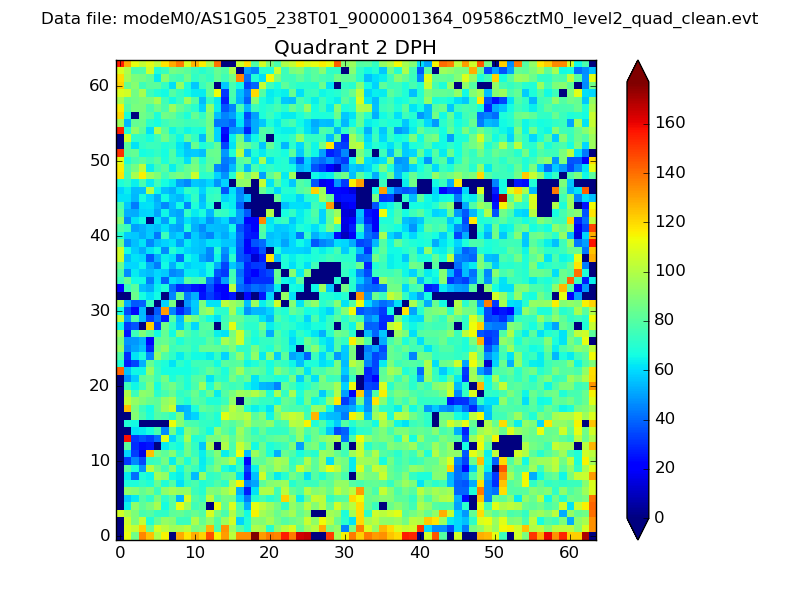 |
Quadrant C |
| Plot type | Count rate plots | Images |
|---|---|---|
| Comparison with Poisson distribution Blue bars denote a histogram of data divided into 1 sec bins. Red curve is a Poisson curve with rate = median count rate of data. |
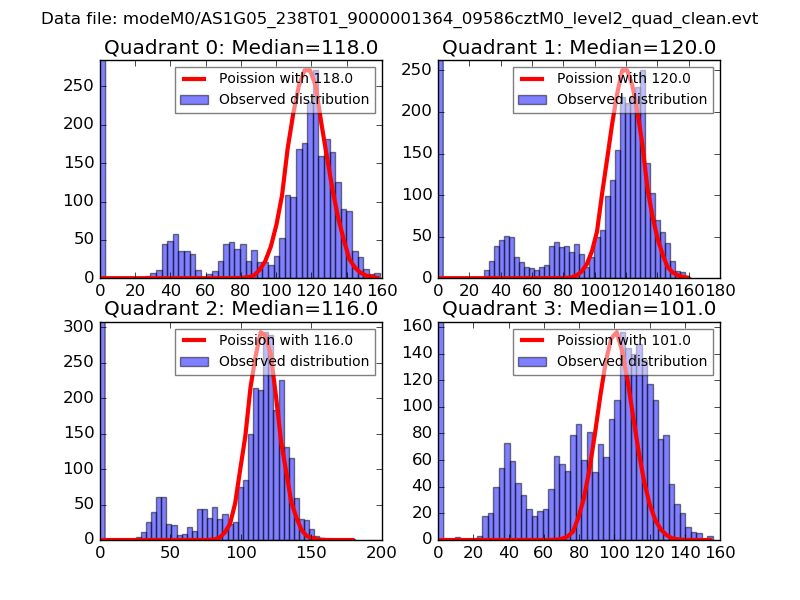 |
 |
| Quadrant-wise count rates Data is divided into 100 sec bins |
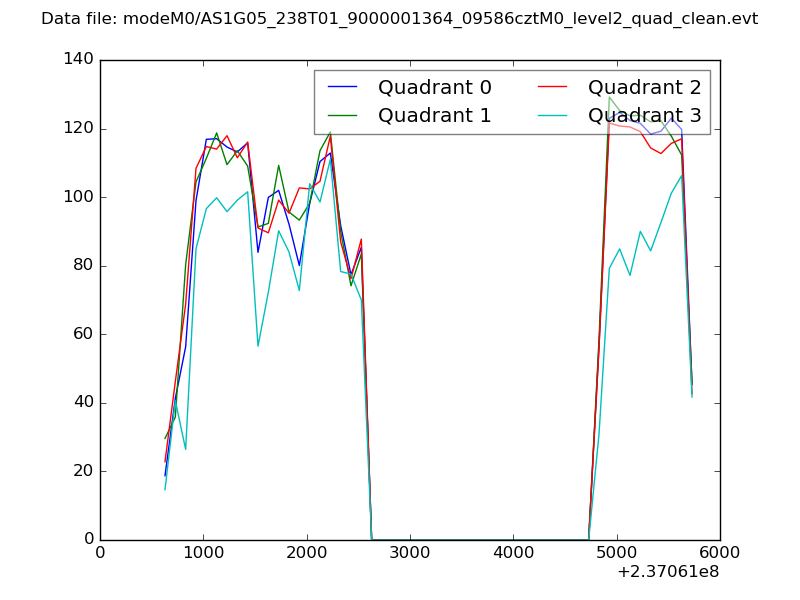 |
|
| Module-wise count rates for Quadrant A Data is divided into 100 sec bins |
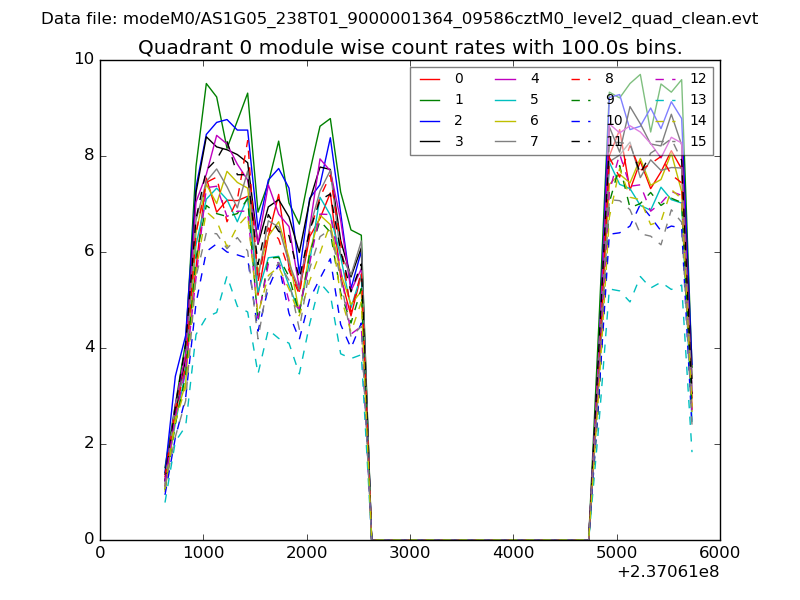 |
 |
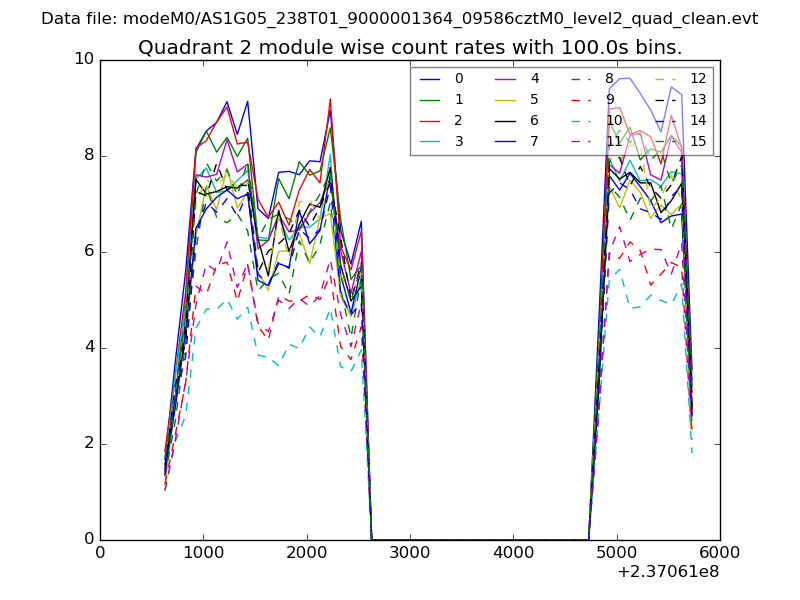
| Module-wise count rates for Quadrant B Data is divided into 100 sec bins |
 |
 |
| Module-wise count rates for Quadrant C Data is divided into 100 sec bins |
 |
 |
| Module-wise count rates for Quadrant D Data is divided into 100 sec bins |
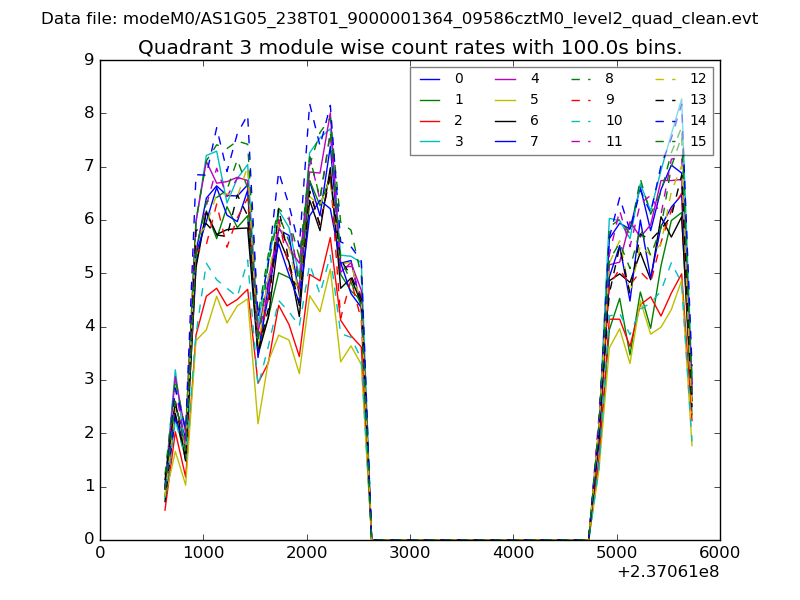 |
 |
| Parameter | Plot |
|---|---|
| CZT HV Monitor | 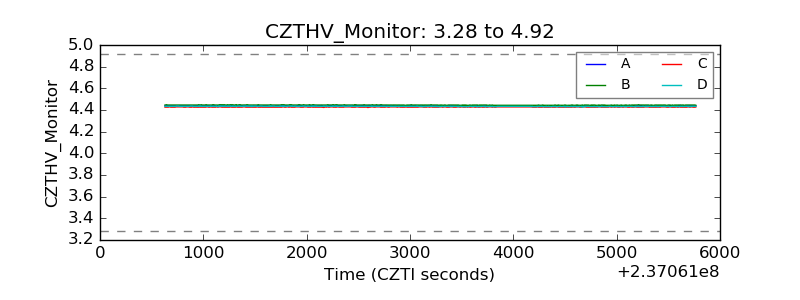 |
| D_VDD | 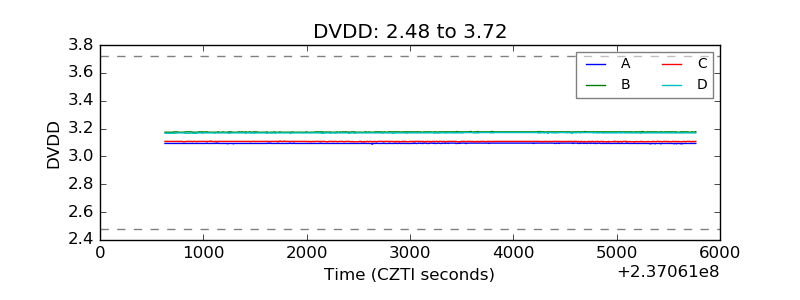 |
| Temperature 1 | 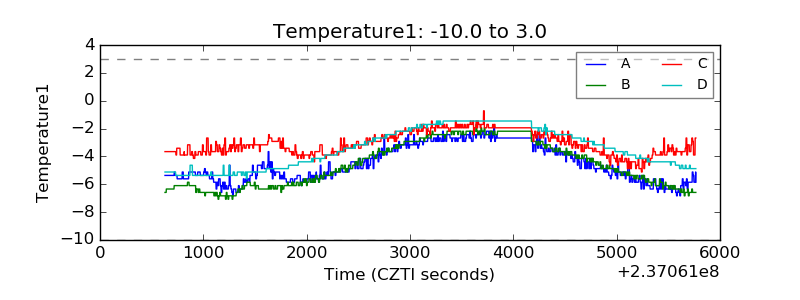 |
| Veto HV Monitor | 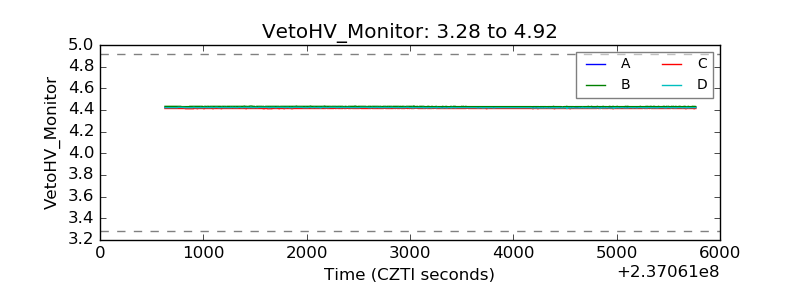 |
| Veto LLD | 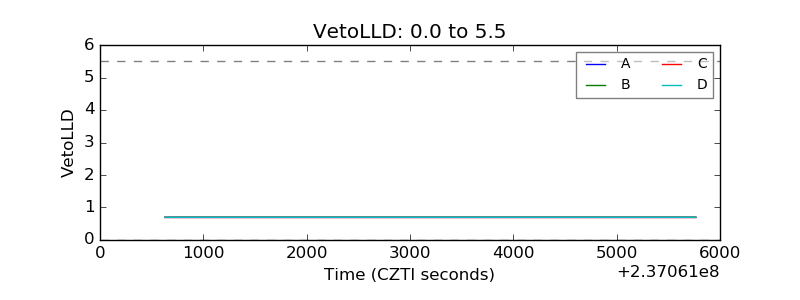 |
| Alpha Counter | 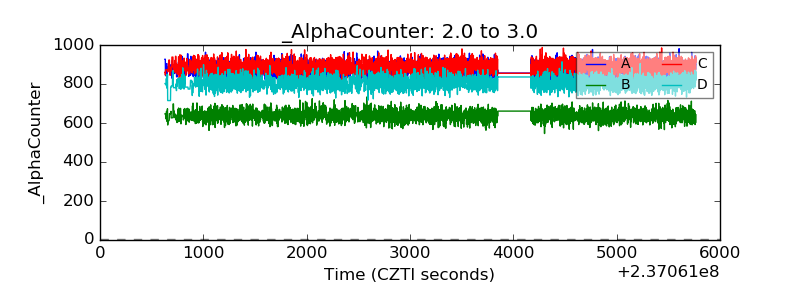 |
| _CPM_Rate | 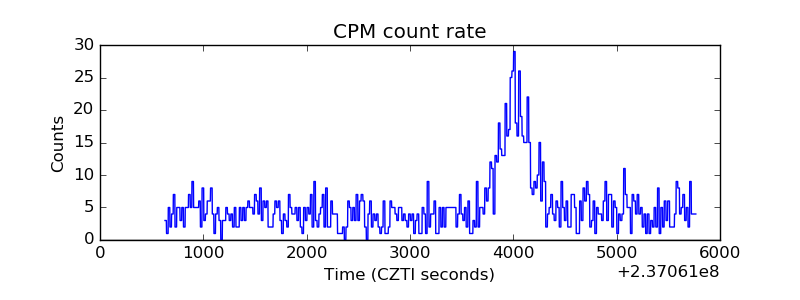 |
| CZT Counter | 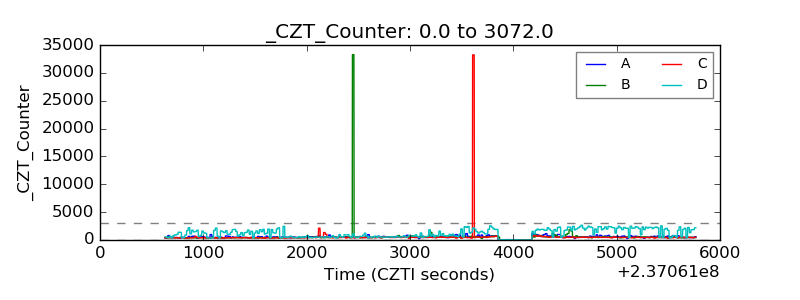 |
| +2.5 Volts monitor |  |
| +5 Volts monitor |  |
| _ROLL_ROT | 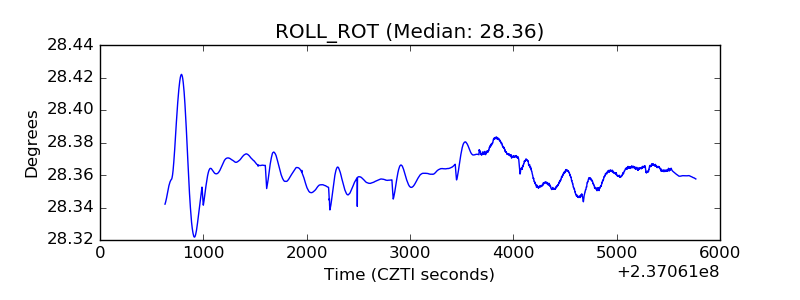 |
| _Roll_DEC | 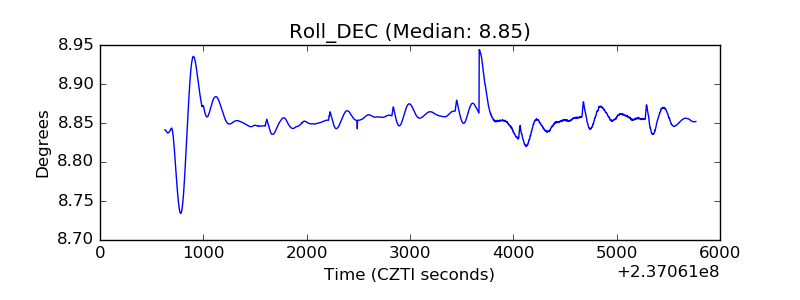 |
| _Roll_RA | 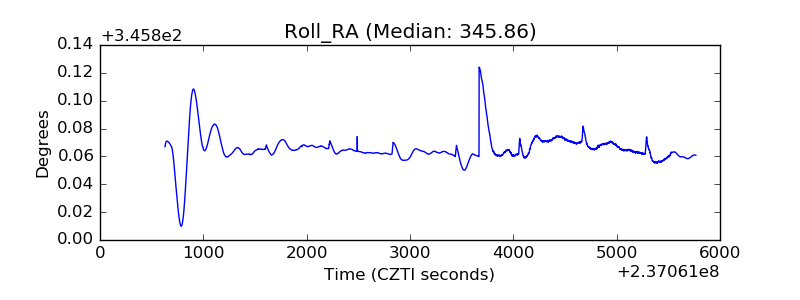 |
| Veto Counter | 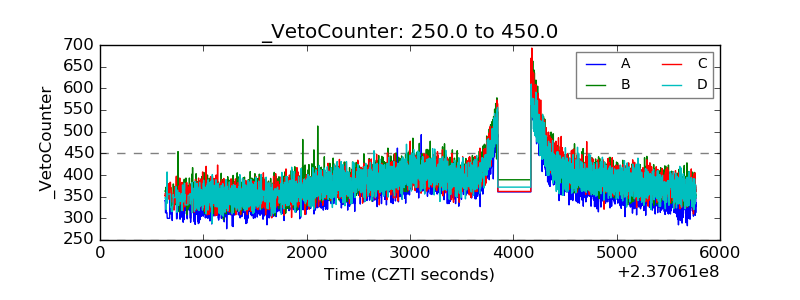 |