| Param | Original file | Final file |
|---|---|---|
| Filename | modeM0/AS1G05_238T01_9000001364_09587cztM0_level2.evt | modeM0/AS1G05_238T01_9000001364_09587cztM0_level2_quad_clean.evt |
| Size (bytes) | 746,562,240 | 86,209,920 |
| Size | 712.0 MB | 82.2 MB |
| Events in quadrant A | 4,284,819 | 553,645 |
| Events in quadrant B | 3,628,612 | 559,909 |
| Events in quadrant C | 3,290,879 | 543,161 |
| Events in quadrant D | 10,923,725 | 457,721 |
| Mode M0 | |||
|---|---|---|---|
| Quadrant | BADHDUFLAG | Total packets | Discarded packets |
| A | 0 | 18388 | 790 |
| B | 0 | 16175 | 597 |
| C | 0 | 15292 | 636 |
| D | 0 | 40306 | 3085 |
| Mode SS | |||
|---|---|---|---|
| Quadrant | BADHDUFLAG | Total packets | Discarded packets |
| A | 0 | 152 | 8 |
| B | 0 | 152 | 10 |
| C | 0 | 153 | 5 |
| D | 0 | 152 | 10 |
| Mode M9 | |||
|---|---|---|---|
| Quadrant | BADHDUFLAG | Total packets | Discarded packets |
| A | 0 | 3 | 0 |
| B | 0 | 3 | 0 |
| C | 0 | 3 | 0 |
| D | 0 | 3 | 0 |
| Quadrant | Total seconds | Saturated seconds | Saturation percentage |
|---|---|---|---|
| A | 7154 | 208 | 2.907464% |
| B | 7190 | 126 | 1.752434% |
| C | 7167 | 48 | 0.669736% |
| D | 6953 | 2829 | 40.687473% |
Noise dominated data is calculated using 1-second bins in cleaned event files. If a bin has >2000 counts, and if more than 50% of those come from <1% of pixels, then it is considered to be noise-dominated and hence unusable.
| Quadrant | # 1 sec bins | Bins with >0 counts | Bins with >2000 counts | High rate bins dominated by noise | Noise dominated (total time) | Noise dominated (detector-on time) | Marked lightcurve |
|---|---|---|---|---|---|---|---|
| A | 7753 | 7339 | 8 | 8 | 0.10% | 0.11% | 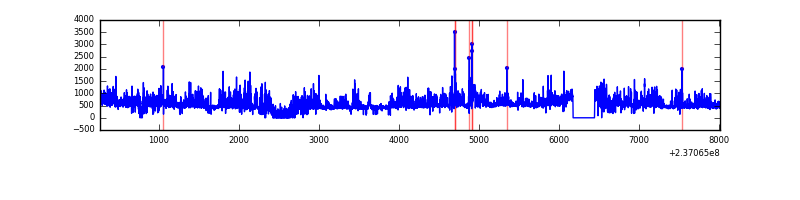 |
| B | 7753 | 7369 | 6 | 6 | 0.08% | 0.08% | 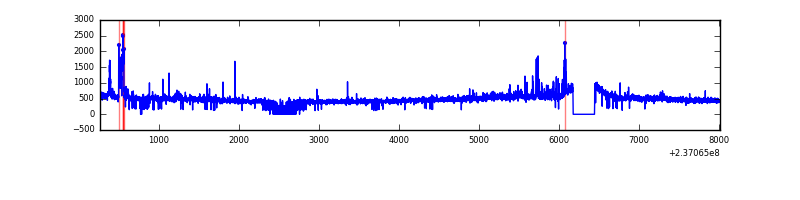 |
| C | 7753 | 7333 | 0 | 0 | 0.00% | 0.00% |  |
| D | 7753 | 7219 | 2248 | 2248 | 29.00% | 31.14% | 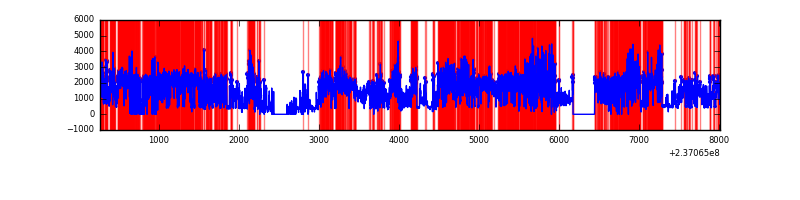 |
Top three noisy pixels from each quadrant. If the there are fewer than three noisy pixels in the level2.evt file, extra rows are filled as -1
| Pixel properties | Quadrant properties | ||||||
|---|---|---|---|---|---|---|---|
| Quadrant | DetID | PixID | Counts | Sigma | Mean | Median | Sigma |
| A | 1 | 162 | 370314 | 2099.13 | 862 | 845 | 176.0 |
| A | 1 | 178 | 202704 | 1146.86 | 862 | 845 | 176.0 |
| A | 1 | 161 | 189526 | 1071.99 | 862 | 845 | 176.0 |
| B | 15 | 85 | 81755 | 479.1 | 873 | 850 | 168.9 |
| B | 4 | 80 | 77085 | 451.45 | 873 | 850 | 168.9 |
| B | 0 | 214 | 28824 | 165.66 | 873 | 850 | 168.9 |
| C | 13 | 61 | 6213 | 27.05 | 843 | 847 | 198.4 |
| C | 9 | 68 | 3394 | 12.84 | 843 | 847 | 198.4 |
| C | 3 | 202 | 2114 | 6.39 | 843 | 847 | 198.4 |
| D | 1 | 52 | 8036426 | 46359.05 | 709 | 691 | 173.3 |
| D | 8 | 195 | 113848 | 652.82 | 709 | 691 | 173.3 |
| D | 10 | 199 | 30605 | 172.58 | 709 | 691 | 173.3 |
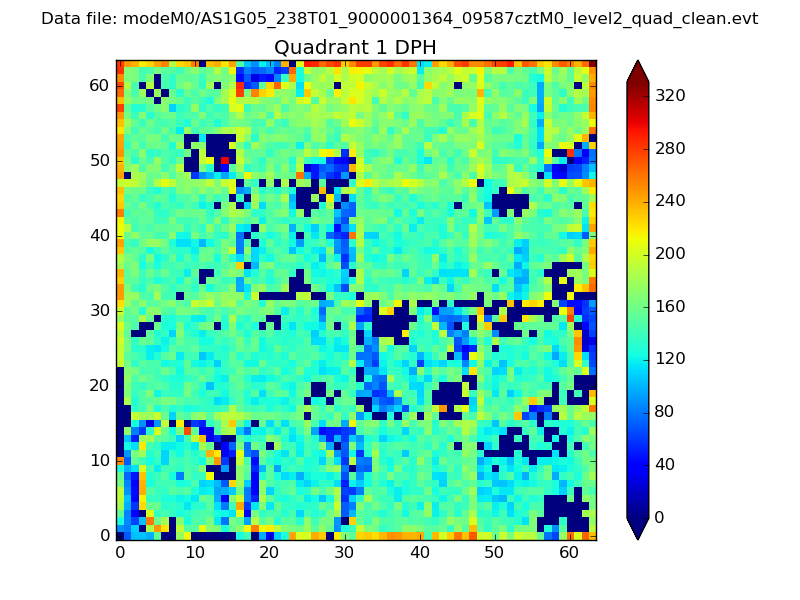
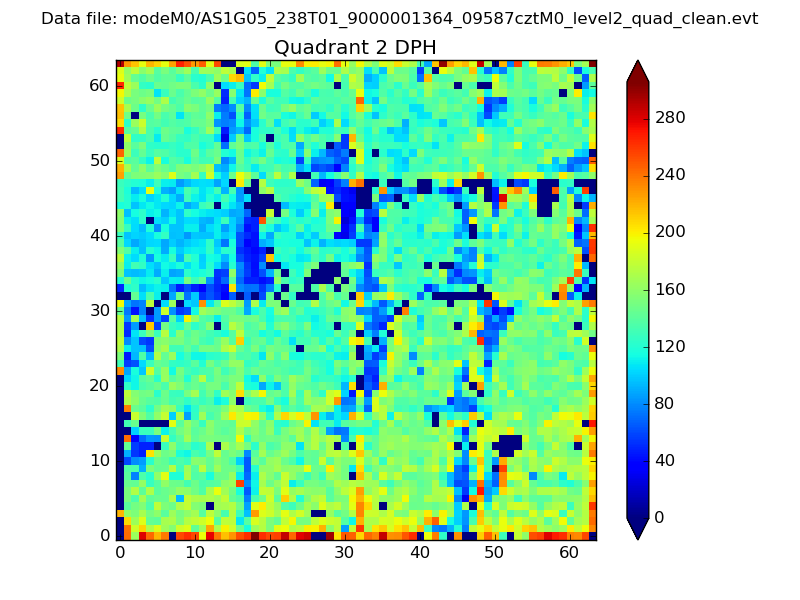
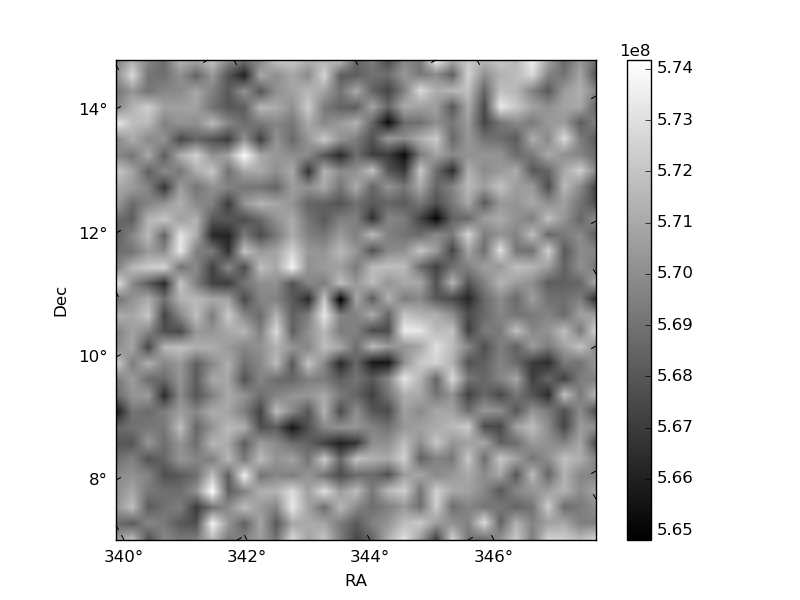
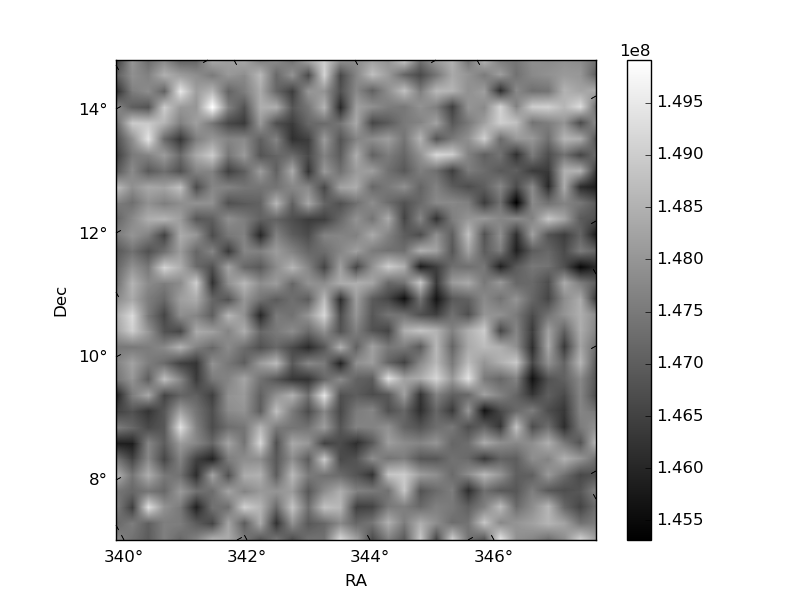
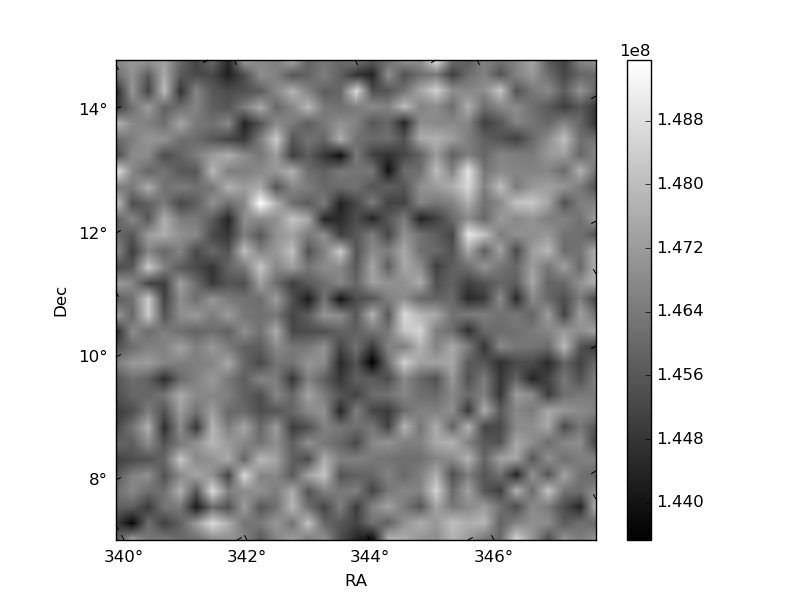
Histogram calculated using DETX and DETY for each event in the final _common_clean file
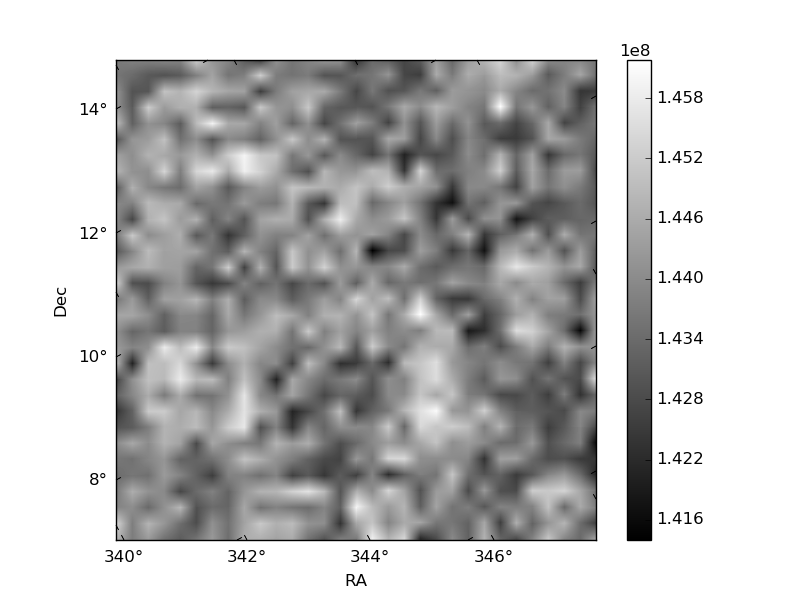
| Quadrant A | 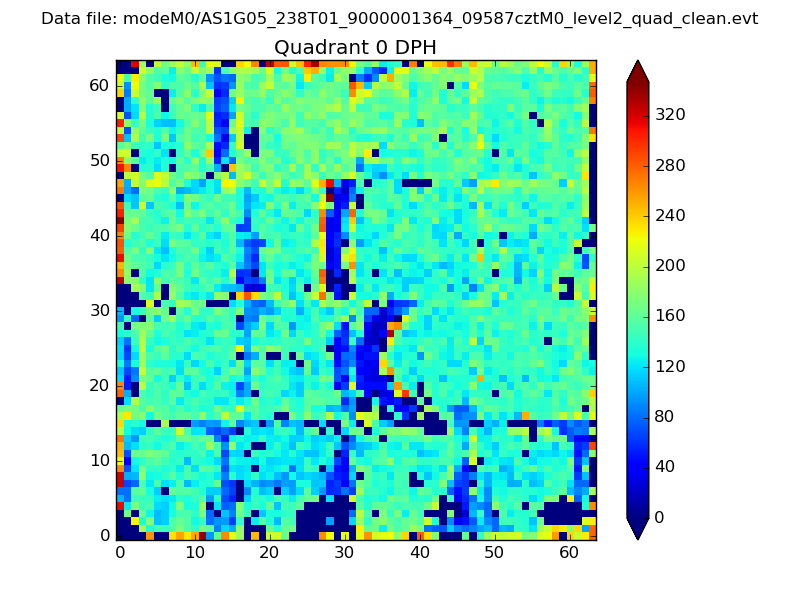 |
 |
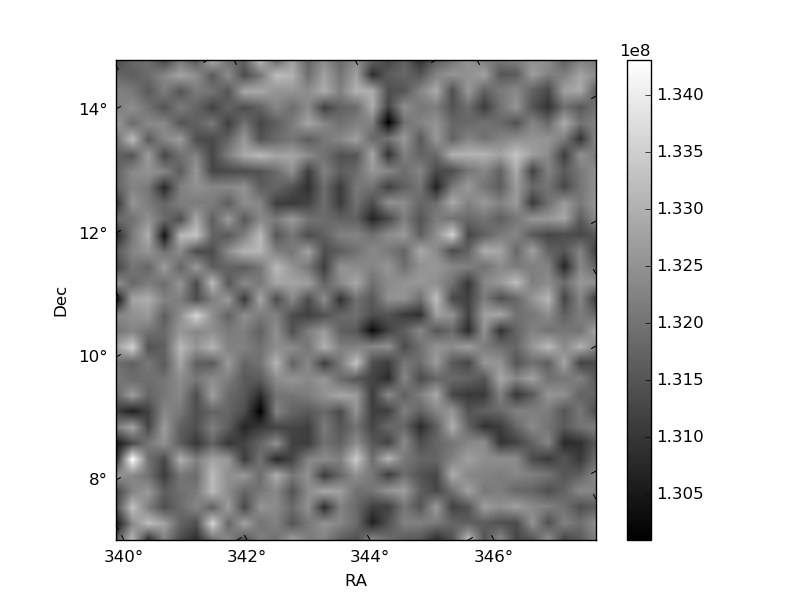
Quadrant B |
|---|---|---|---|
| Quadrant D | 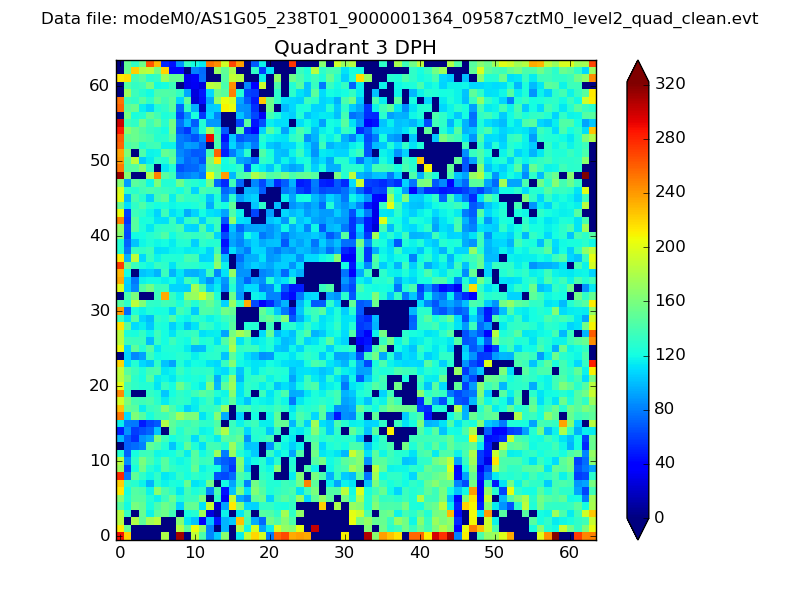 |
 |
Quadrant C |
| Plot type | Count rate plots | Images |
|---|---|---|
| Comparison with Poisson distribution Blue bars denote a histogram of data divided into 1 sec bins. Red curve is a Poisson curve with rate = median count rate of data. |
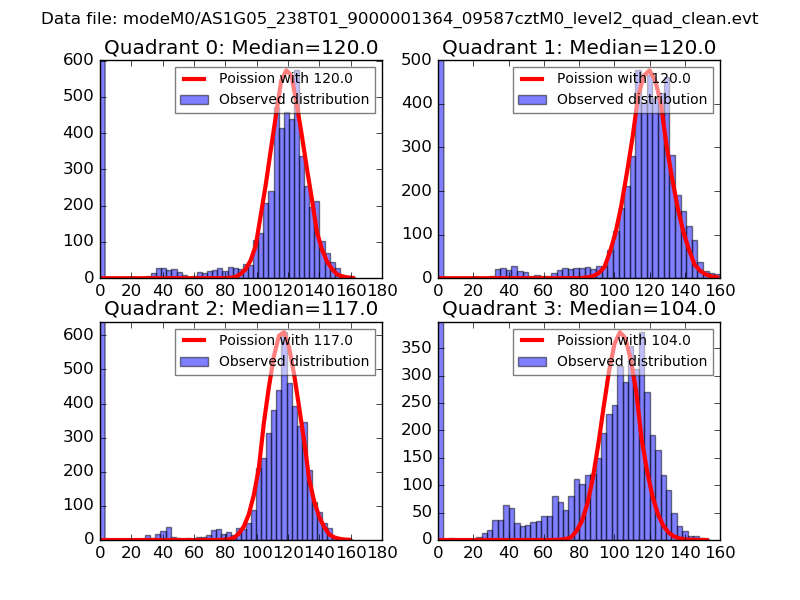 |
 |
| Quadrant-wise count rates Data is divided into 100 sec bins |
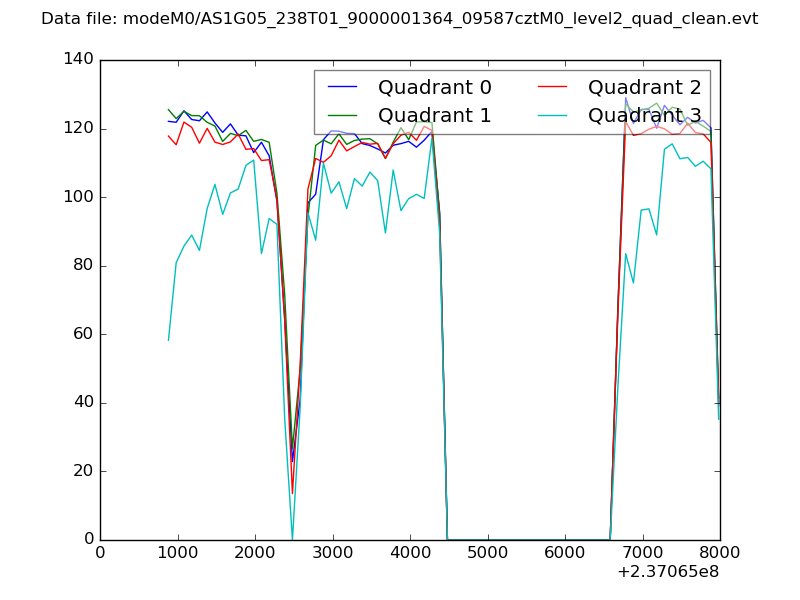 |
|
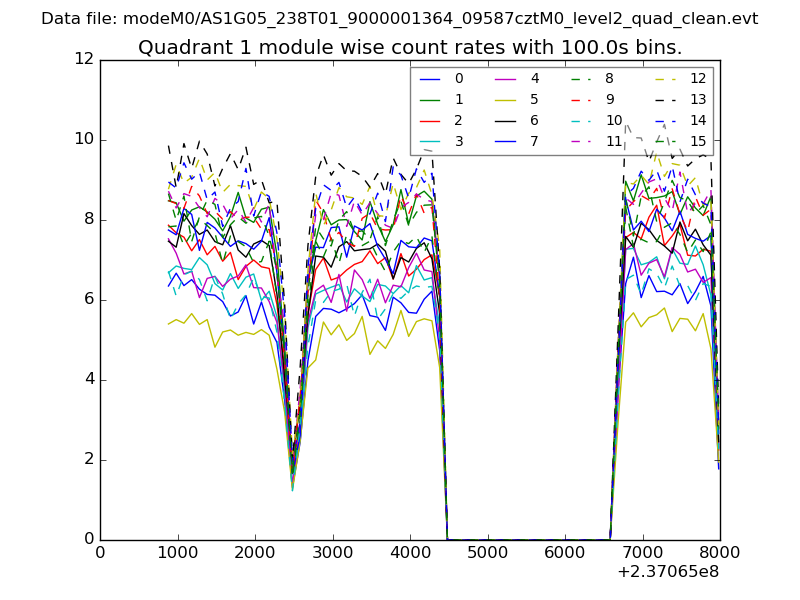
| Module-wise count rates for Quadrant A Data is divided into 100 sec bins |
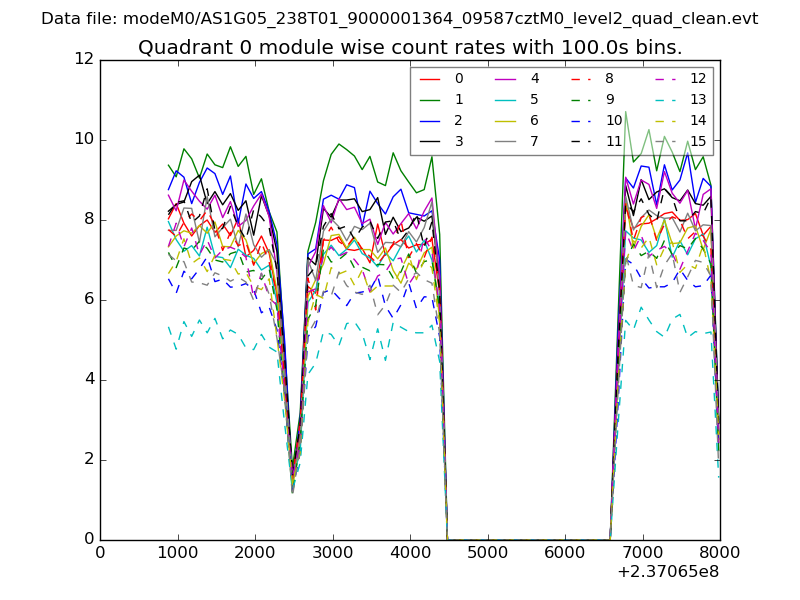 |
 |
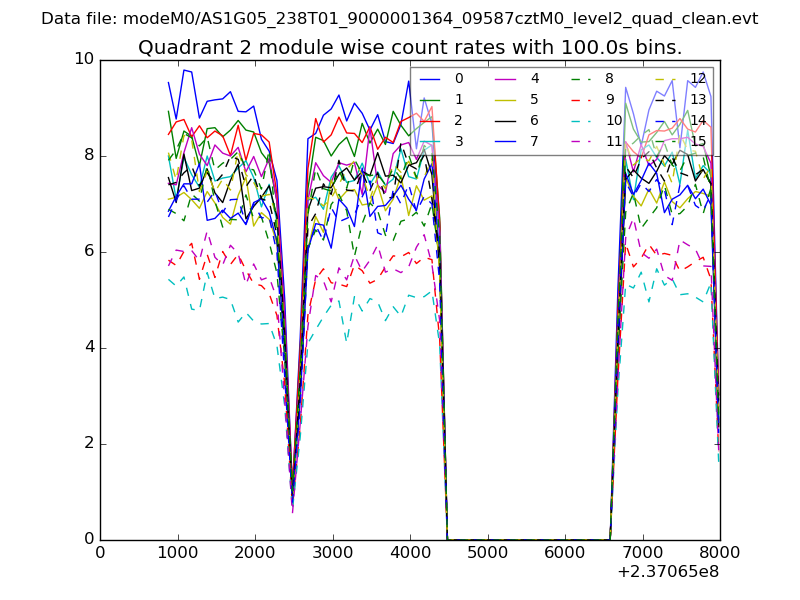
| Module-wise count rates for Quadrant B Data is divided into 100 sec bins |
 |
 |
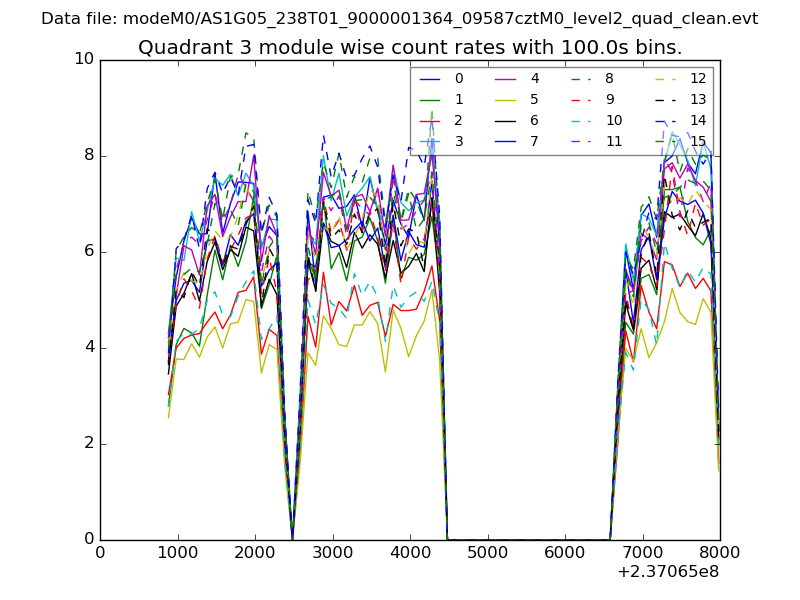
| Module-wise count rates for Quadrant C Data is divided into 100 sec bins |
 |
 |
| Module-wise count rates for Quadrant D Data is divided into 100 sec bins |
 |
 |
| Parameter | Plot |
|---|---|
| CZT HV Monitor | 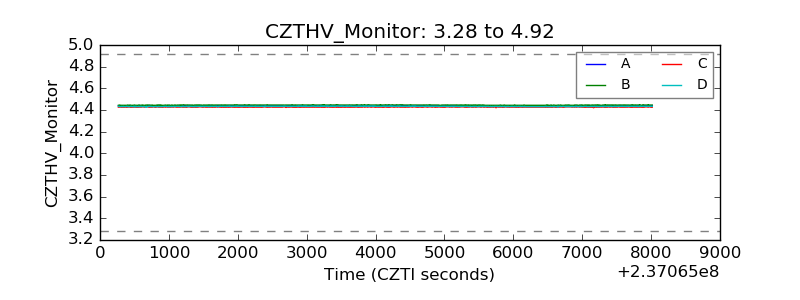 |
| D_VDD | 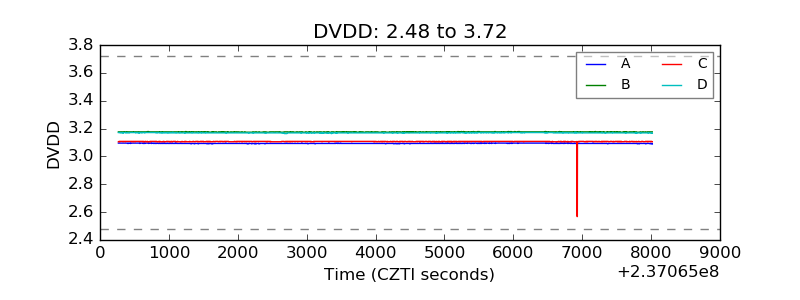 |
| Temperature 1 | 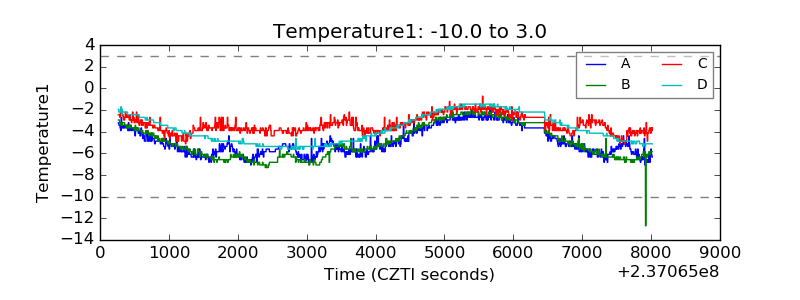 |
| Veto HV Monitor |  |
| Veto LLD | 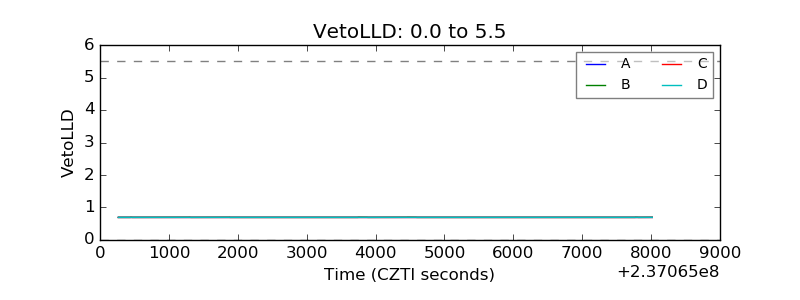 |
| Alpha Counter | 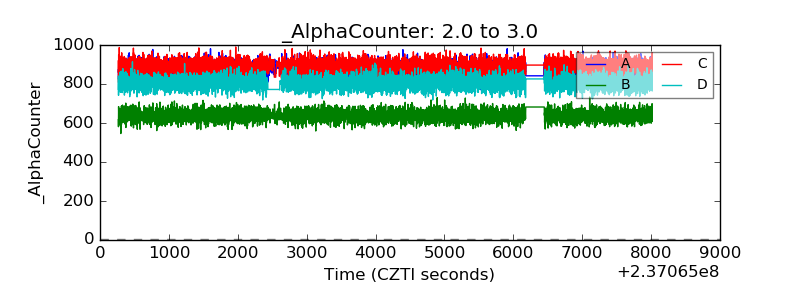 |
| _CPM_Rate | 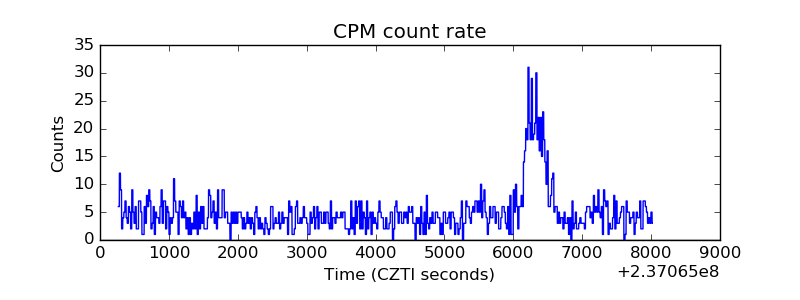 |
| CZT Counter | 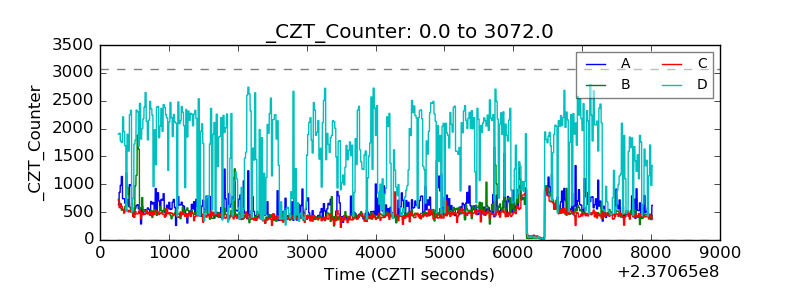 |
| +2.5 Volts monitor |  |
| +5 Volts monitor | 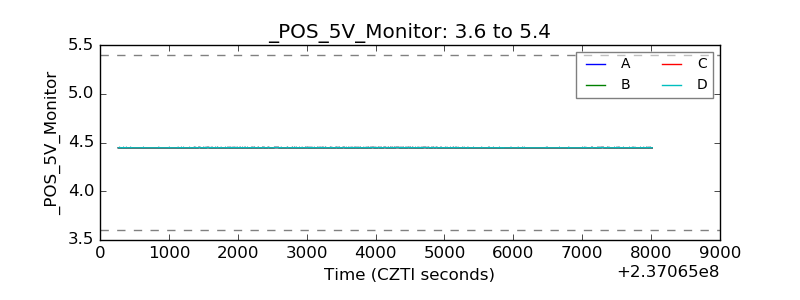 |
| _ROLL_ROT | 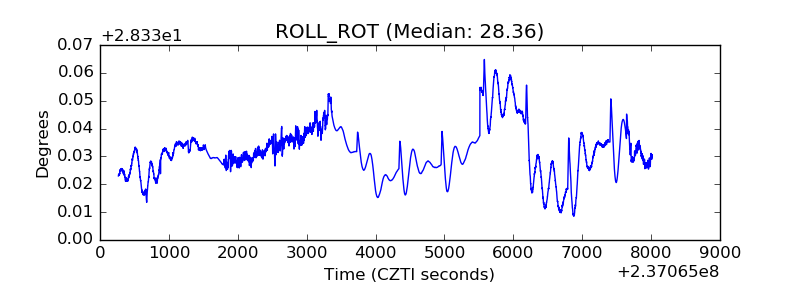 |
| _Roll_DEC | 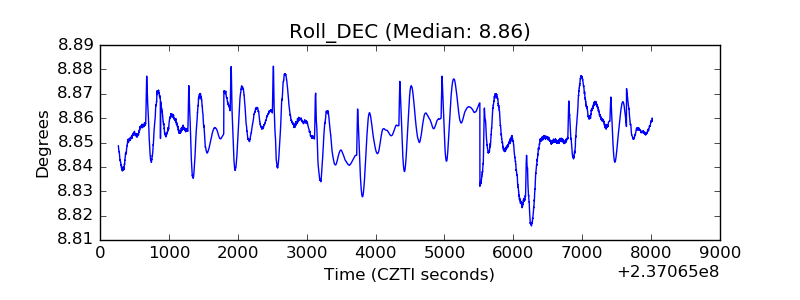 |
| _Roll_RA | 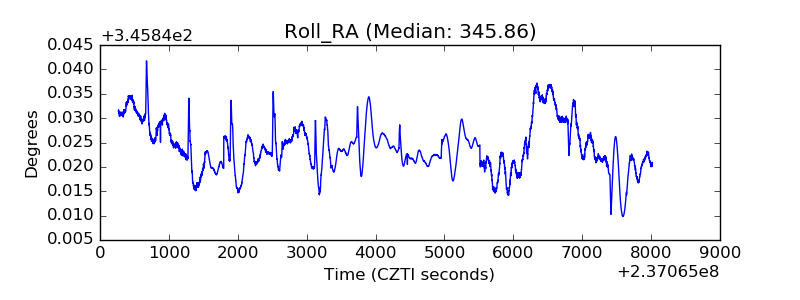 |
| Veto Counter | 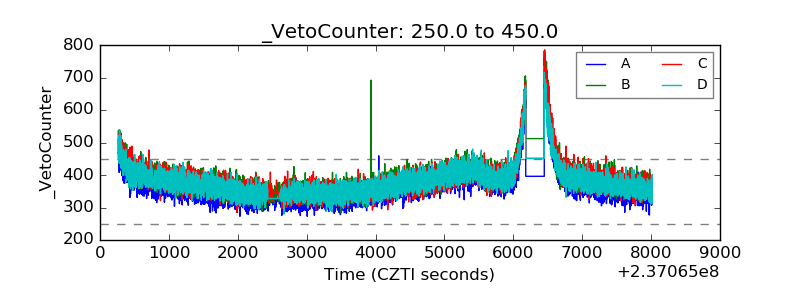 |