| Param | Original file | Final file |
|---|---|---|
| Filename | modeM0/AS1G05_238T01_9000001364_09591cztM0_level2.evt | modeM0/AS1G05_238T01_9000001364_09591cztM0_level2_quad_clean.evt |
| Size (bytes) | 424,137,600 | 82,405,440 |
| Size | 404.5 MB | 78.6 MB |
| Events in quadrant A | 3,463,664 | 519,027 |
| Events in quadrant B | 2,984,461 | 530,018 |
| Events in quadrant C | 2,835,291 | 515,618 |
| Events in quadrant D | 3,137,882 | 496,521 |
| Mode M0 | |||
|---|---|---|---|
| Quadrant | BADHDUFLAG | Total packets | Discarded packets |
| A | 0 | 16823 | 2515 |
| B | 0 | 14918 | 2029 |
| C | 0 | 14583 | 1890 |
| D | 0 | 15580 | 2281 |
| Mode SS | |||
|---|---|---|---|
| Quadrant | BADHDUFLAG | Total packets | Discarded packets |
| A | 0 | 146 | 12 |
| B | 0 | 146 | 14 |
| C | 0 | 145 | 13 |
| D | 0 | 146 | 16 |
| Mode M9 | |||
|---|---|---|---|
| Quadrant | BADHDUFLAG | Total packets | Discarded packets |
| A | 0 | 18 | 3 |
| B | 0 | 18 | 0 |
| C | 0 | 18 | 3 |
| D | 0 | 18 | 0 |
| Quadrant | Total seconds | Saturated seconds | Saturation percentage |
|---|---|---|---|
| A | 6140 | 113 | 1.840391% |
| B | 6216 | 57 | 0.916988% |
| C | 6237 | 28 | 0.448934% |
| D | 6173 | 36 | 0.583185% |
Noise dominated data is calculated using 1-second bins in cleaned event files. If a bin has >2000 counts, and if more than 50% of those come from <1% of pixels, then it is considered to be noise-dominated and hence unusable.
| Quadrant | # 1 sec bins | Bins with >0 counts | Bins with >2000 counts | High rate bins dominated by noise | Noise dominated (total time) | Noise dominated (detector-on time) | Marked lightcurve |
|---|---|---|---|---|---|---|---|
| A | 8926 | 6796 | 7 | 7 | 0.08% | 0.10% | 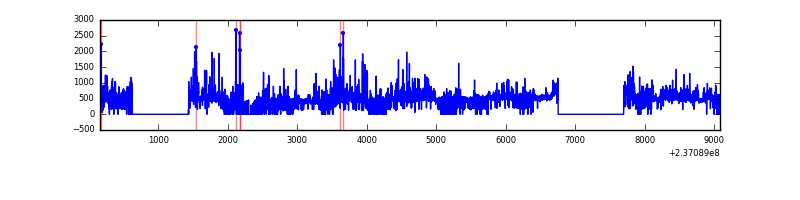 |
| B | 8926 | 6837 | 1 | 1 | 0.01% | 0.01% | 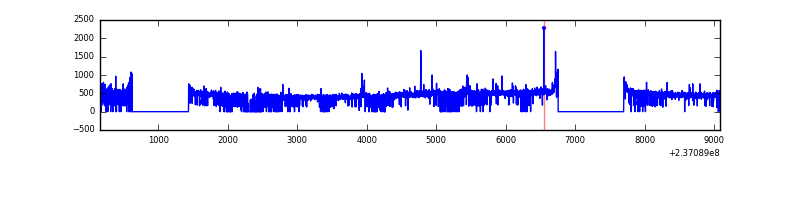 |
| C | 8926 | 6858 | 0 | 0 | 0.00% | 0.00% | 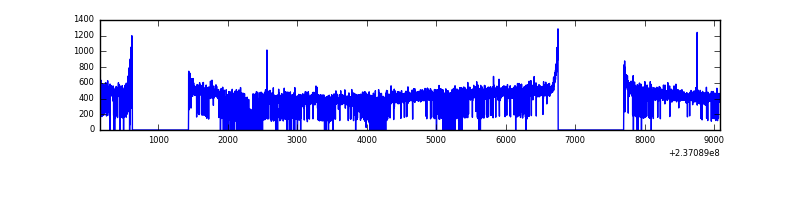 |
| D | 8926 | 6847 | 3 | 3 | 0.03% | 0.04% | 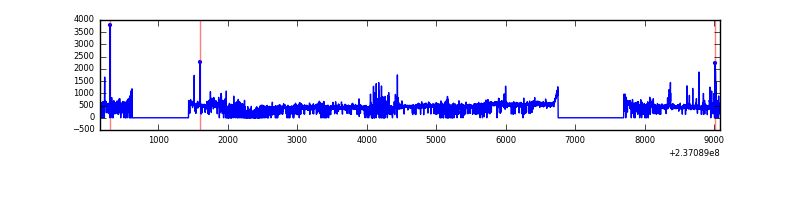 |
Top three noisy pixels from each quadrant. If the there are fewer than three noisy pixels in the level2.evt file, extra rows are filled as -1
| Pixel properties | Quadrant properties | ||||||
|---|---|---|---|---|---|---|---|
| Quadrant | DetID | PixID | Counts | Sigma | Mean | Median | Sigma |
| A | 1 | 162 | 252243 | 1664.98 | 736 | 719 | 151.1 |
| A | 1 | 178 | 129675 | 853.63 | 736 | 719 | 151.1 |
| A | 1 | 161 | 122005 | 802.86 | 736 | 719 | 151.1 |
| B | 4 | 80 | 28161 | 191.07 | 747 | 729 | 143.6 |
| B | 0 | 214 | 20546 | 138.03 | 747 | 729 | 143.6 |
| B | 12 | 111 | 16652 | 110.9 | 747 | 729 | 143.6 |
| C | 8 | 128 | 7683 | 41.13 | 722 | 727 | 169.1 |
| C | 13 | 61 | 5439 | 27.86 | 722 | 727 | 169.1 |
| C | 8 | 112 | 3624 | 17.13 | 722 | 727 | 169.1 |
| D | 8 | 195 | 162665 | 883.96 | 712 | 690 | 183.2 |
| D | 1 | 52 | 135963 | 738.24 | 712 | 690 | 183.2 |
| D | 10 | 172 | 46413 | 249.53 | 712 | 690 | 183.2 |
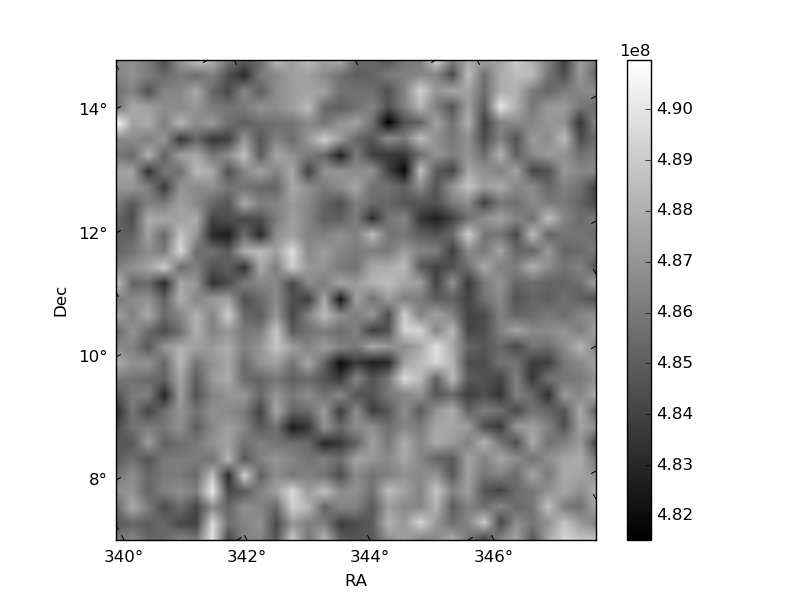
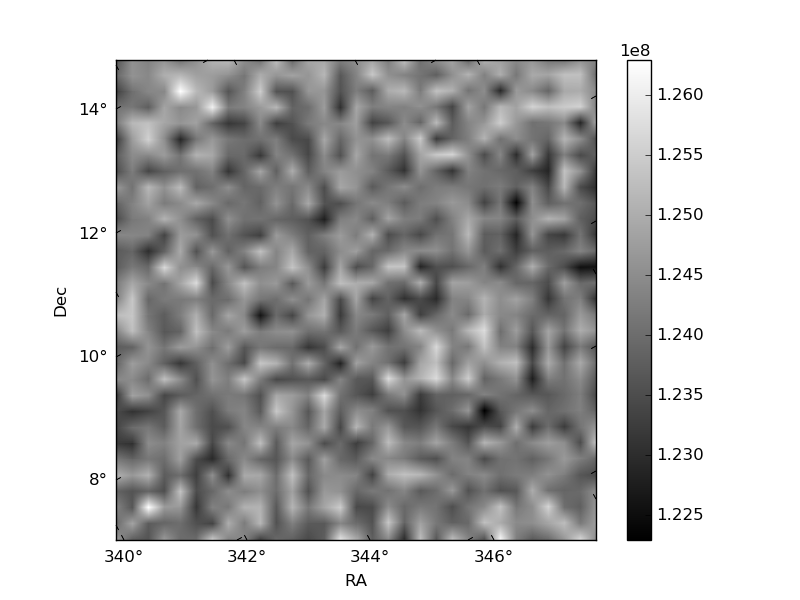
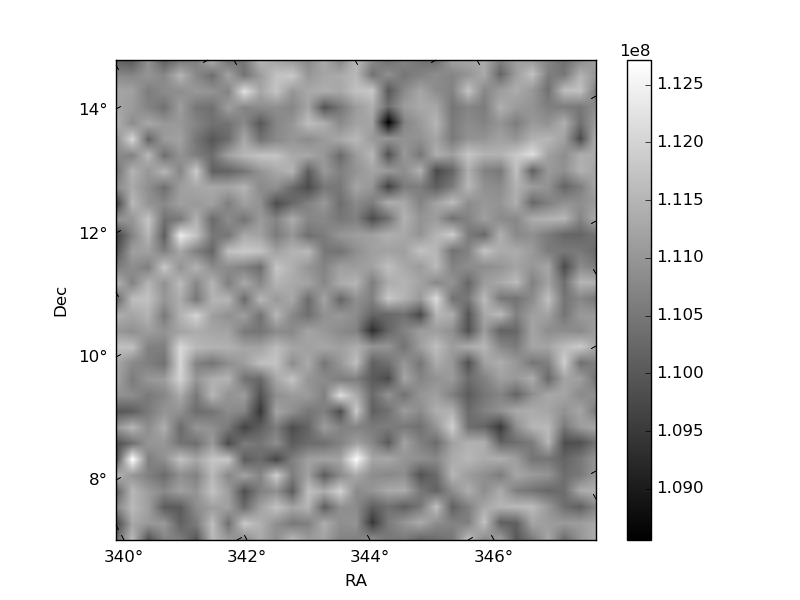
Histogram calculated using DETX and DETY for each event in the final _common_clean file
| Quadrant A | 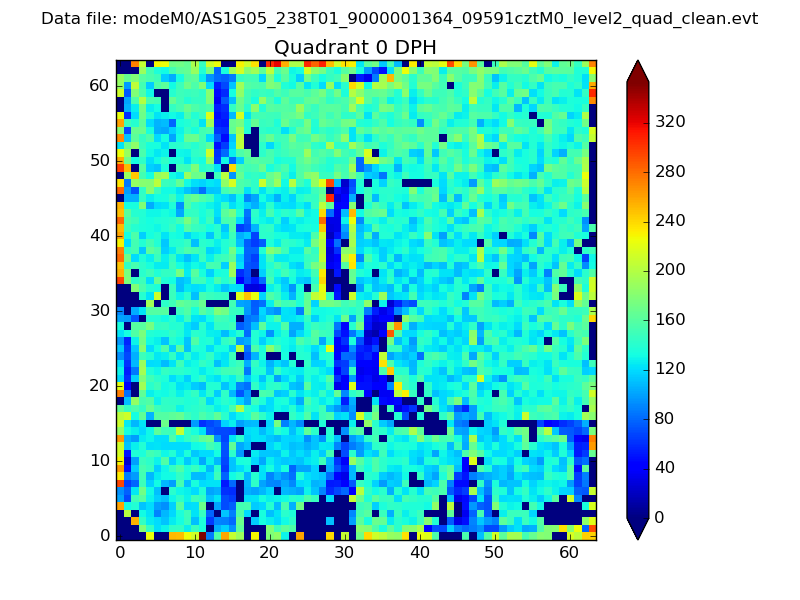 |
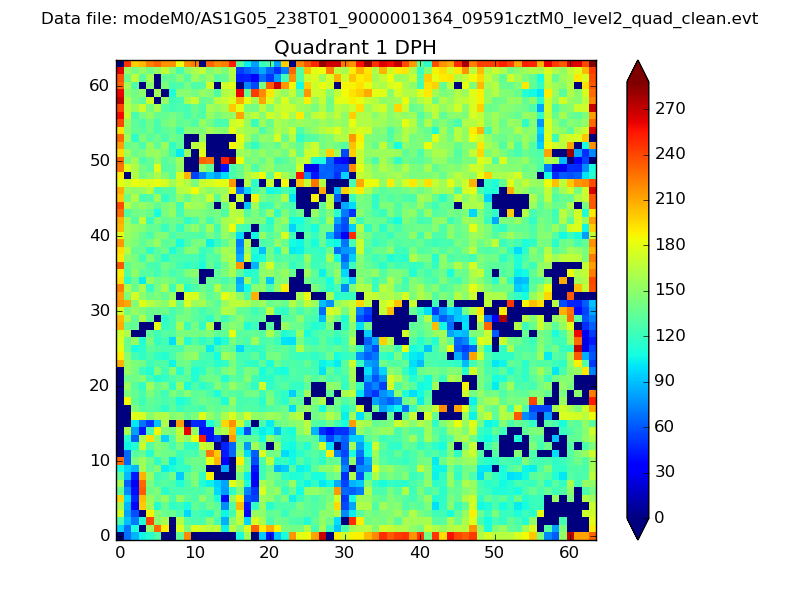 |
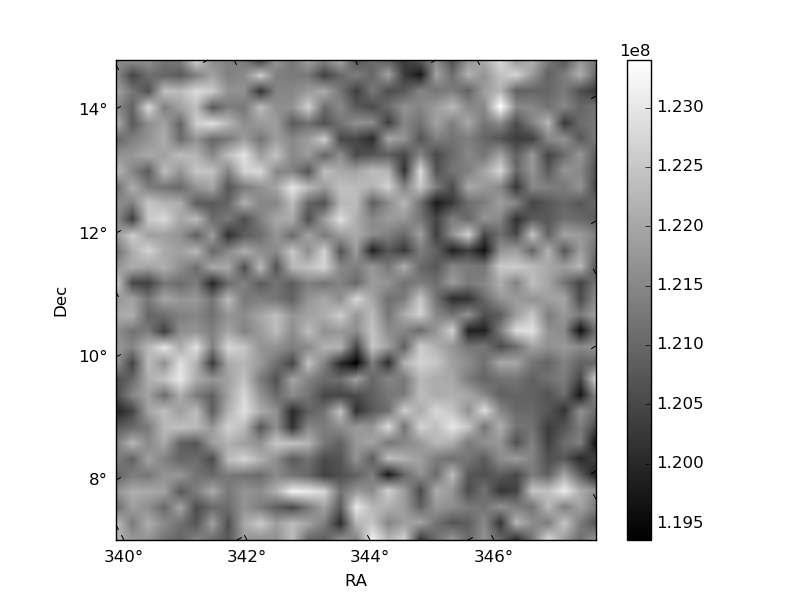
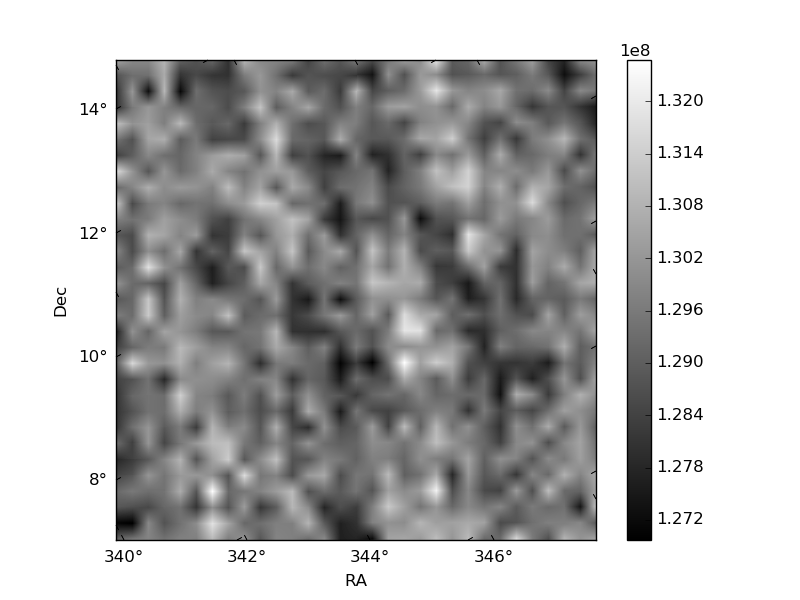
Quadrant B |
|---|---|---|---|
| Quadrant D | 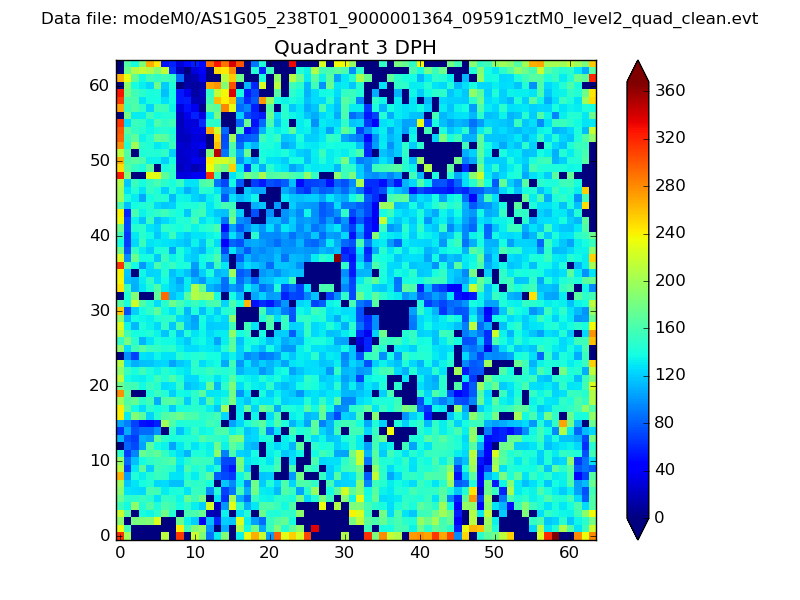 |
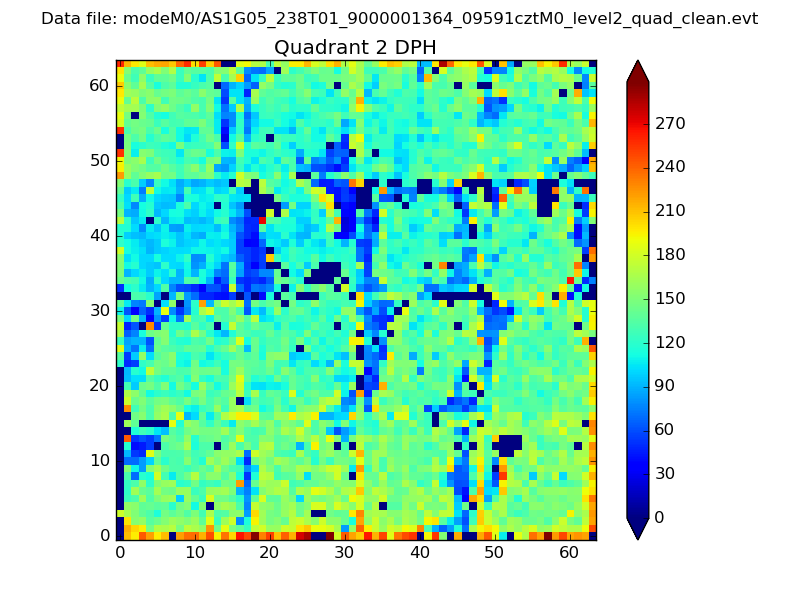 |
Quadrant C |
| Plot type | Count rate plots | Images |
|---|---|---|
| Comparison with Poisson distribution Blue bars denote a histogram of data divided into 1 sec bins. Red curve is a Poisson curve with rate = median count rate of data. |
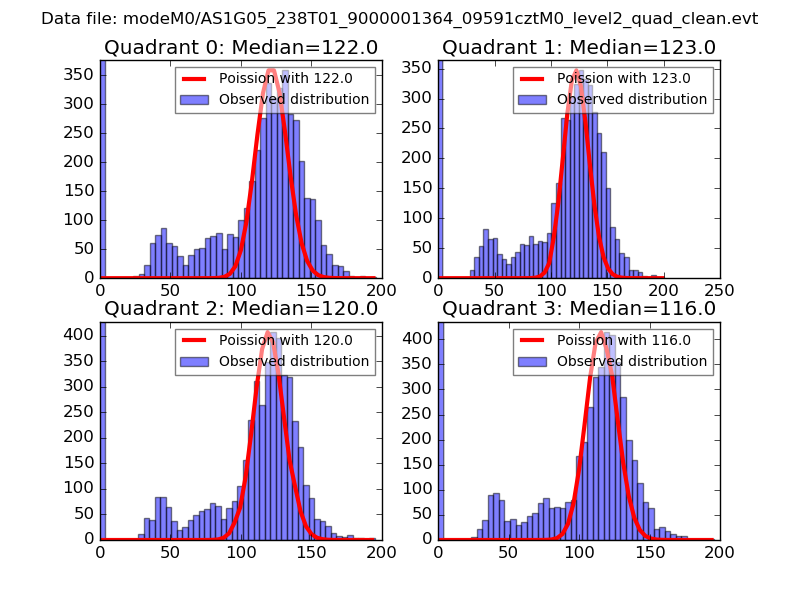 |
 |
| Quadrant-wise count rates Data is divided into 100 sec bins |
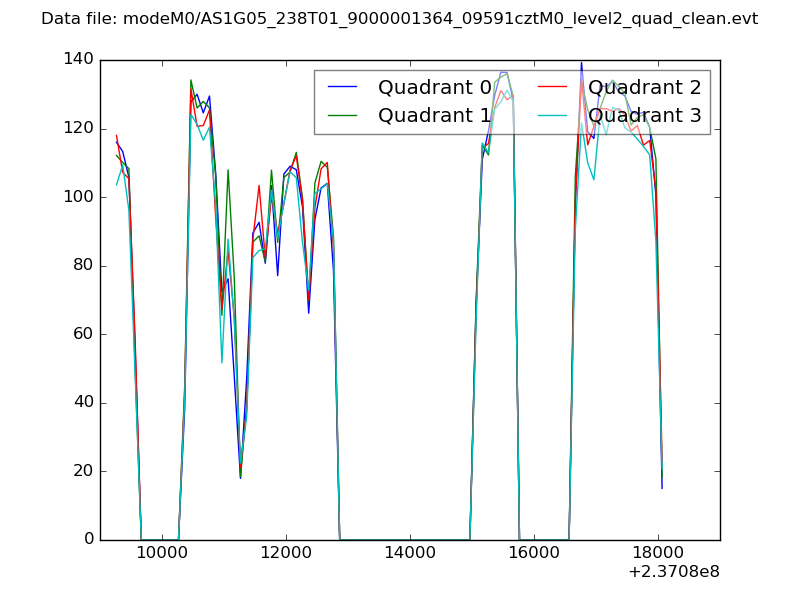 |
|
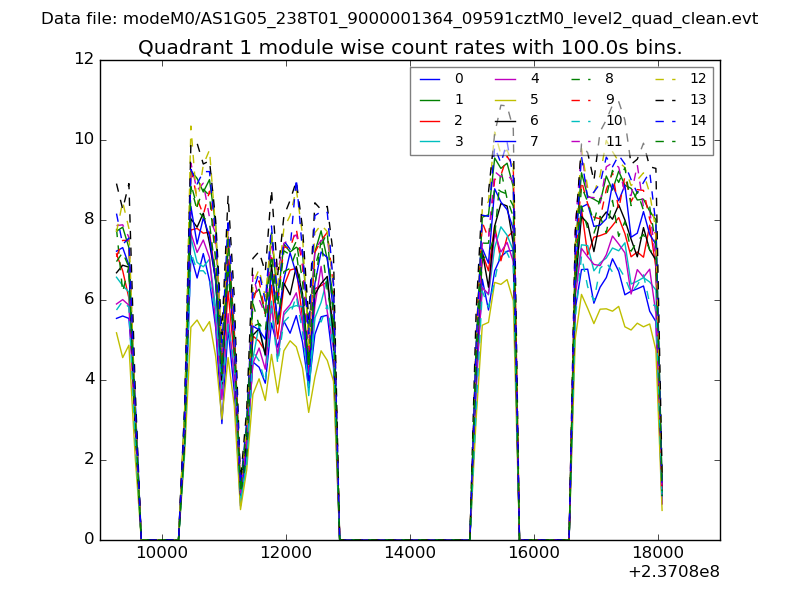
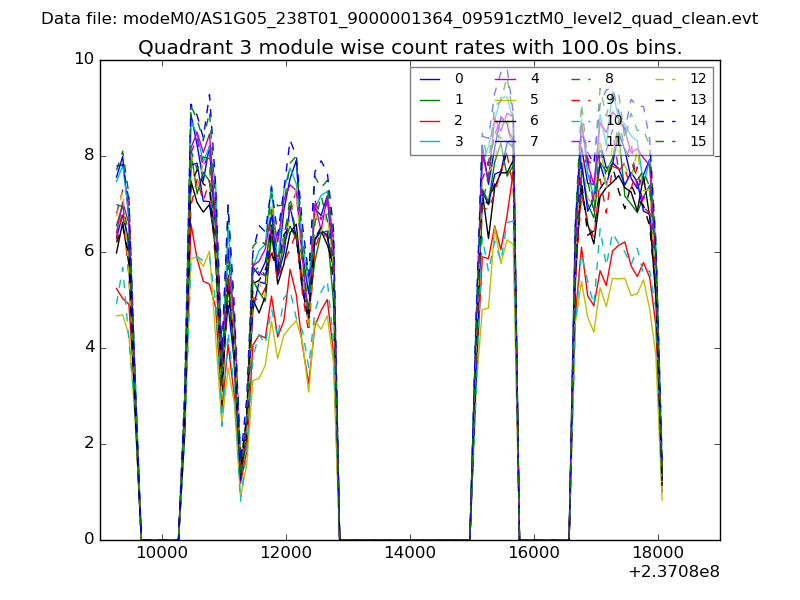
| Module-wise count rates for Quadrant A Data is divided into 100 sec bins |
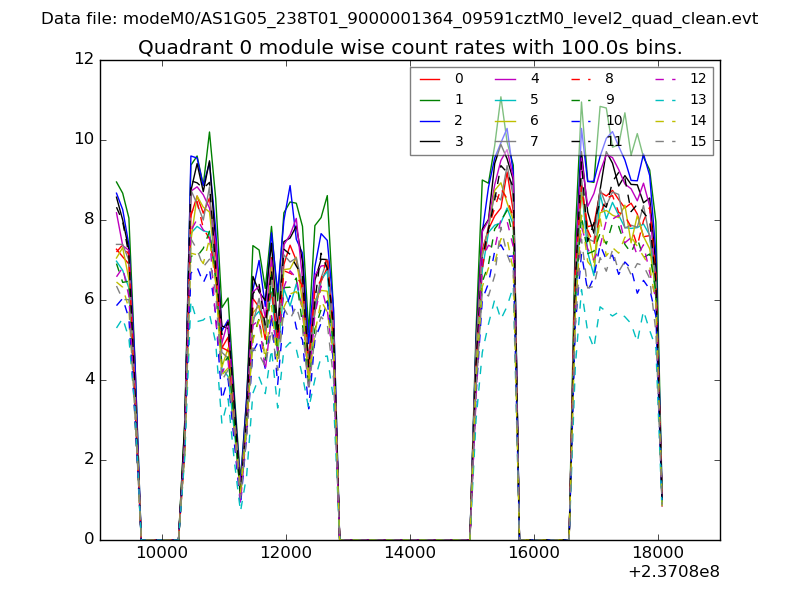 |
 |
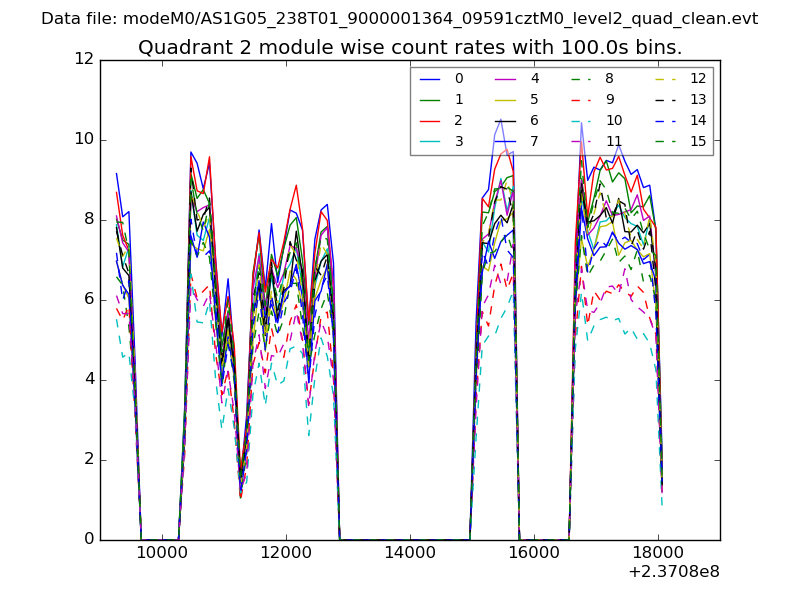
| Module-wise count rates for Quadrant B Data is divided into 100 sec bins |
 |
 |
| Module-wise count rates for Quadrant C Data is divided into 100 sec bins |
 |
 |
| Module-wise count rates for Quadrant D Data is divided into 100 sec bins |
 |
 |
| Parameter | Plot |
|---|---|
| CZT HV Monitor | 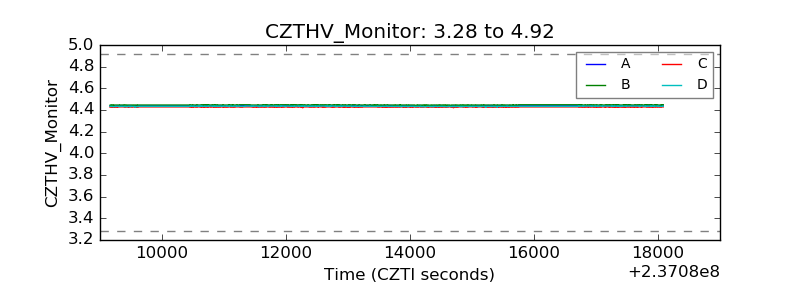 |
| D_VDD | 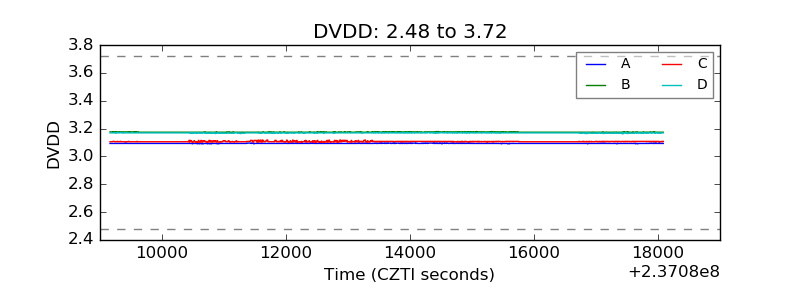 |
| Temperature 1 | 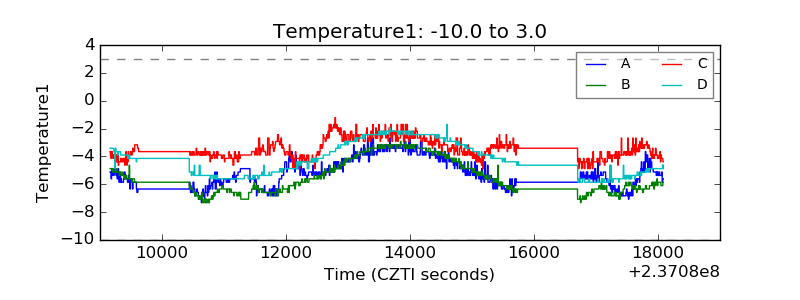 |
| Veto HV Monitor | 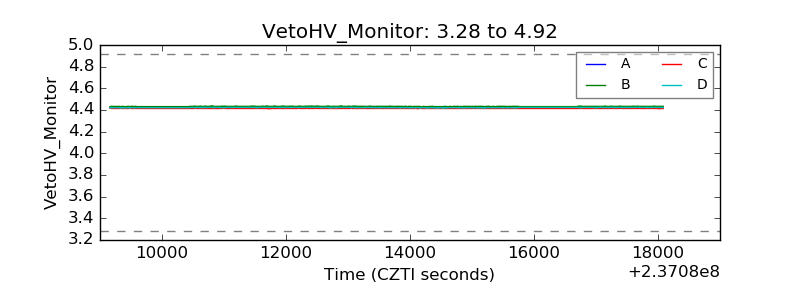 |
| Veto LLD | 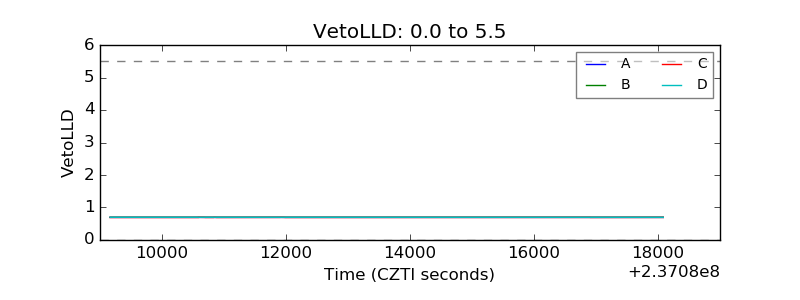 |
| Alpha Counter | 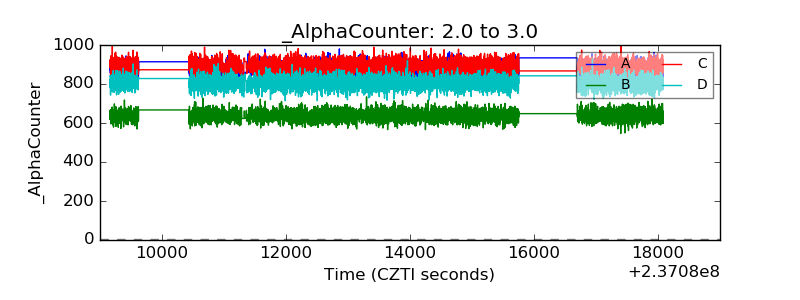 |
| _CPM_Rate | 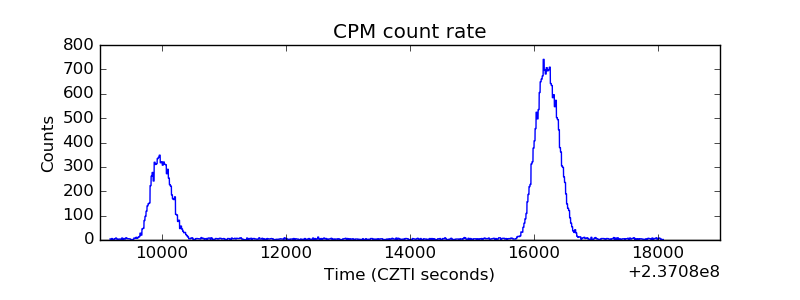 |
| CZT Counter | 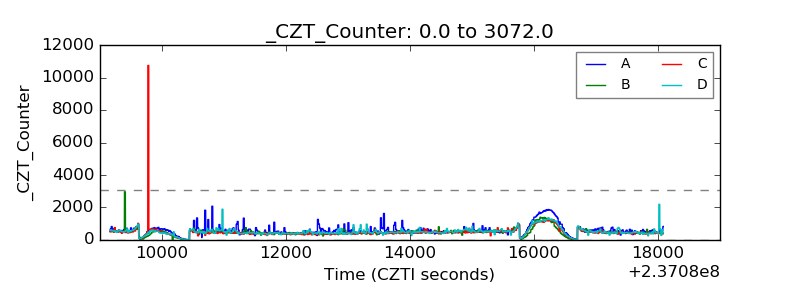 |
| +2.5 Volts monitor |  |
| +5 Volts monitor |  |
| _ROLL_ROT | 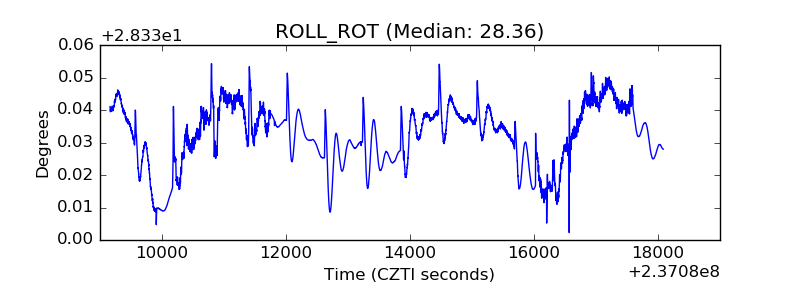 |
| _Roll_DEC | 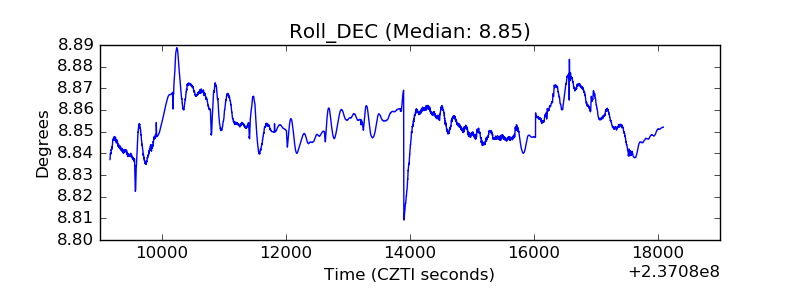 |
| _Roll_RA | 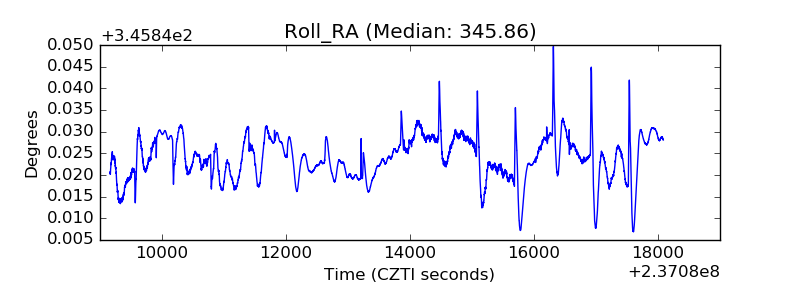 |
| Veto Counter | 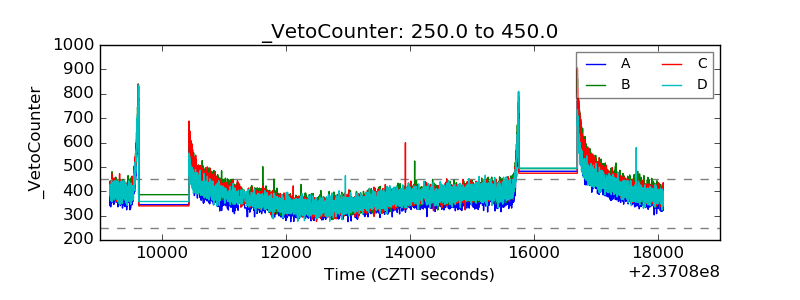 |