| Param | Original file | Final file |
|---|---|---|
| Filename | modeM0/AS1G05_238T01_9000001364_09593cztM0_level2.evt | modeM0/AS1G05_238T01_9000001364_09593cztM0_level2_quad_clean.evt |
| Size (bytes) | 2,002,642,560 | 346,406,400 |
| Size | 1.9 GB | 330.4 MB |
| Events in quadrant A | 15,932,316 | 2,172,588 |
| Events in quadrant B | 13,573,975 | 2,192,868 |
| Events in quadrant C | 12,653,933 | 2,134,817 |
| Events in quadrant D | 16,581,326 | 2,049,125 |
| Mode M0 | |||
|---|---|---|---|
| Quadrant | BADHDUFLAG | Total packets | Discarded packets |
| A | 0 | 68154 | 2031 |
| B | 0 | 60881 | 1704 |
| C | 0 | 59033 | 1606 |
| D | 0 | 69830 | 1882 |
| Mode SS | |||
|---|---|---|---|
| Quadrant | BADHDUFLAG | Total packets | Discarded packets |
| A | 0 | 590 | 22 |
| B | 0 | 590 | 18 |
| C | 0 | 590 | 14 |
| D | 0 | 590 | 20 |
| Mode M9 | |||
|---|---|---|---|
| Quadrant | BADHDUFLAG | Total packets | Discarded packets |
| A | 0 | 40 | 0 |
| B | 0 | 40 | 0 |
| C | 0 | 40 | 1 |
| D | 0 | 40 | 0 |
| Quadrant | Total seconds | Saturated seconds | Saturation percentage |
|---|---|---|---|
| A | 28221 | 475 | 1.683144% |
| B | 28270 | 274 | 0.969225% |
| C | 28290 | 97 | 0.342877% |
| D | 28258 | 959 | 3.393729% |
Noise dominated data is calculated using 1-second bins in cleaned event files. If a bin has >2000 counts, and if more than 50% of those come from <1% of pixels, then it is considered to be noise-dominated and hence unusable.
| Quadrant | # 1 sec bins | Bins with >0 counts | Bins with >2000 counts | High rate bins dominated by noise | Noise dominated (total time) | Noise dominated (detector-on time) | Marked lightcurve |
|---|---|---|---|---|---|---|---|
| A | 32990 | 28794 | 20 | 20 | 0.06% | 0.07% | 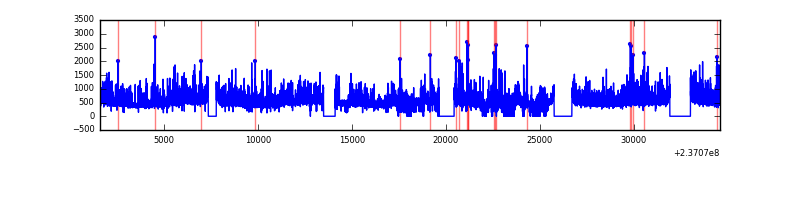 |
| B | 32990 | 28792 | 42 | 42 | 0.13% | 0.15% |  |
| C | 32990 | 28823 | 1 | 1 | 0.00% | 0.00% | 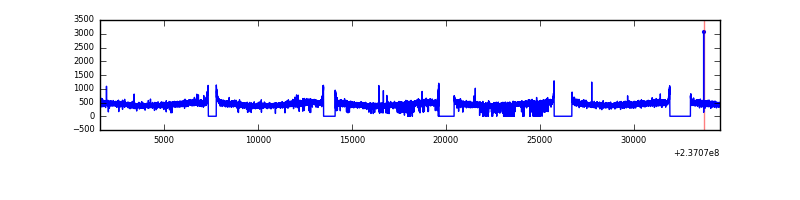 |
| D | 32990 | 28777 | 663 | 663 | 2.01% | 2.30% | 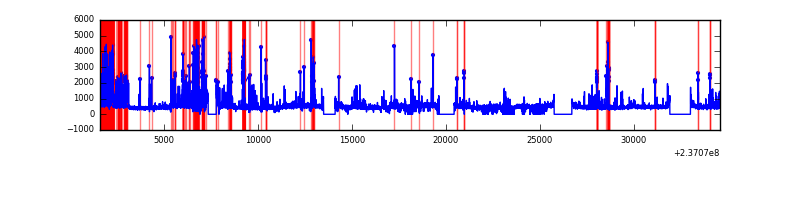 |
Top three noisy pixels from each quadrant. If the there are fewer than three noisy pixels in the level2.evt file, extra rows are filled as -1
| Pixel properties | Quadrant properties | ||||||
|---|---|---|---|---|---|---|---|
| Quadrant | DetID | PixID | Counts | Sigma | Mean | Median | Sigma |
| A | 1 | 162 | 1203272 | 1786.63 | 3341 | 3275 | 671.7 |
| A | 1 | 178 | 621881 | 921.02 | 3341 | 3275 | 671.7 |
| A | 1 | 161 | 588520 | 871.35 | 3341 | 3275 | 671.7 |
| B | 4 | 80 | 287497 | 445.82 | 3352 | 3267 | 637.5 |
| B | 0 | 214 | 99300 | 150.63 | 3352 | 3267 | 637.5 |
| B | 12 | 111 | 73502 | 110.16 | 3352 | 3267 | 637.5 |
| C | 13 | 61 | 24178 | 27.77 | 3239 | 3250 | 753.7 |
| C | 8 | 128 | 11908 | 11.49 | 3239 | 3250 | 753.7 |
| C | 14 | 67 | 9705 | 8.56 | 3239 | 3250 | 753.7 |
| D | 1 | 52 | 2819932 | 3503.25 | 3190 | 3108 | 804.1 |
| D | 8 | 195 | 747038 | 925.22 | 3190 | 3108 | 804.1 |
| D | 13 | 104 | 240526 | 295.27 | 3190 | 3108 | 804.1 |
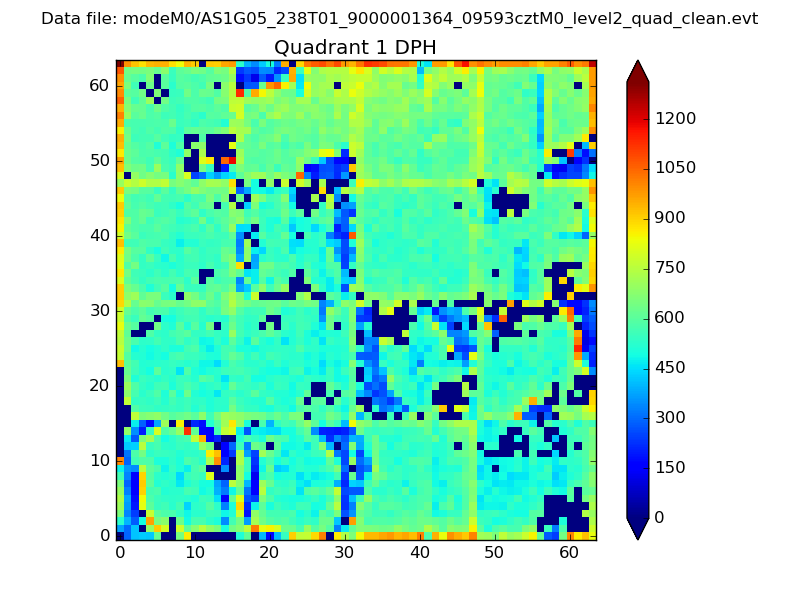
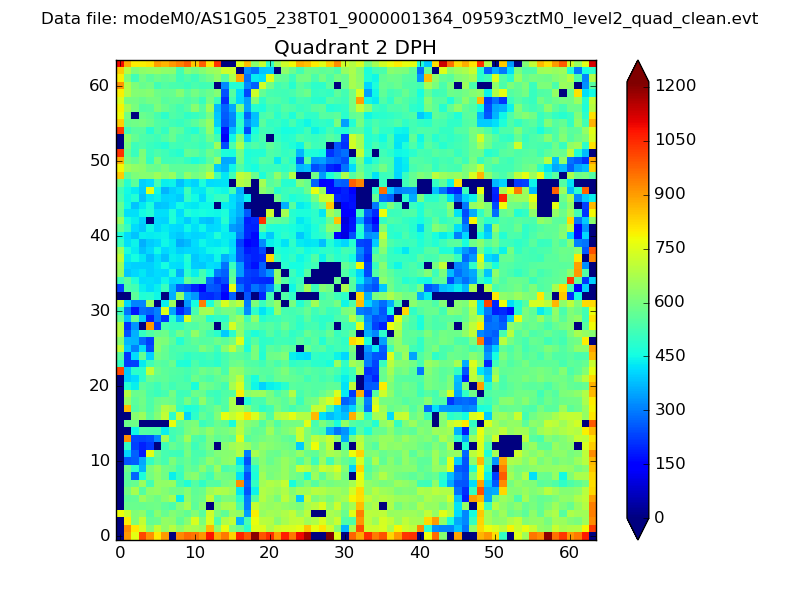
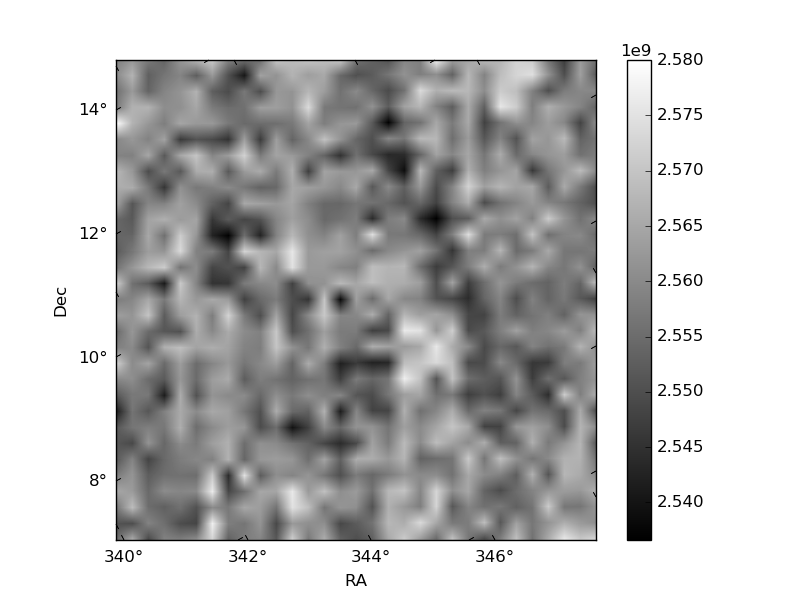
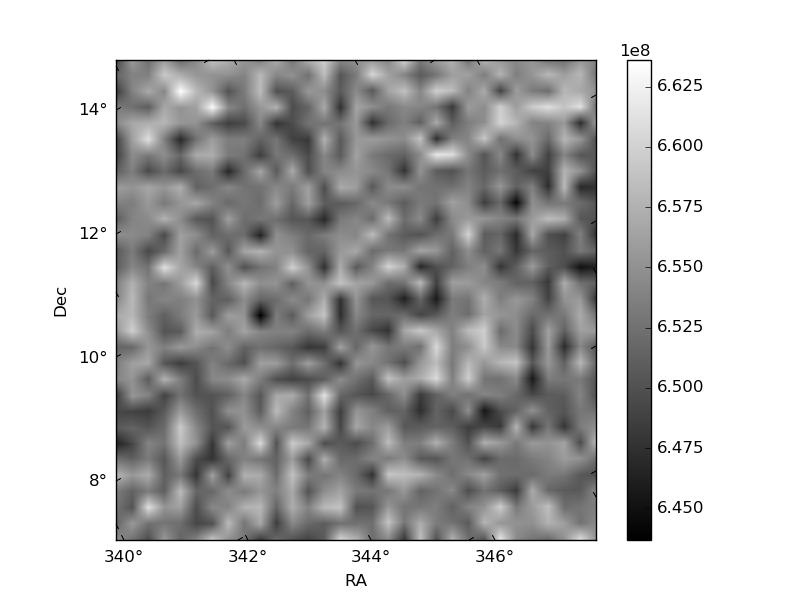
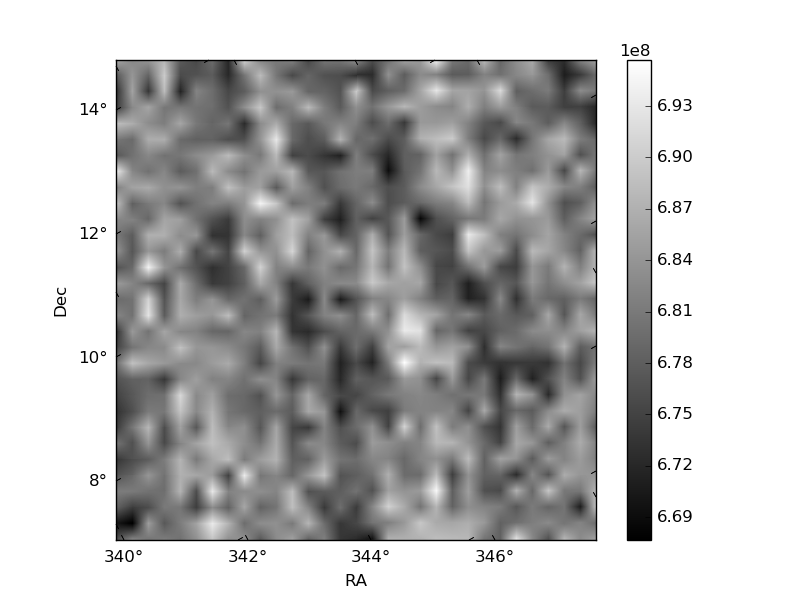
Histogram calculated using DETX and DETY for each event in the final _common_clean file
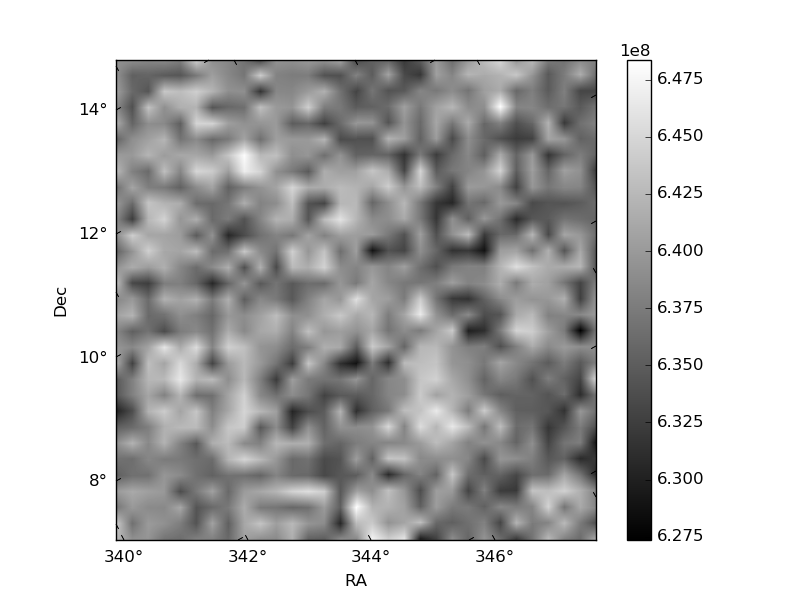
| Quadrant A | 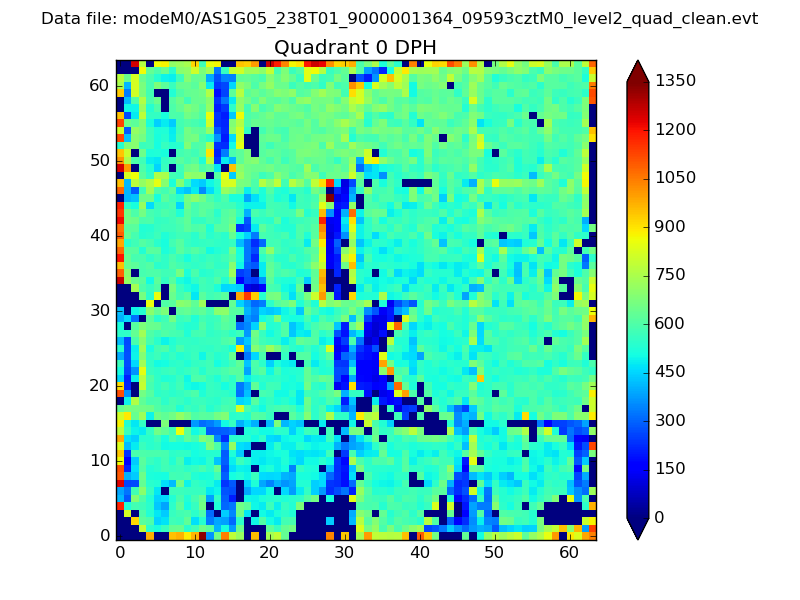 |
 |
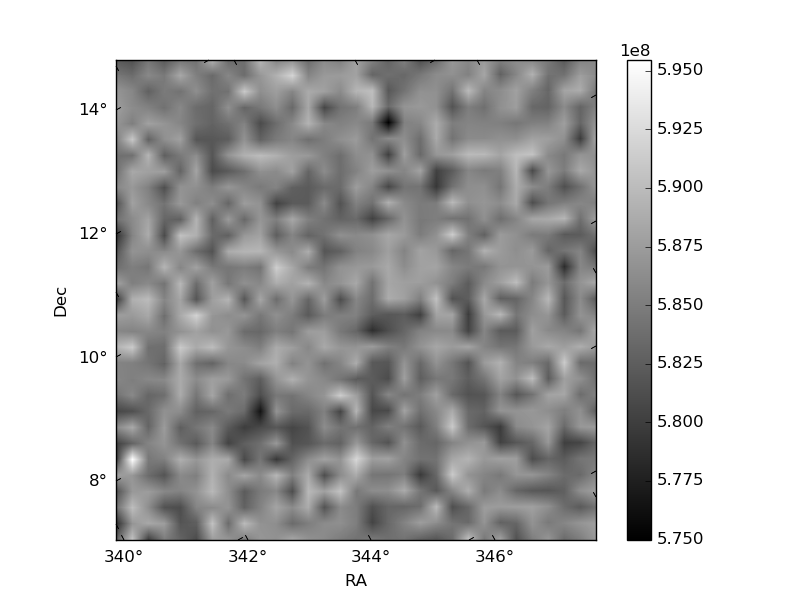
Quadrant B |
|---|---|---|---|
| Quadrant D | 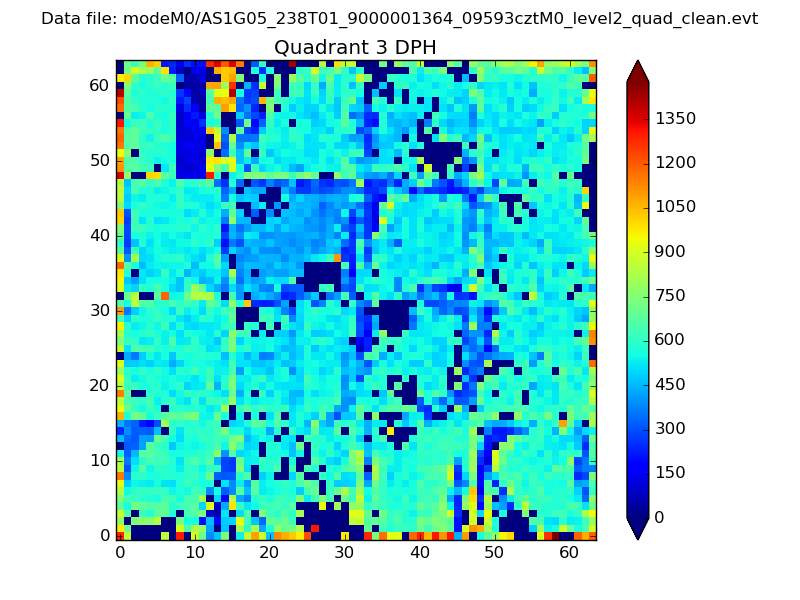 |
 |
Quadrant C |
| Plot type | Count rate plots | Images |
|---|---|---|
| Comparison with Poisson distribution Blue bars denote a histogram of data divided into 1 sec bins. Red curve is a Poisson curve with rate = median count rate of data. |
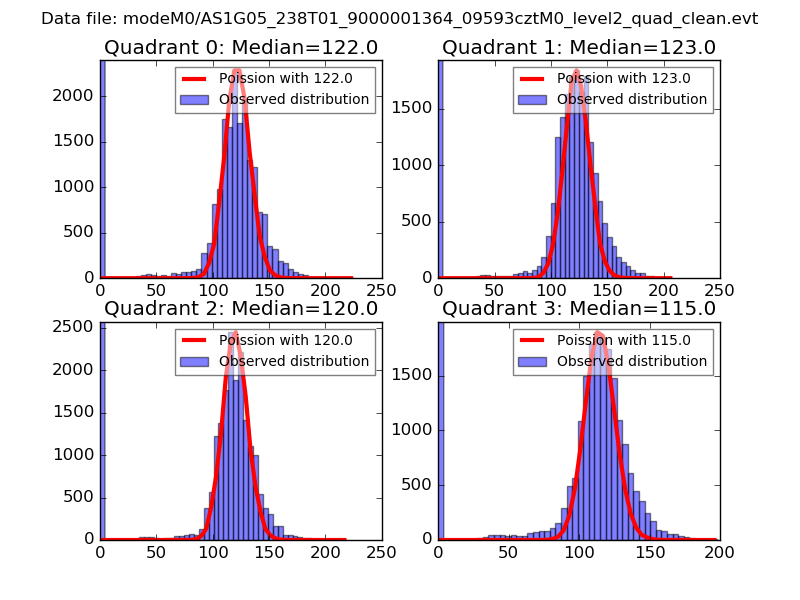 |
 |
| Quadrant-wise count rates Data is divided into 100 sec bins |
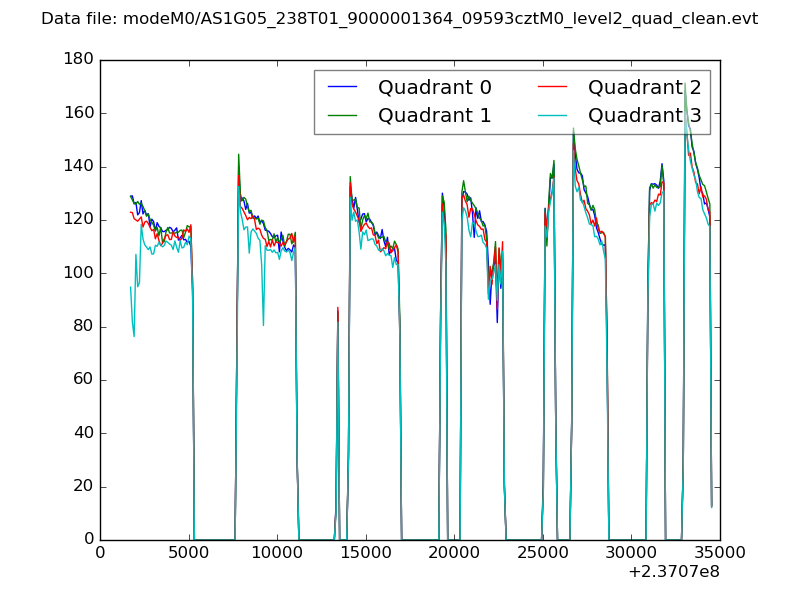 |
|
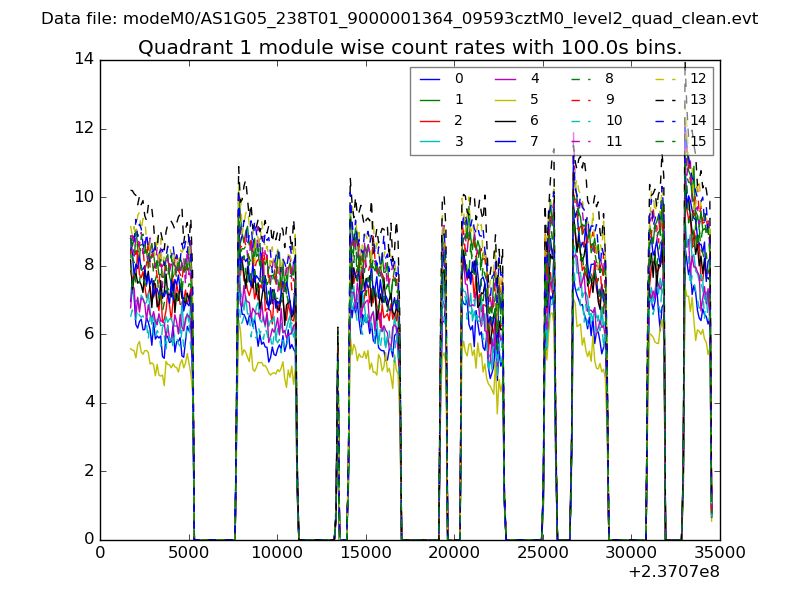
| Module-wise count rates for Quadrant A Data is divided into 100 sec bins |
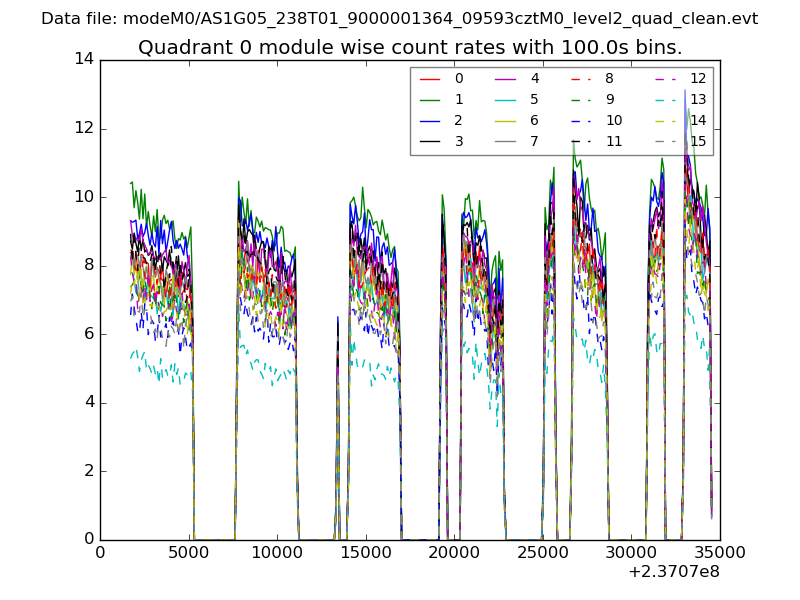 |
 |
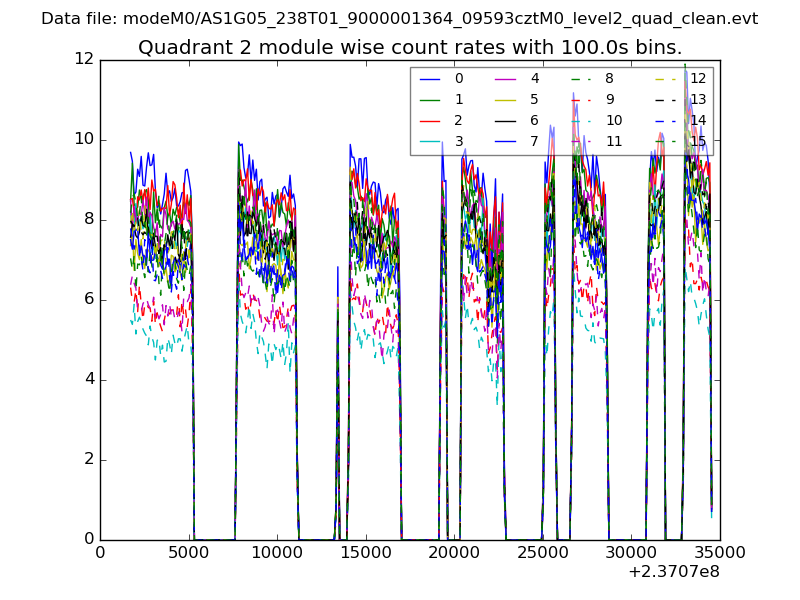
| Module-wise count rates for Quadrant B Data is divided into 100 sec bins |
 |
 |
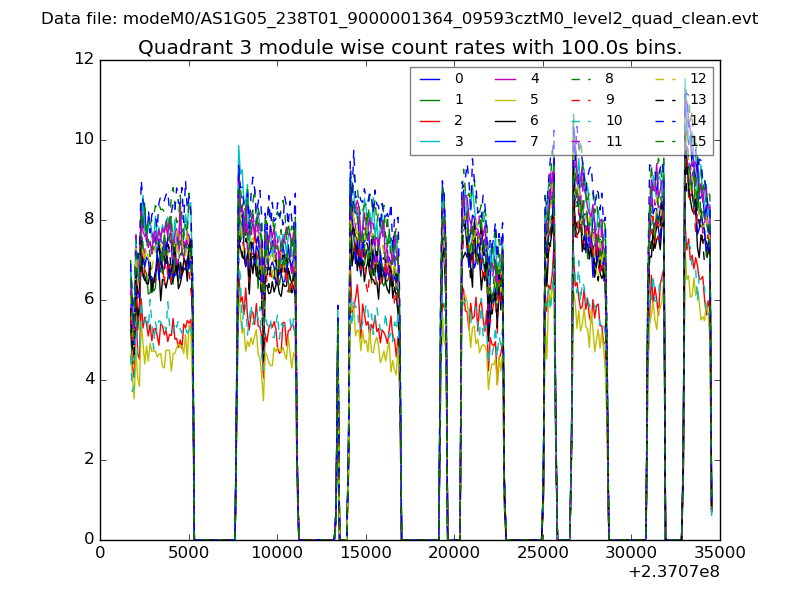
| Module-wise count rates for Quadrant C Data is divided into 100 sec bins |
 |
 |
| Module-wise count rates for Quadrant D Data is divided into 100 sec bins |
 |
 |
| Parameter | Plot |
|---|---|
| CZT HV Monitor | 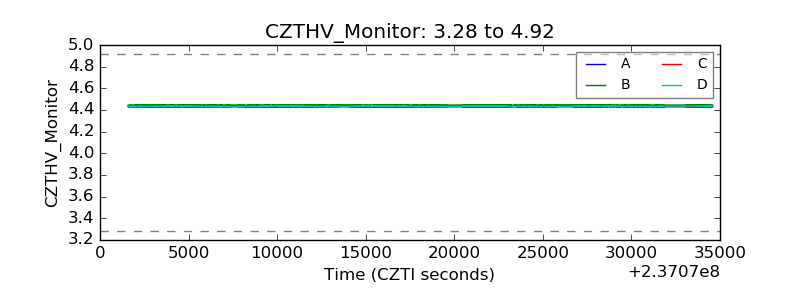 |
| D_VDD | 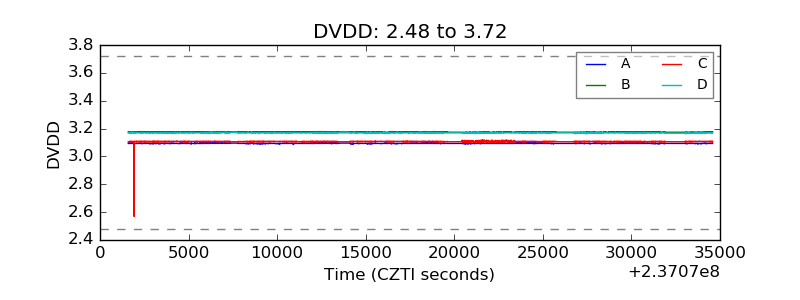 |
| Temperature 1 | 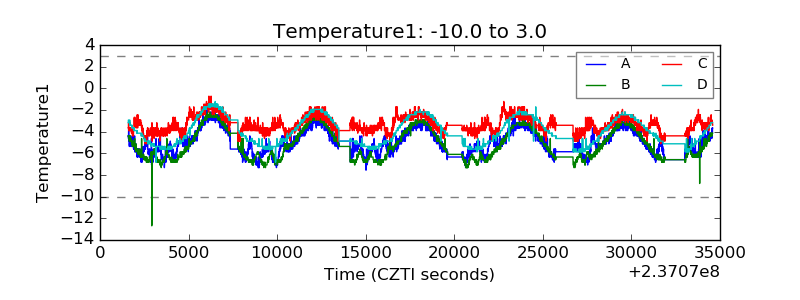 |
| Veto HV Monitor |  |
| Veto LLD | 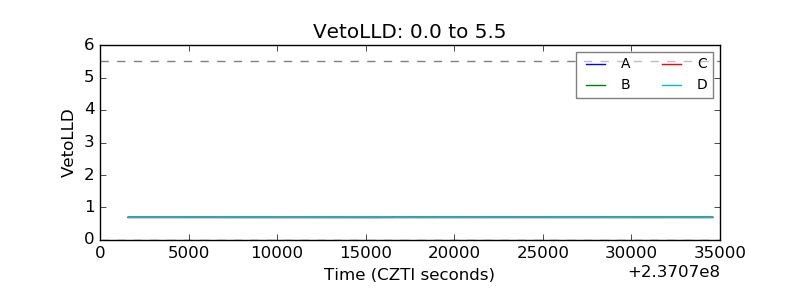 |
| Alpha Counter | 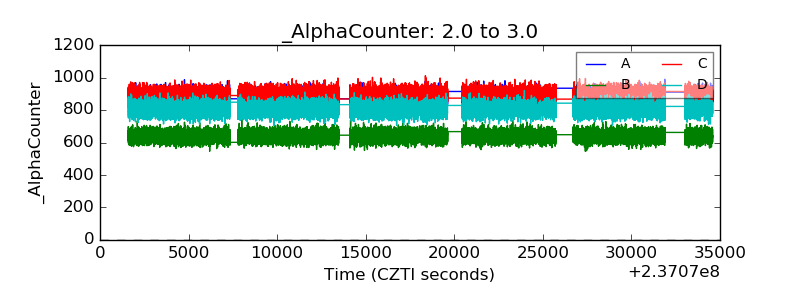 |
| _CPM_Rate | 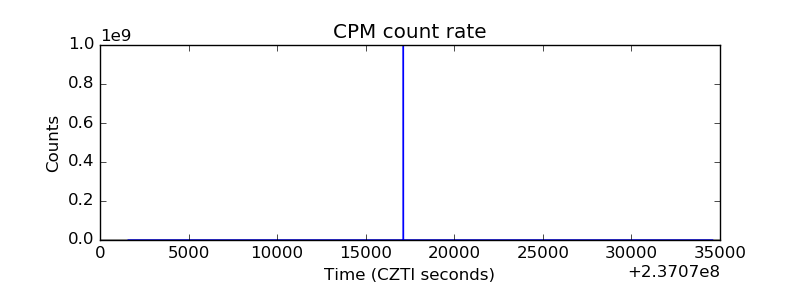 |
| CZT Counter |  |
| +2.5 Volts monitor |  |
| +5 Volts monitor |  |
| _ROLL_ROT | 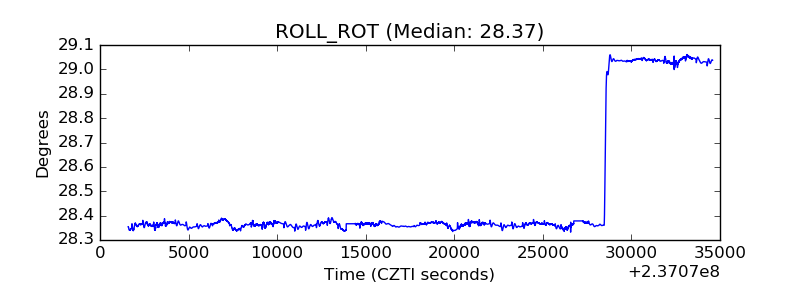 |
| _Roll_DEC | 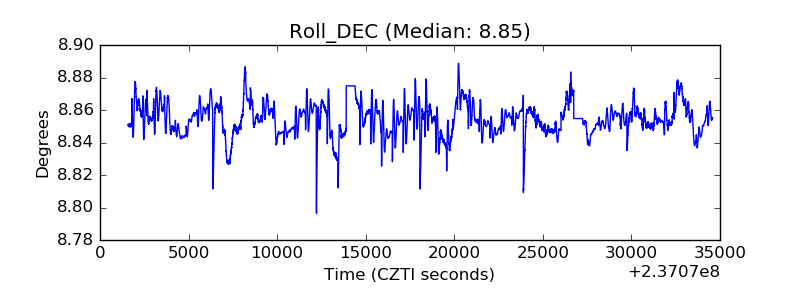 |
| _Roll_RA | 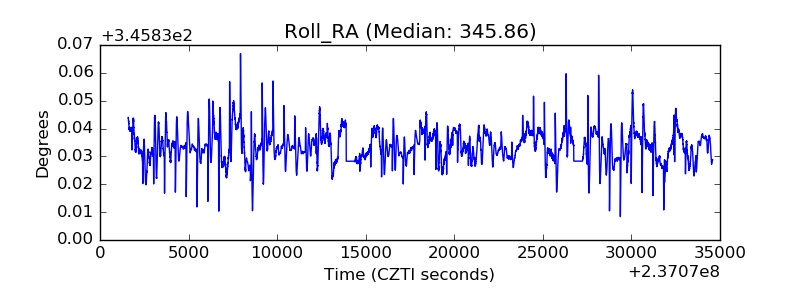 |
| Veto Counter | 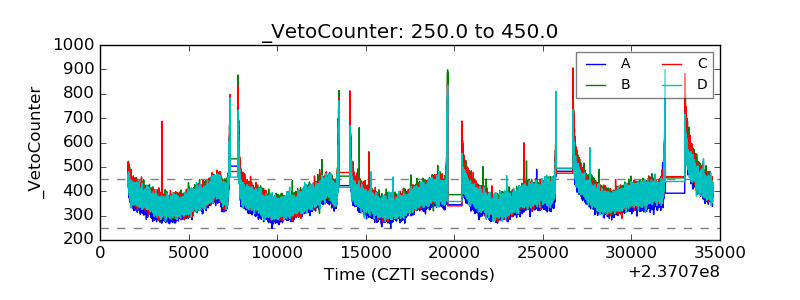 |