| Param | Original file | Final file |
|---|---|---|
| Filename | modeM0/AS1G05_238T01_9000001364_09597cztM0_level2.evt | modeM0/AS1G05_238T01_9000001364_09597cztM0_level2_quad_clean.evt |
| Size (bytes) | 509,106,240 | 64,869,120 |
| Size | 485.5 MB | 61.9 MB |
| Events in quadrant A | 4,001,347 | 388,145 |
| Events in quadrant B | 3,465,631 | 385,713 |
| Events in quadrant C | 3,224,405 | 374,500 |
| Events in quadrant D | 4,286,718 | 362,922 |
| Mode M0 | |||
|---|---|---|---|
| Quadrant | BADHDUFLAG | Total packets | Discarded packets |
| A | 0 | 16067 | 3 |
| B | 0 | 14155 | 2 |
| C | 0 | 13473 | 2 |
| D | 0 | 16802 | 2 |
| Mode SS | |||
|---|---|---|---|
| Quadrant | BADHDUFLAG | Total packets | Discarded packets |
| A | 0 | 132 | 0 |
| B | 0 | 132 | 0 |
| C | 0 | 132 | 0 |
| D | 0 | 132 | 0 |
| Mode M9 | |||
|---|---|---|---|
| Quadrant | BADHDUFLAG | Total packets | Discarded packets |
| A | 0 | 14 | 0 |
| B | 0 | 14 | 0 |
| C | 0 | 14 | 0 |
| D | 0 | 15 | 0 |
| Quadrant | Total seconds | Saturated seconds | Saturation percentage |
|---|---|---|---|
| A | 6489 | 163 | 2.511943% |
| B | 6489 | 98 | 1.510248% |
| C | 6489 | 50 | 0.770535% |
| D | 6489 | 235 | 3.621513% |
Noise dominated data is calculated using 1-second bins in cleaned event files. If a bin has >2000 counts, and if more than 50% of those come from <1% of pixels, then it is considered to be noise-dominated and hence unusable.
| Quadrant | # 1 sec bins | Bins with >0 counts | Bins with >2000 counts | High rate bins dominated by noise | Noise dominated (total time) | Noise dominated (detector-on time) | Marked lightcurve |
|---|---|---|---|---|---|---|---|
| A | 7794 | 6490 | 2 | 2 | 0.03% | 0.03% | 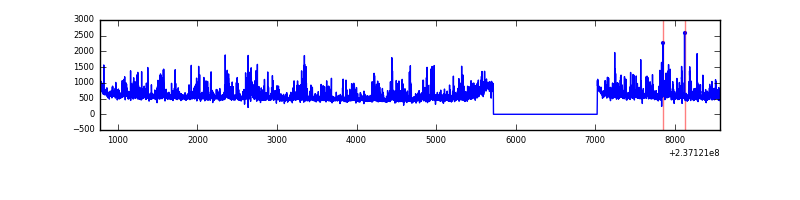 |
| B | 7794 | 6490 | 3 | 3 | 0.04% | 0.05% | 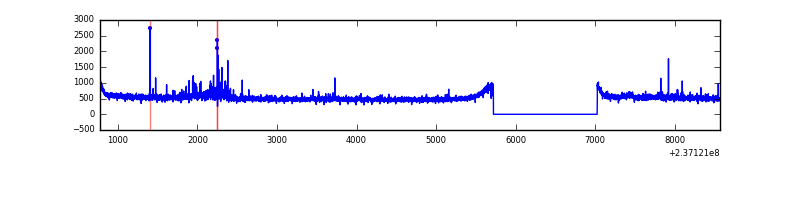 |
| C | 7794 | 6490 | 0 | 0 | 0.00% | 0.00% | 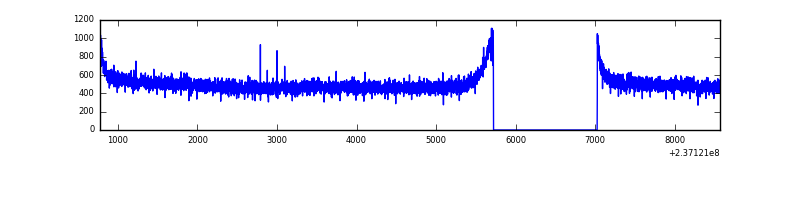 |
| D | 7794 | 6490 | 212 | 212 | 2.72% | 3.27% | 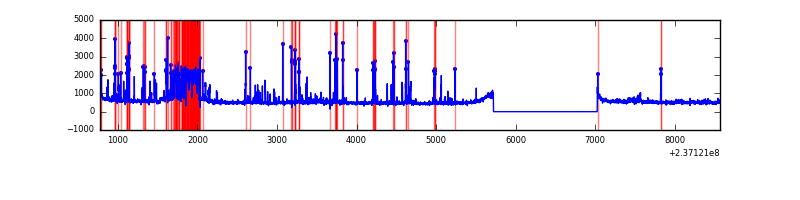 |
Top three noisy pixels from each quadrant. If the there are fewer than three noisy pixels in the level2.evt file, extra rows are filled as -1
| Pixel properties | Quadrant properties | ||||||
|---|---|---|---|---|---|---|---|
| Quadrant | DetID | PixID | Counts | Sigma | Mean | Median | Sigma |
| A | 1 | 162 | 260851 | 1509.27 | 865 | 851 | 172.3 |
| A | 1 | 178 | 137247 | 791.76 | 865 | 851 | 172.3 |
| A | 1 | 161 | 129775 | 748.39 | 865 | 851 | 172.3 |
| B | 0 | 214 | 52015 | 313.34 | 859 | 840 | 163.3 |
| B | 0 | 189 | 43278 | 259.85 | 859 | 840 | 163.3 |
| B | 12 | 111 | 17599 | 102.62 | 859 | 840 | 163.3 |
| C | 13 | 61 | 6185 | 28.0 | 826 | 831 | 191.2 |
| C | 12 | 4 | 2097 | 6.62 | 826 | 831 | 191.2 |
| C | 3 | 202 | 2058 | 6.42 | 826 | 831 | 191.2 |
| D | 1 | 52 | 797289 | 3839.24 | 825 | 806 | 207.5 |
| D | 13 | 122 | 142718 | 684.05 | 825 | 806 | 207.5 |
| D | 13 | 104 | 61393 | 292.04 | 825 | 806 | 207.5 |
Histogram calculated using DETX and DETY for each event in the final _common_clean file
| Quadrant A | 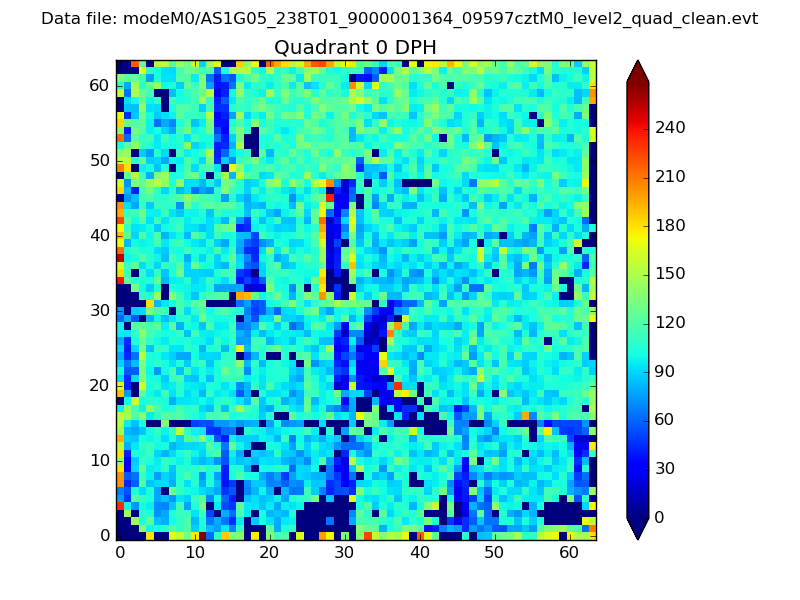 |
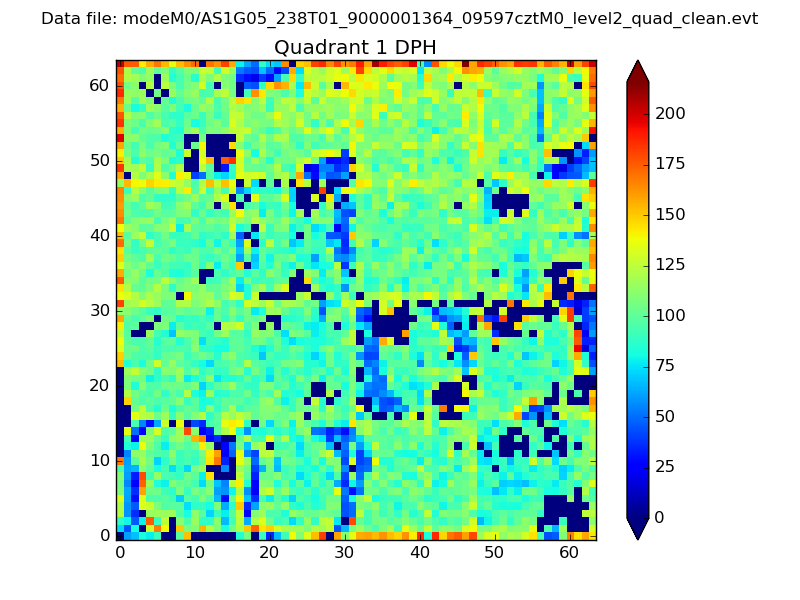 |
Quadrant B |
|---|---|---|---|
| Quadrant D | 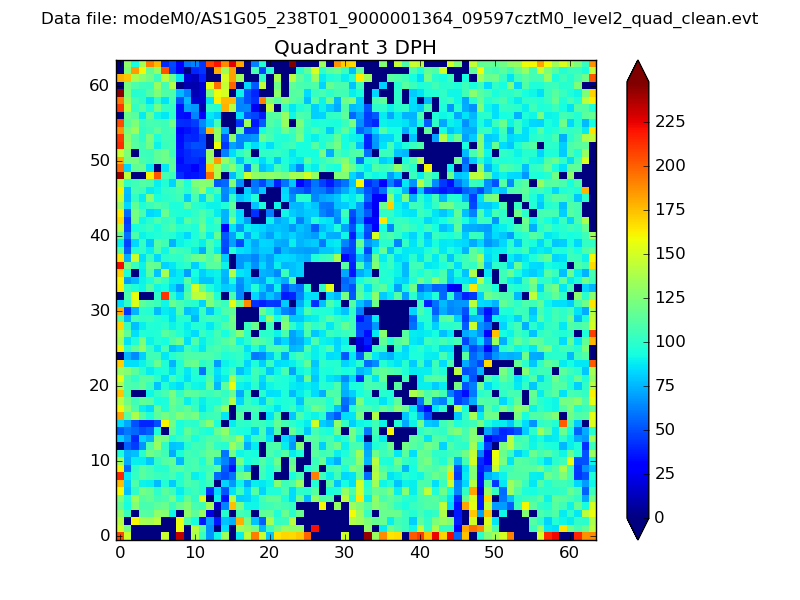 |
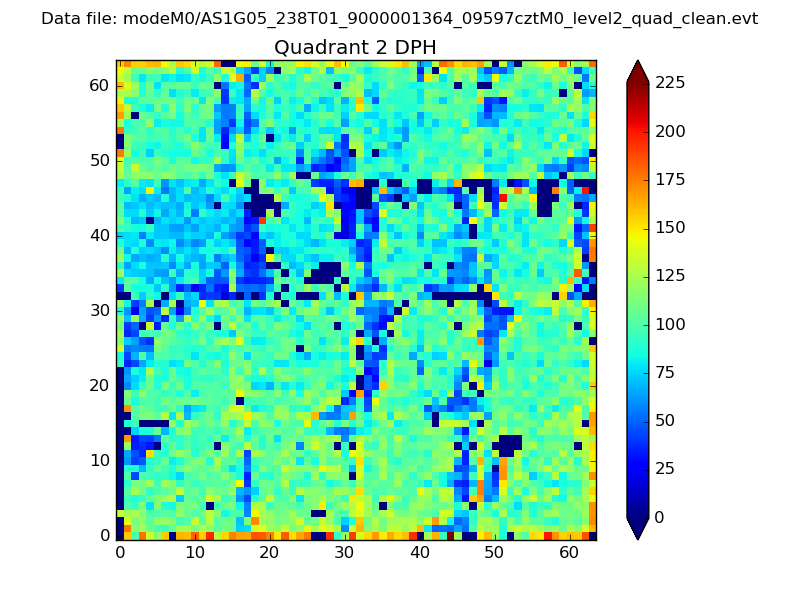 |
Quadrant C |
| Plot type | Count rate plots | Images |
|---|---|---|
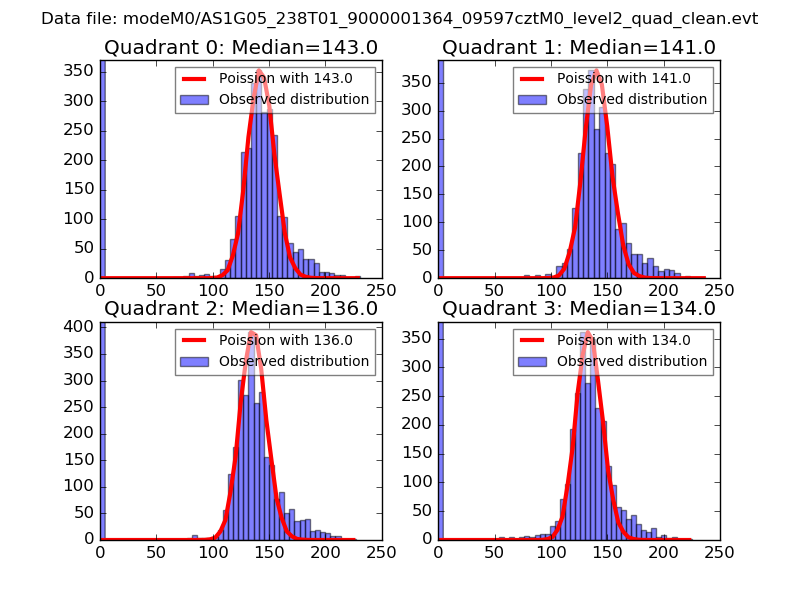
| Comparison with Poisson distribution Blue bars denote a histogram of data divided into 1 sec bins. Red curve is a Poisson curve with rate = median count rate of data. |
 |
 |
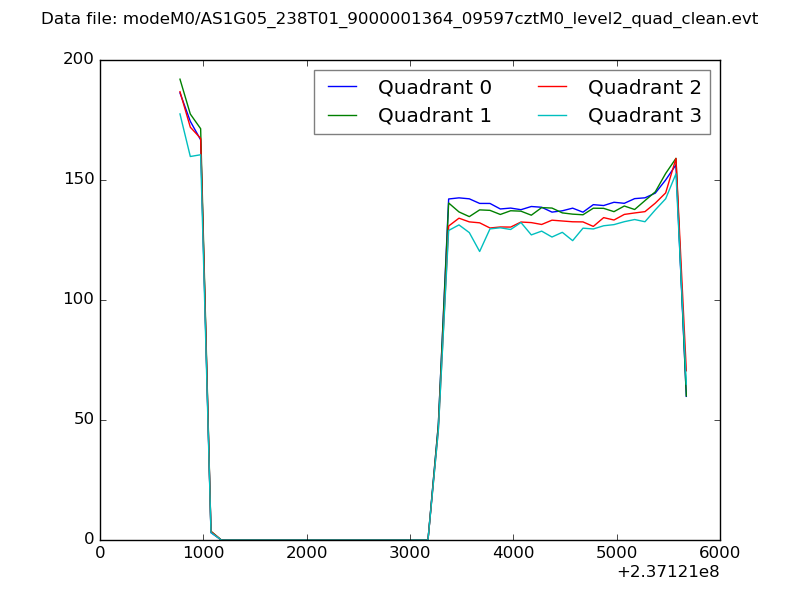
| Quadrant-wise count rates Data is divided into 100 sec bins |
 |
|
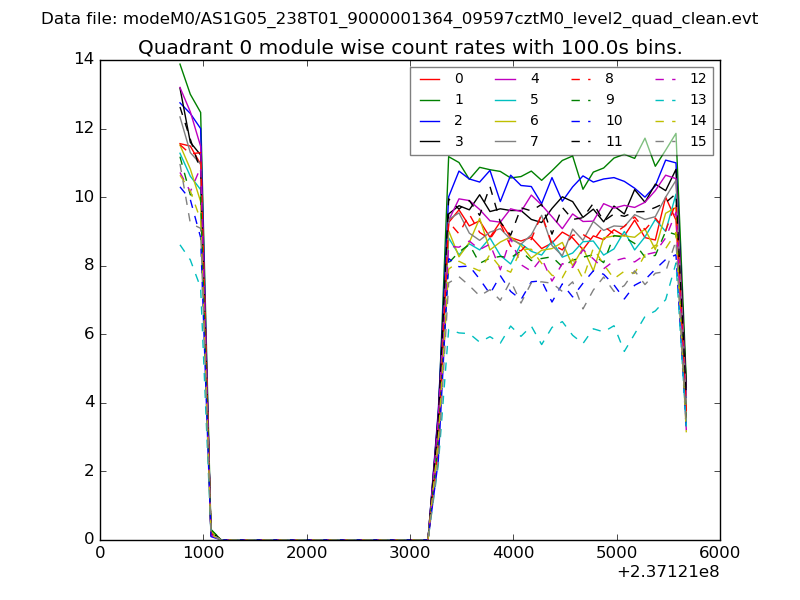
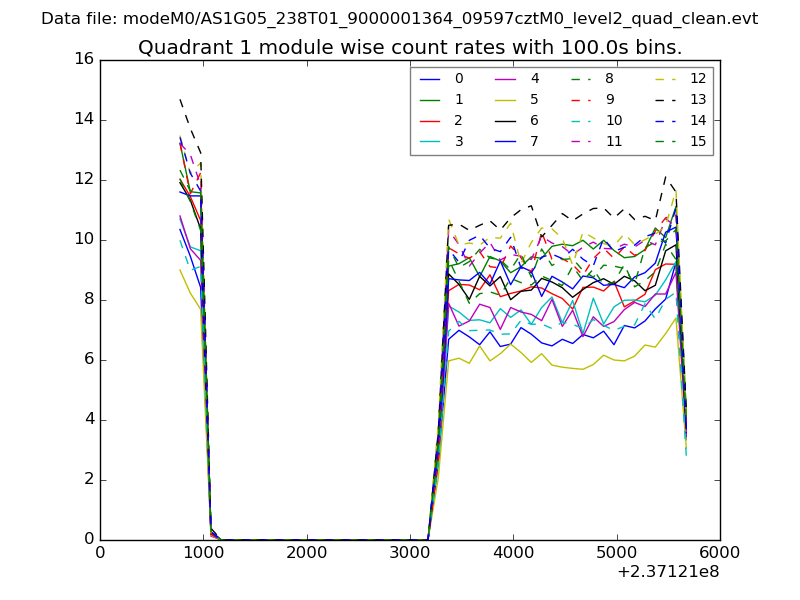
| Module-wise count rates for Quadrant A Data is divided into 100 sec bins |
 |
 |
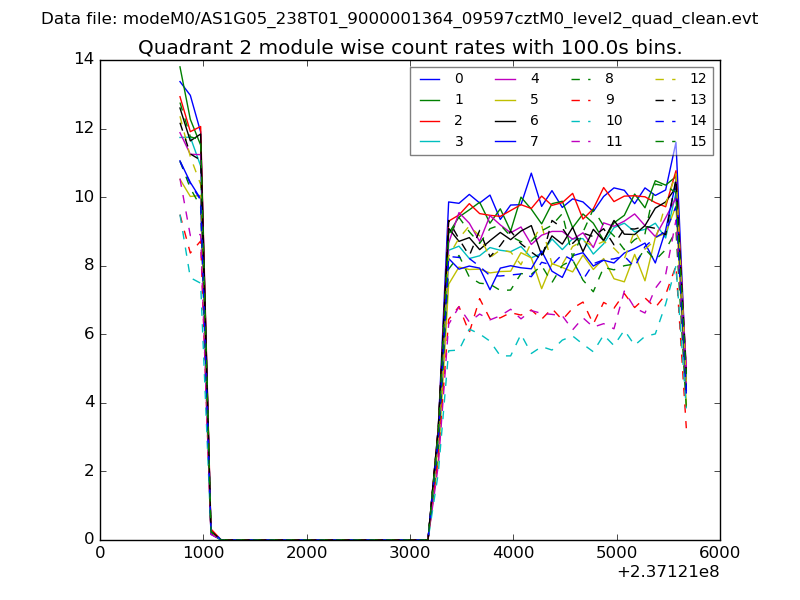
| Module-wise count rates for Quadrant B Data is divided into 100 sec bins |
 |
 |
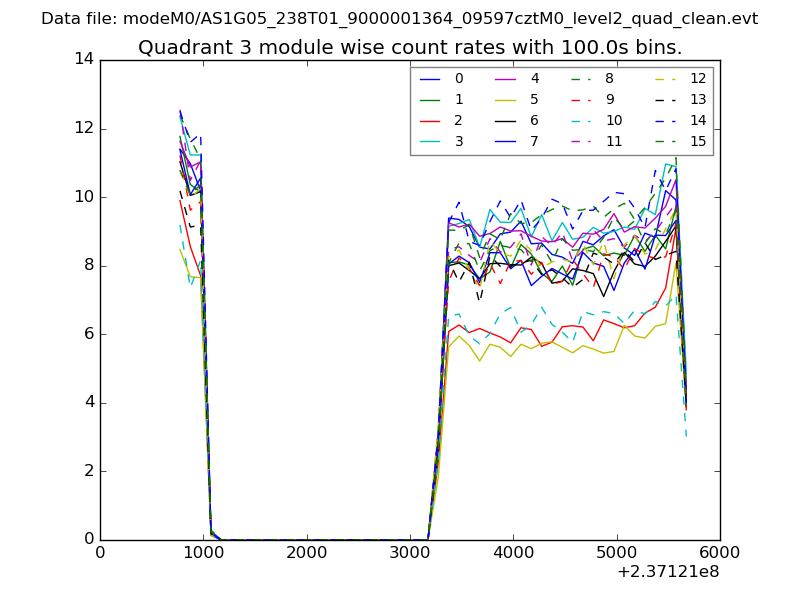
| Module-wise count rates for Quadrant C Data is divided into 100 sec bins |
 |
 |
| Module-wise count rates for Quadrant D Data is divided into 100 sec bins |
 |
 |
| Parameter | Plot |
|---|---|
| CZT HV Monitor | 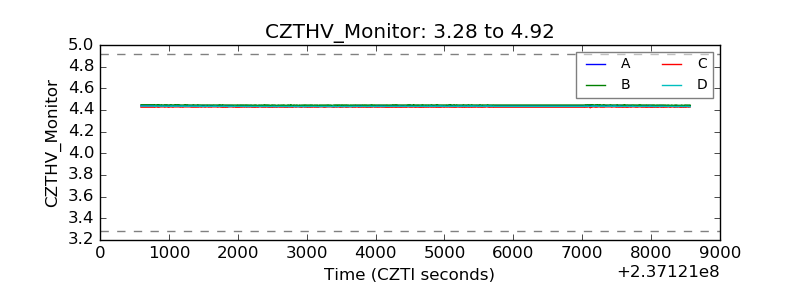 |
| D_VDD | 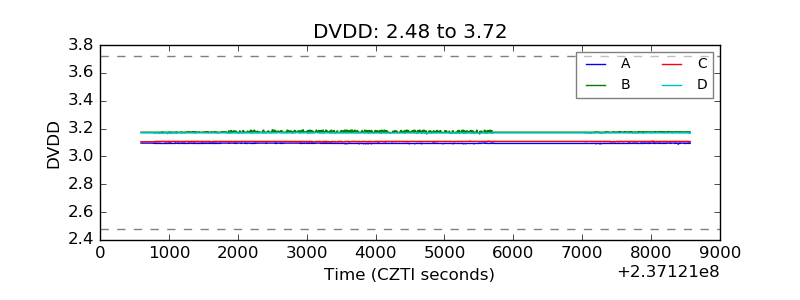 |
| Temperature 1 | 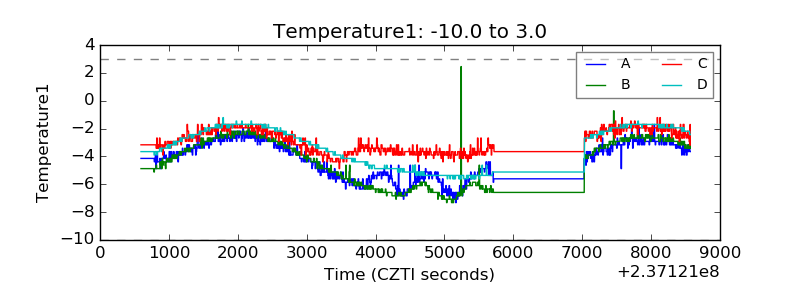 |
| Veto HV Monitor |  |
| Veto LLD | 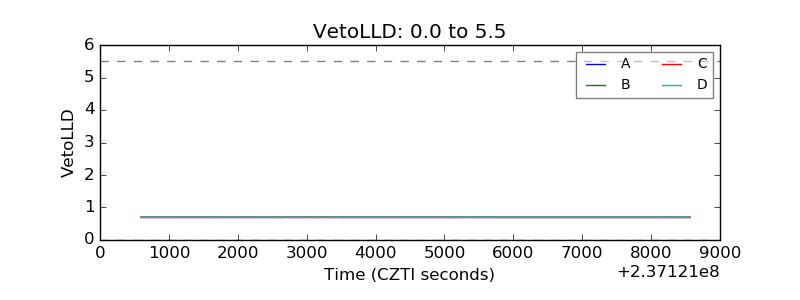 |
| Alpha Counter | 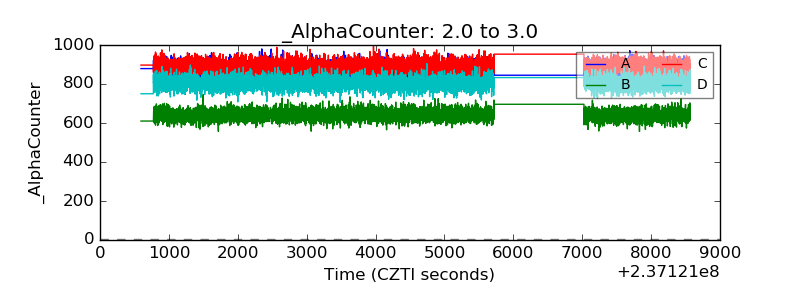 |
| _CPM_Rate | 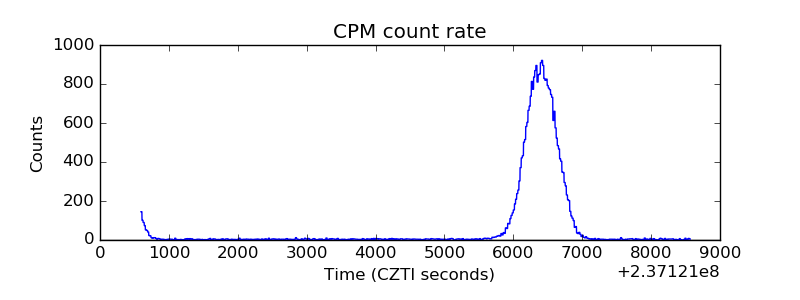 |
| CZT Counter | 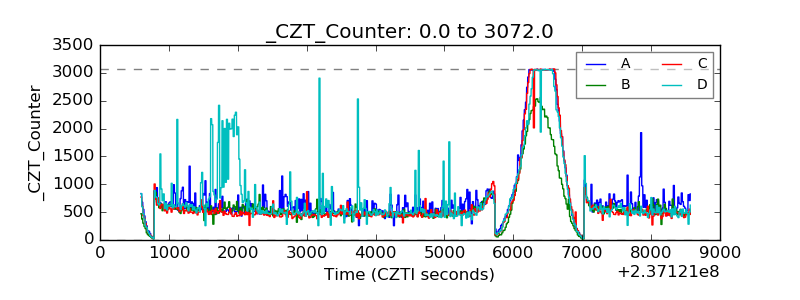 |
| +2.5 Volts monitor |  |
| +5 Volts monitor |  |
| _ROLL_ROT | 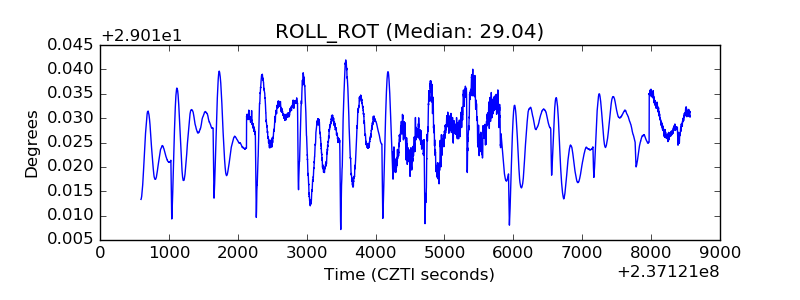 |
| _Roll_DEC | 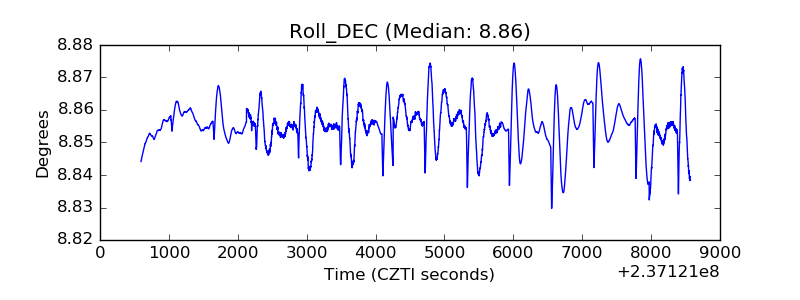 |
| _Roll_RA | 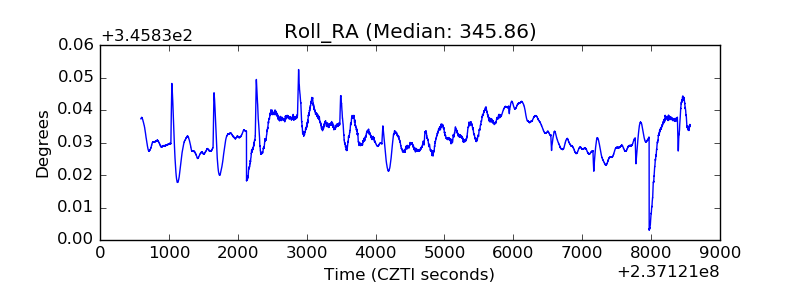 |
| Veto Counter | 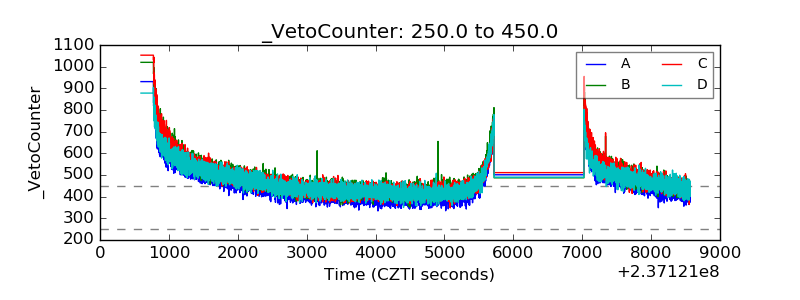 |