| Param | Original file | Final file |
|---|---|---|
| Filename | modeM0/AS1G05_238T01_9000001364_09601cztM0_level2.evt | modeM0/AS1G05_238T01_9000001364_09601cztM0_level2_quad_clean.evt |
| Size (bytes) | 447,318,720 | 79,830,720 |
| Size | 426.6 MB | 76.1 MB |
| Events in quadrant A | 3,276,942 | 499,601 |
| Events in quadrant B | 3,331,663 | 495,250 |
| Events in quadrant C | 3,095,624 | 480,442 |
| Events in quadrant D | 3,379,138 | 467,722 |
| Mode M0 | |||
|---|---|---|---|
| Quadrant | BADHDUFLAG | Total packets | Discarded packets |
| A | 0 | 15705 | 1528 |
| B | 0 | 15946 | 1523 |
| C | 0 | 15321 | 1386 |
| D | 0 | 16065 | 1630 |
| Mode SS | |||
|---|---|---|---|
| Quadrant | BADHDUFLAG | Total packets | Discarded packets |
| A | 0 | 152 | 4 |
| B | 0 | 151 | 11 |
| C | 0 | 152 | 14 |
| D | 0 | 152 | 8 |
| Mode M9 | |||
|---|---|---|---|
| Quadrant | BADHDUFLAG | Total packets | Discarded packets |
| A | 0 | 5 | 0 |
| B | 0 | 5 | 0 |
| C | 0 | 5 | 0 |
| D | 0 | 6 | 0 |
| Quadrant | Total seconds | Saturated seconds | Saturation percentage |
|---|---|---|---|
| A | 6767 | 51 | 0.753657% |
| B | 6798 | 71 | 1.044425% |
| C | 6810 | 33 | 0.484581% |
| D | 6746 | 32 | 0.474355% |
Noise dominated data is calculated using 1-second bins in cleaned event files. If a bin has >2000 counts, and if more than 50% of those come from <1% of pixels, then it is considered to be noise-dominated and hence unusable.
| Quadrant | # 1 sec bins | Bins with >0 counts | Bins with >2000 counts | High rate bins dominated by noise | Noise dominated (total time) | Noise dominated (detector-on time) | Marked lightcurve |
|---|---|---|---|---|---|---|---|
| A | 7798 | 7362 | 0 | 0 | 0.00% | 0.00% | 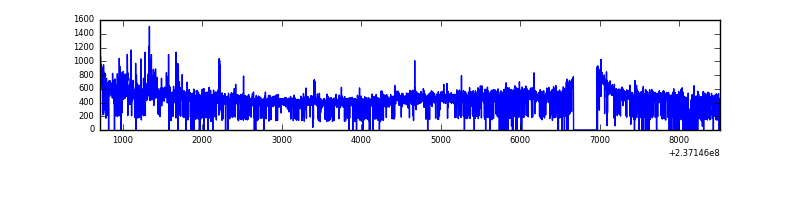 |
| B | 7798 | 7386 | 2 | 2 | 0.03% | 0.03% | 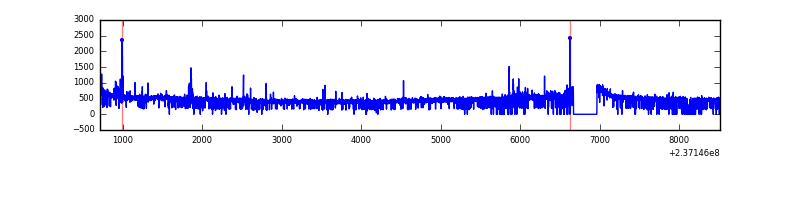 |
| C | 7798 | 7363 | 0 | 0 | 0.00% | 0.00% | 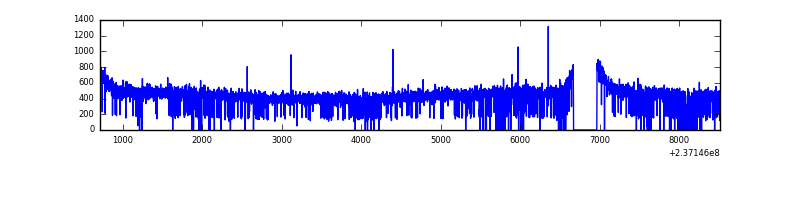 |
| D | 7798 | 7343 | 4 | 4 | 0.05% | 0.05% | 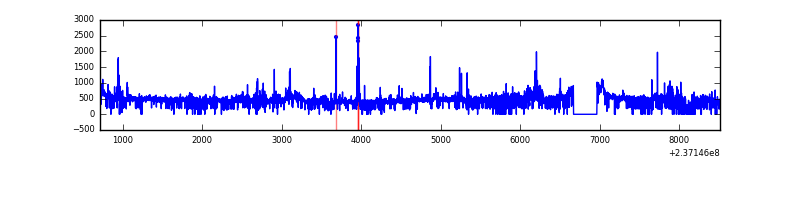 |
Top three noisy pixels from each quadrant. If the there are fewer than three noisy pixels in the level2.evt file, extra rows are filled as -1
| Pixel properties | Quadrant properties | ||||||
|---|---|---|---|---|---|---|---|
| Quadrant | DetID | PixID | Counts | Sigma | Mean | Median | Sigma |
| A | 1 | 162 | 40325 | 236.85 | 820 | 803 | 166.9 |
| A | 8 | 15 | 17927 | 102.62 | 820 | 803 | 166.9 |
| A | 1 | 178 | 16314 | 92.96 | 820 | 803 | 166.9 |
| B | 0 | 214 | 42608 | 266.1 | 821 | 802 | 157.1 |
| B | 4 | 80 | 42457 | 265.14 | 821 | 802 | 157.1 |
| B | 12 | 111 | 17559 | 106.66 | 821 | 802 | 157.1 |
| C | 13 | 61 | 5820 | 27.04 | 793 | 796 | 185.8 |
| C | 14 | 234 | 2274 | 7.96 | 793 | 796 | 185.8 |
| C | 3 | 202 | 1924 | 6.07 | 793 | 796 | 185.8 |
| D | 8 | 195 | 184099 | 956.73 | 785 | 765 | 191.6 |
| D | 10 | 199 | 62875 | 324.12 | 785 | 765 | 191.6 |
| D | 12 | 233 | 39869 | 204.06 | 785 | 765 | 191.6 |
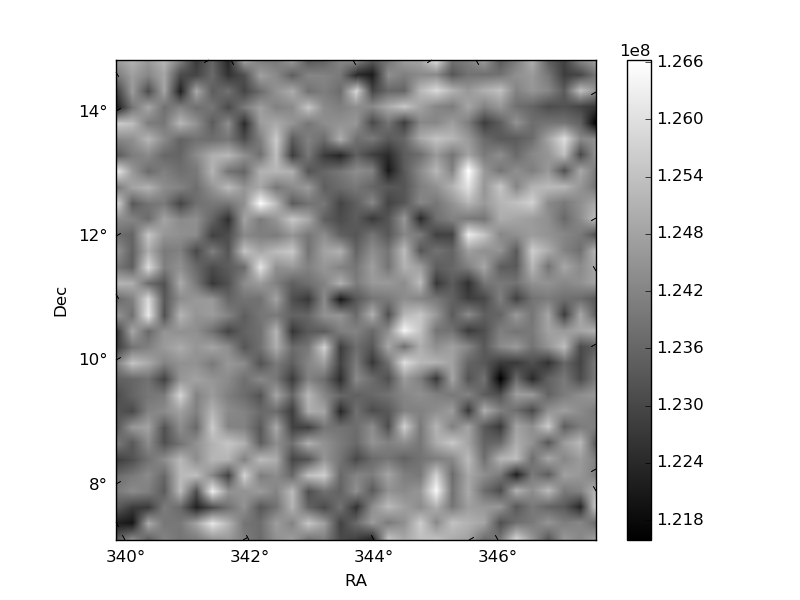
Histogram calculated using DETX and DETY for each event in the final _common_clean file
| Quadrant A | 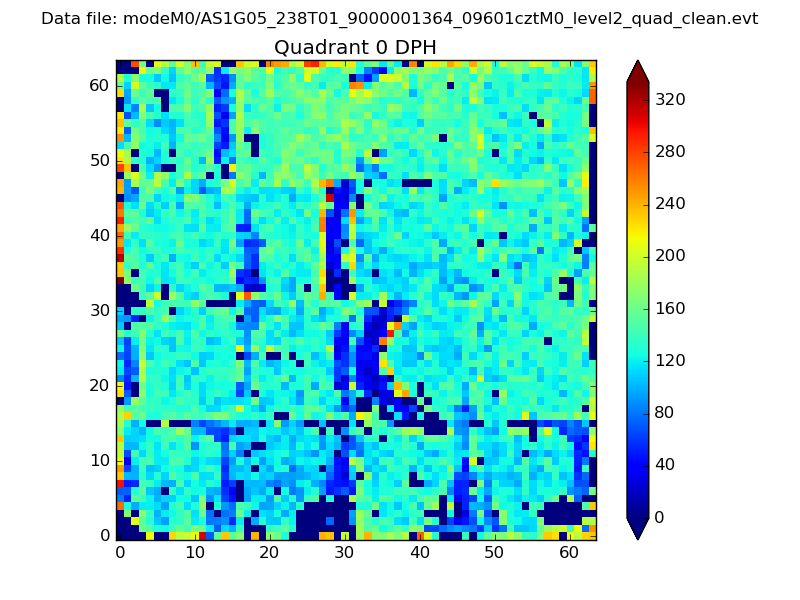 |
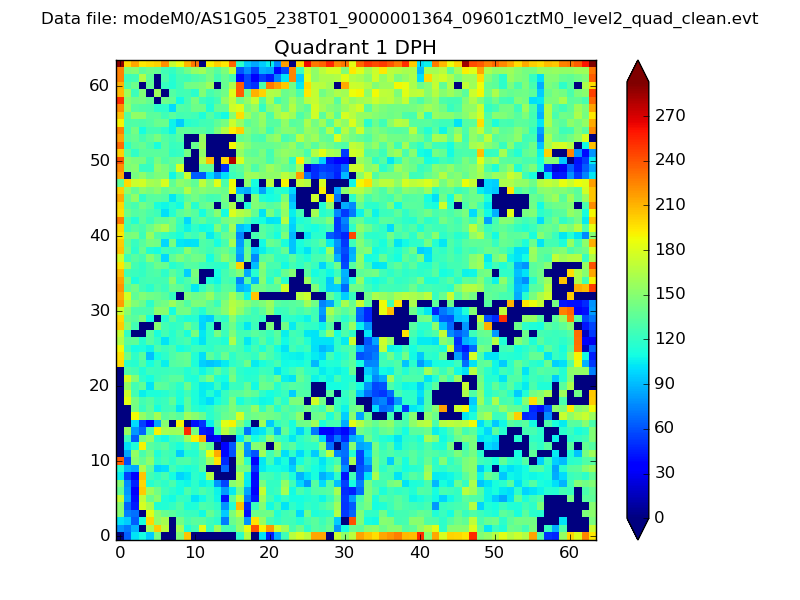 |
Quadrant B |
|---|---|---|---|
| Quadrant D | 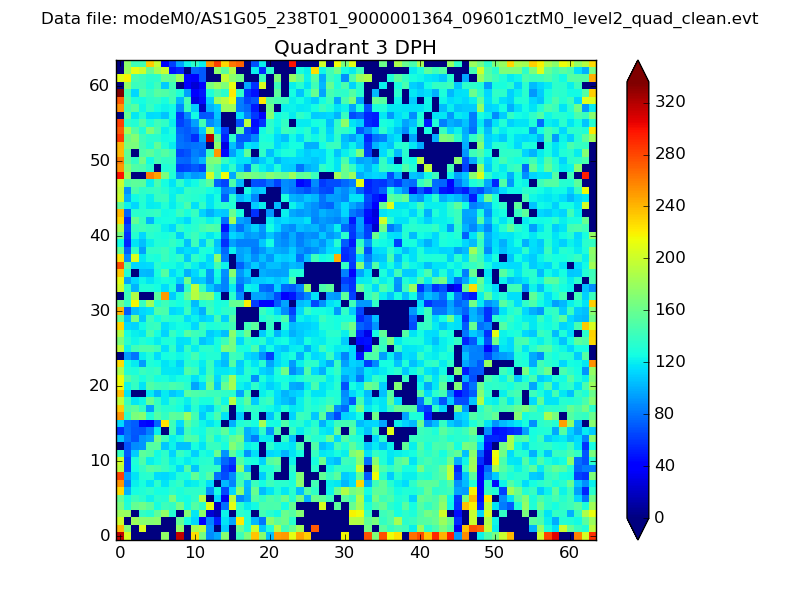 |
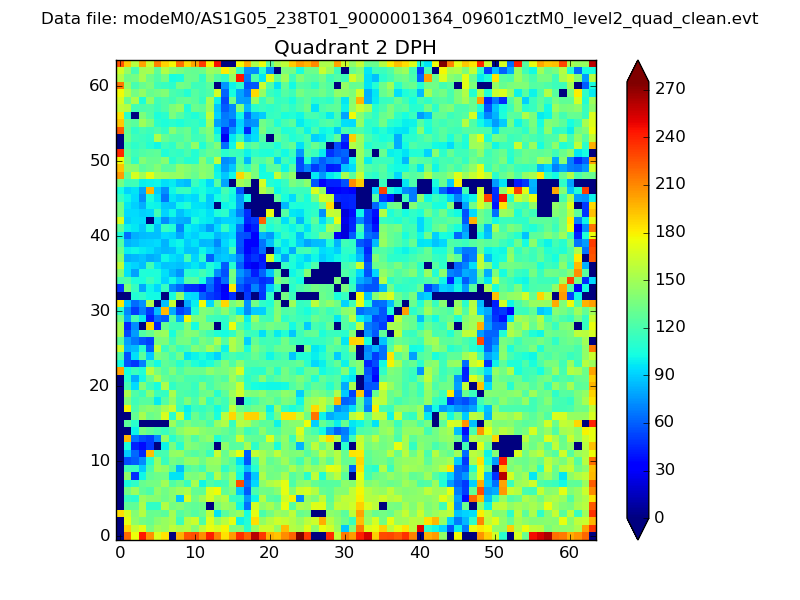 |
Quadrant C |
| Plot type | Count rate plots | Images |
|---|---|---|
| Comparison with Poisson distribution Blue bars denote a histogram of data divided into 1 sec bins. Red curve is a Poisson curve with rate = median count rate of data. |
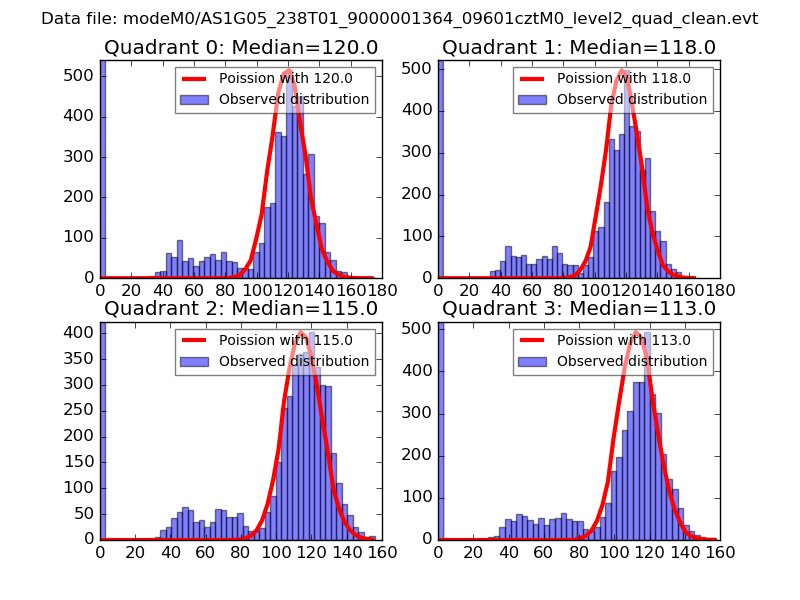 |
 |
| Quadrant-wise count rates Data is divided into 100 sec bins |
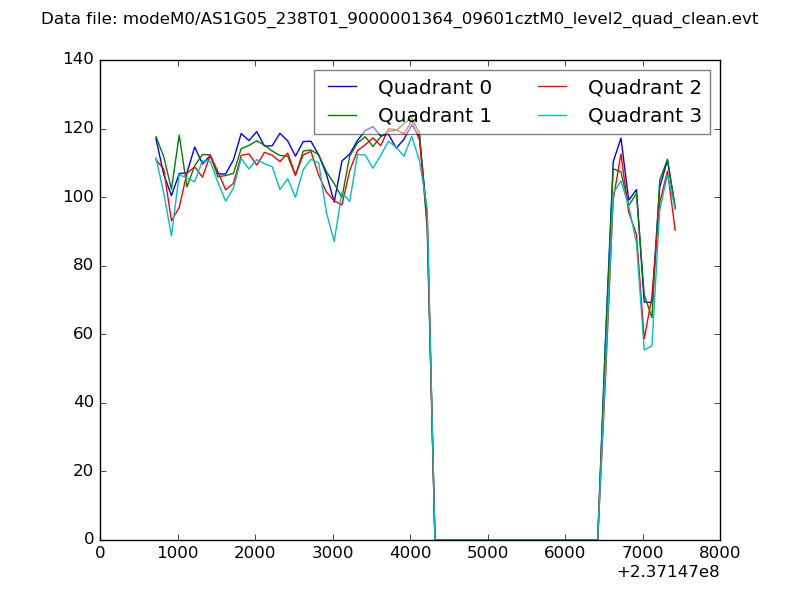 |
|
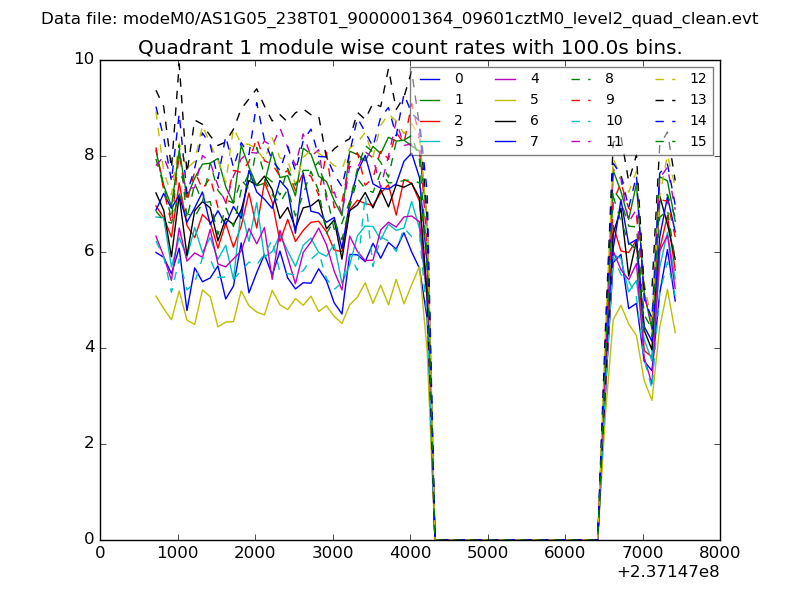
| Module-wise count rates for Quadrant A Data is divided into 100 sec bins |
 |
 |
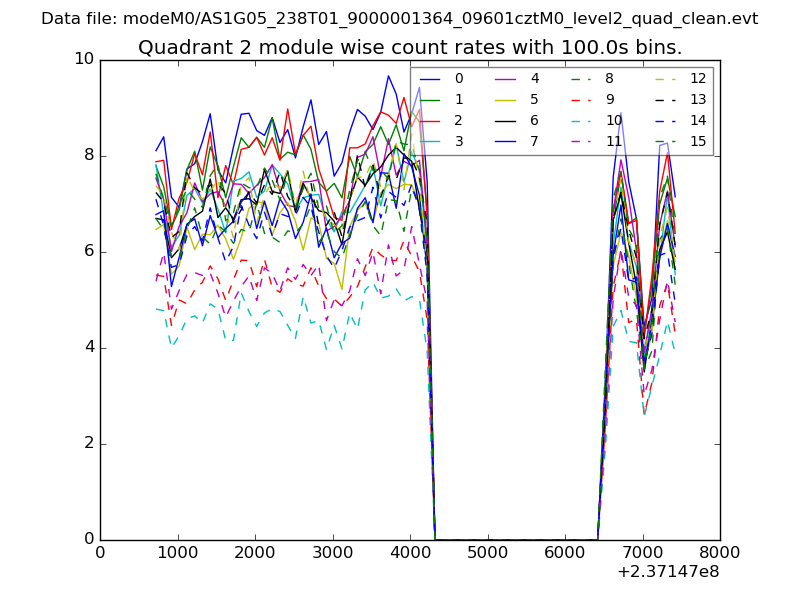
| Module-wise count rates for Quadrant B Data is divided into 100 sec bins |
 |
 |
| Module-wise count rates for Quadrant C Data is divided into 100 sec bins |
 |
 |
| Module-wise count rates for Quadrant D Data is divided into 100 sec bins |
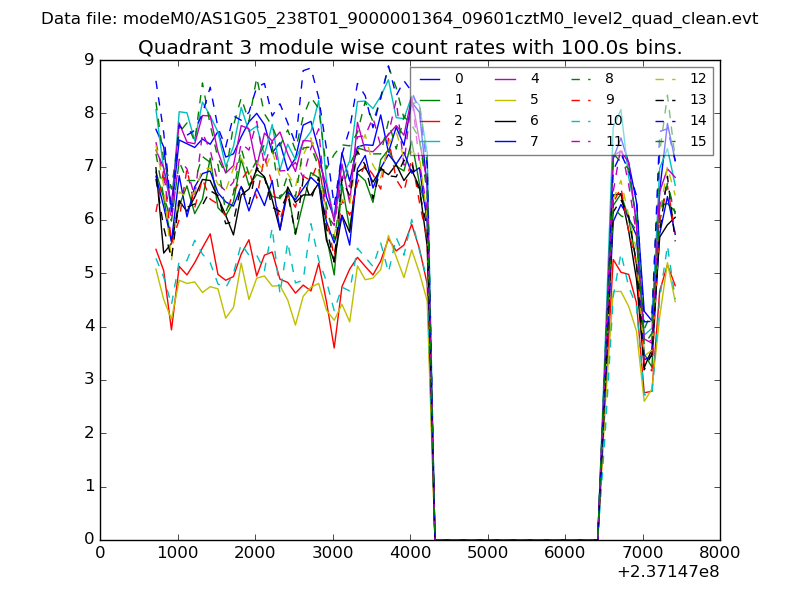 |
 |
| Parameter | Plot |
|---|---|
| CZT HV Monitor | 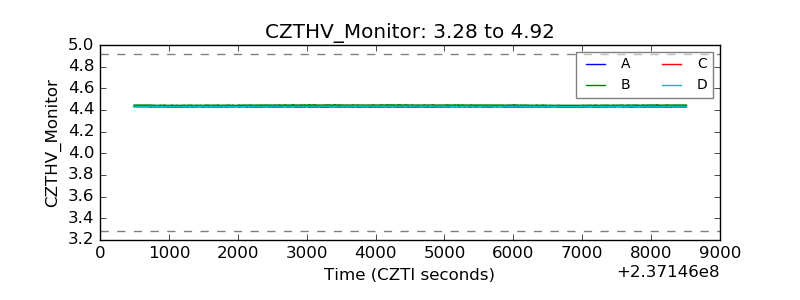 |
| D_VDD | 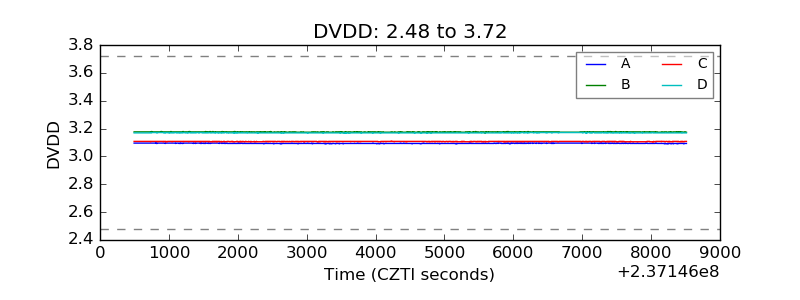 |
| Temperature 1 |  |
| Veto HV Monitor | 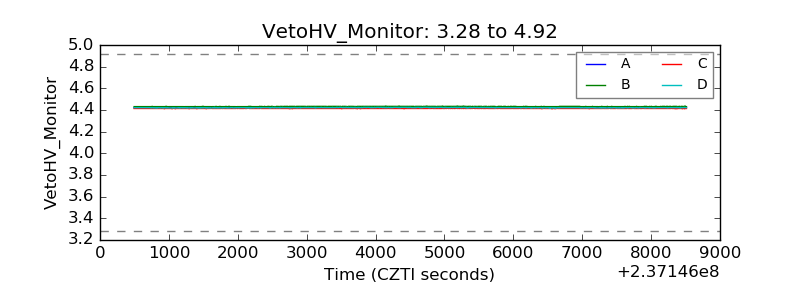 |
| Veto LLD | 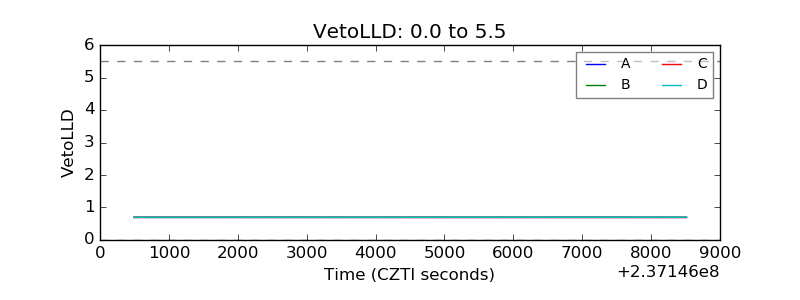 |
| Alpha Counter | 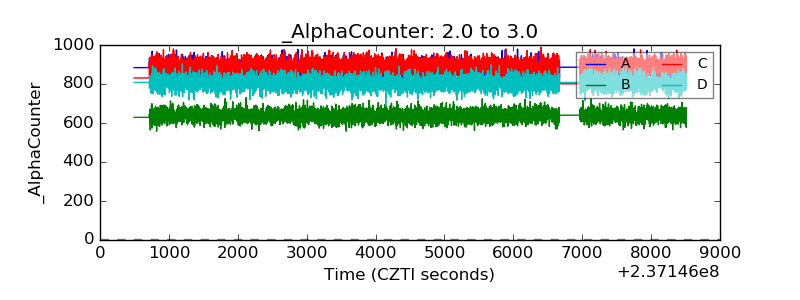 |
| _CPM_Rate | 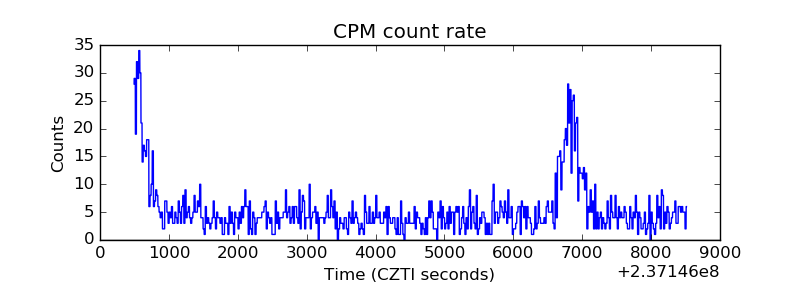 |
| CZT Counter | 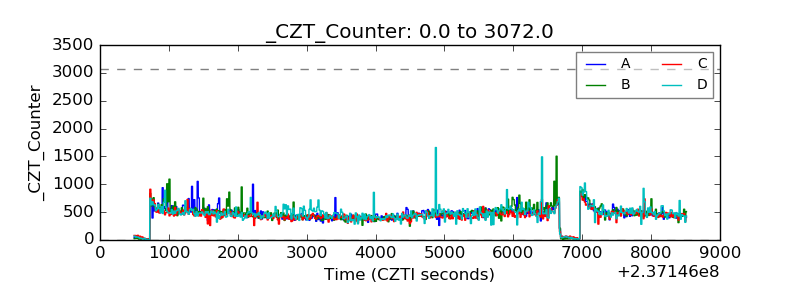 |
| +2.5 Volts monitor |  |
| +5 Volts monitor |  |
| _ROLL_ROT | 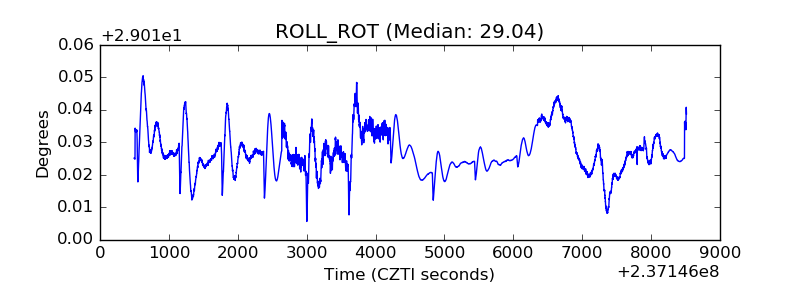 |
| _Roll_DEC | 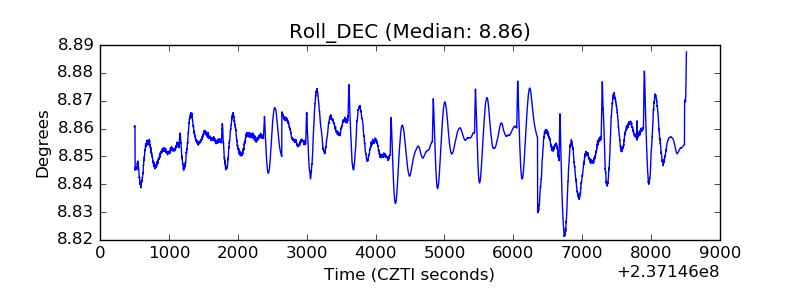 |
| _Roll_RA | 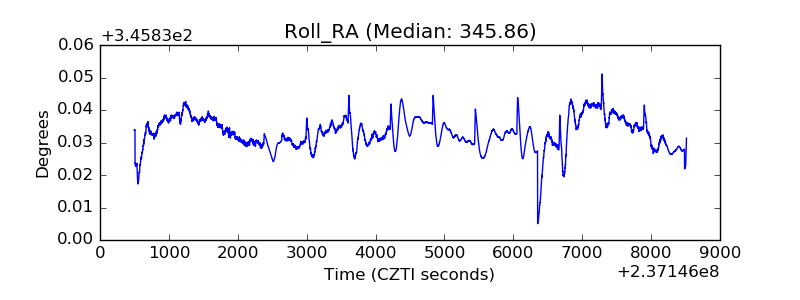 |
| Veto Counter |  |