| Param | Original file | Final file |
|---|---|---|
| Filename | modeM0/AS1G05_238T01_9000001364_09604cztM0_level2.evt | modeM0/AS1G05_238T01_9000001364_09604cztM0_level2_quad_clean.evt |
| Size (bytes) | 719,611,200 | 130,982,400 |
| Size | 686.3 MB | 124.9 MB |
| Events in quadrant A | 5,038,915 | 824,544 |
| Events in quadrant B | 5,067,788 | 816,693 |
| Events in quadrant C | 4,953,982 | 806,992 |
| Events in quadrant D | 5,998,485 | 769,909 |
| Mode M0 | |||
|---|---|---|---|
| Quadrant | BADHDUFLAG | Total packets | Discarded packets |
| A | 0 | 26469 | 4188 |
| B | 0 | 26628 | 4258 |
| C | 0 | 26553 | 4174 |
| D | 0 | 30463 | 5273 |
| Mode SS | |||
|---|---|---|---|
| Quadrant | BADHDUFLAG | Total packets | Discarded packets |
| A | 0 | 262 | 46 |
| B | 0 | 262 | 54 |
| C | 0 | 261 | 37 |
| D | 0 | 262 | 34 |
| Mode M9 | |||
|---|---|---|---|
| Quadrant | BADHDUFLAG | Total packets | Discarded packets |
| A | 0 | 12 | 1 |
| B | 0 | 12 | 0 |
| C | 0 | 12 | 2 |
| D | 0 | 13 | 1 |
| Quadrant | Total seconds | Saturated seconds | Saturation percentage |
|---|---|---|---|
| A | 10820 | 54 | 0.499076% |
| B | 10808 | 88 | 0.814212% |
| C | 10854 | 70 | 0.644924% |
| D | 10700 | 113 | 1.056075% |
Noise dominated data is calculated using 1-second bins in cleaned event files. If a bin has >2000 counts, and if more than 50% of those come from <1% of pixels, then it is considered to be noise-dominated and hence unusable.
| Quadrant | # 1 sec bins | Bins with >0 counts | Bins with >2000 counts | High rate bins dominated by noise | Noise dominated (total time) | Noise dominated (detector-on time) | Marked lightcurve |
|---|---|---|---|---|---|---|---|
| A | 14083 | 11885 | 0 | 0 | 0.00% | 0.00% | 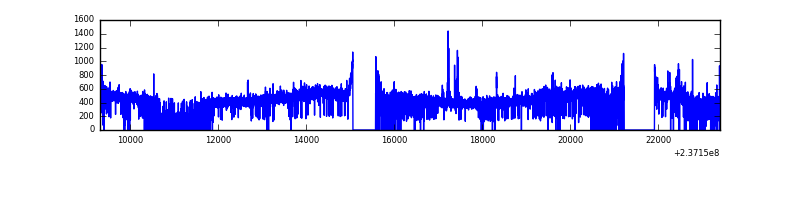 |
| B | 14083 | 11831 | 2 | 2 | 0.01% | 0.02% | 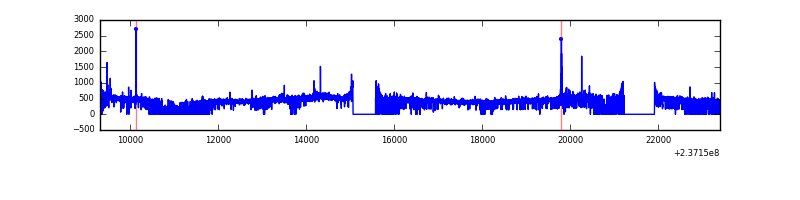 |
| C | 14083 | 11884 | 18 | 18 | 0.13% | 0.15% | 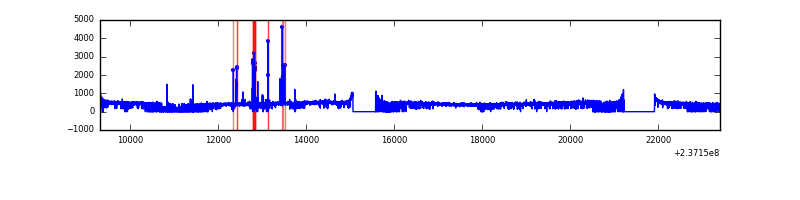 |
| D | 14083 | 11777 | 44 | 44 | 0.31% | 0.37% | 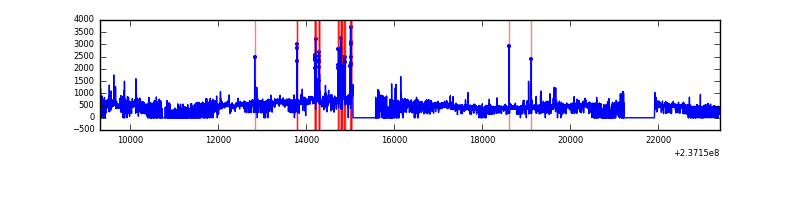 |
Top three noisy pixels from each quadrant. If the there are fewer than three noisy pixels in the level2.evt file, extra rows are filled as -1
| Pixel properties | Quadrant properties | ||||||
|---|---|---|---|---|---|---|---|
| Quadrant | DetID | PixID | Counts | Sigma | Mean | Median | Sigma |
| A | 1 | 162 | 37154 | 137.88 | 1283 | 1255 | 260.4 |
| A | 8 | 157 | 20997 | 75.83 | 1283 | 1255 | 260.4 |
| A | 1 | 178 | 15733 | 55.61 | 1283 | 1255 | 260.4 |
| B | 0 | 214 | 50217 | 198.58 | 1276 | 1245 | 246.6 |
| B | 12 | 111 | 28517 | 110.59 | 1276 | 1245 | 246.6 |
| B | 11 | 111 | 23192 | 88.99 | 1276 | 1245 | 246.6 |
| C | 14 | 234 | 121443 | 416.21 | 1239 | 1248 | 288.8 |
| C | 13 | 61 | 9251 | 27.71 | 1239 | 1248 | 288.8 |
| C | 14 | 67 | 5261 | 13.9 | 1239 | 1248 | 288.8 |
| D | 8 | 195 | 1019517 | 3343.98 | 1211 | 1177 | 304.5 |
| D | 1 | 52 | 192459 | 628.12 | 1211 | 1177 | 304.5 |
| D | 13 | 122 | 48630 | 155.82 | 1211 | 1177 | 304.5 |
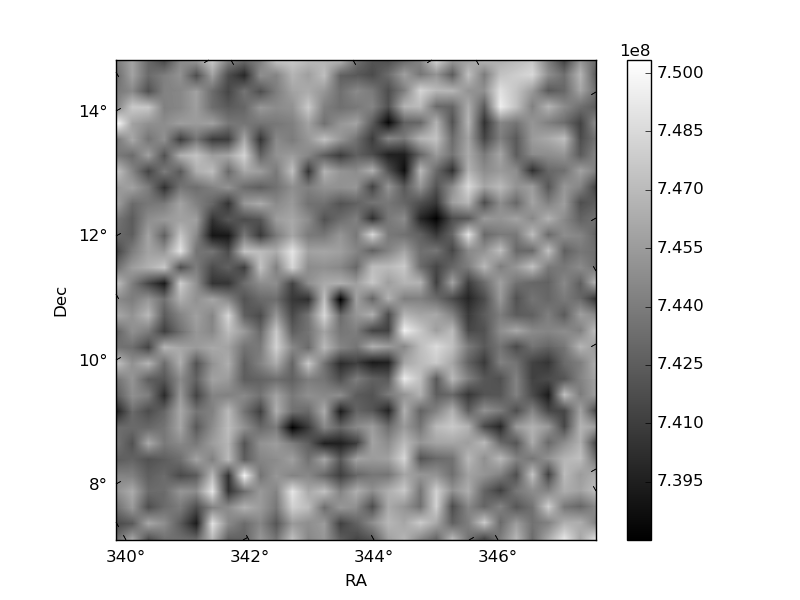
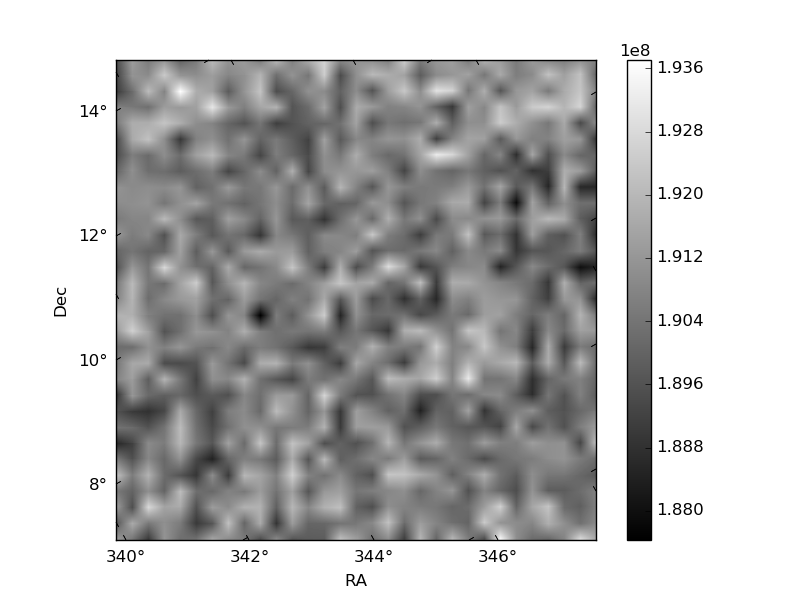
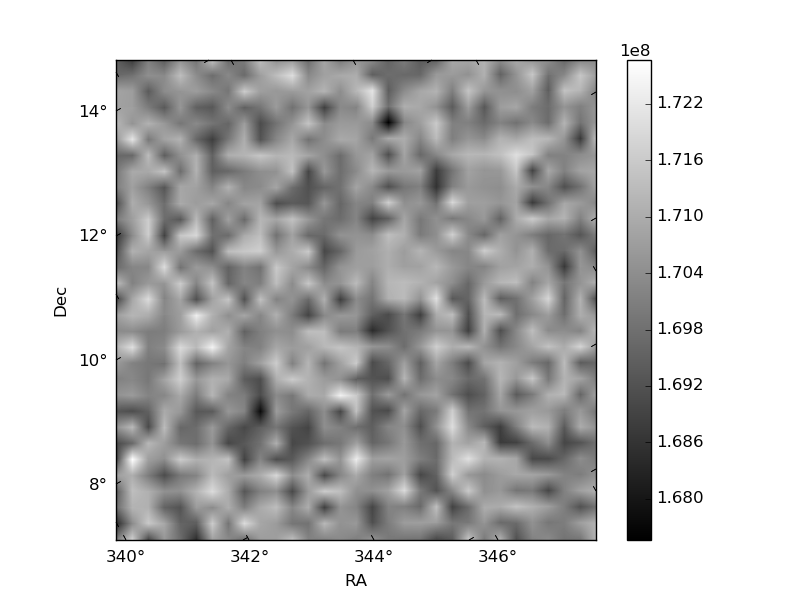
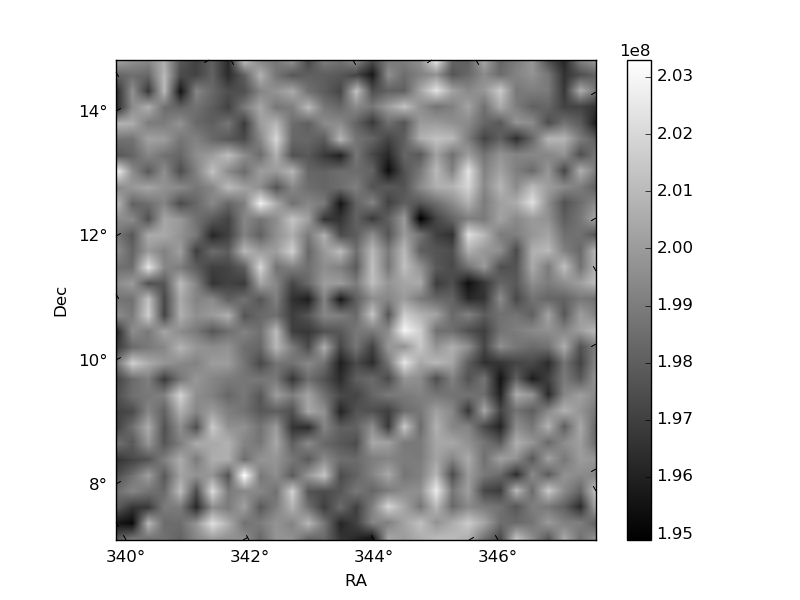
Histogram calculated using DETX and DETY for each event in the final _common_clean file
| Quadrant A | 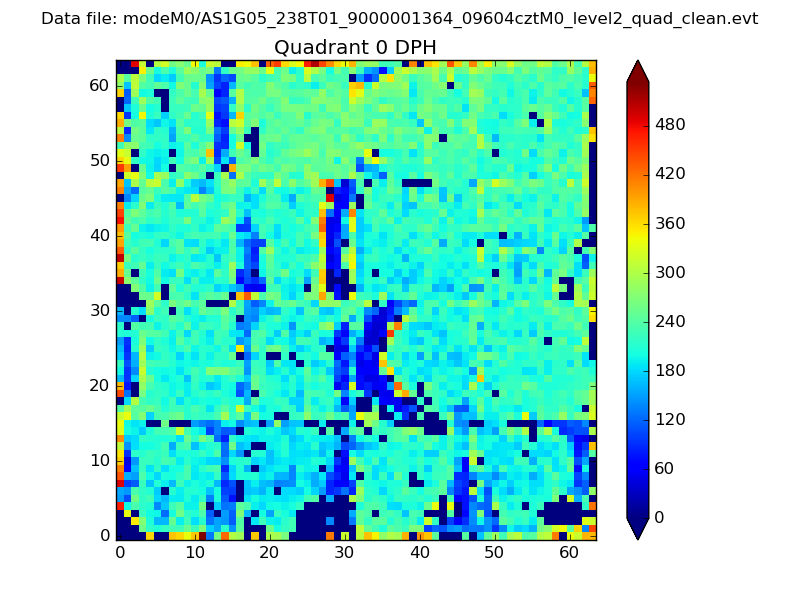 |
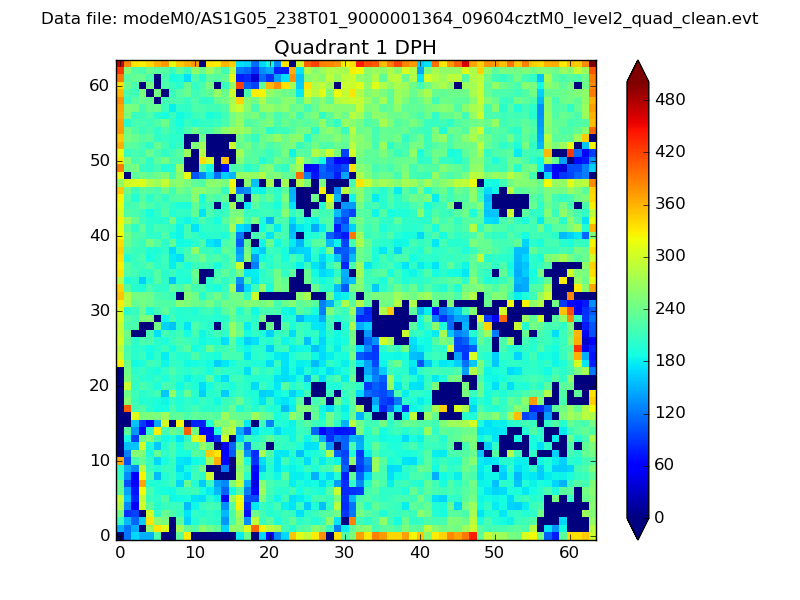 |
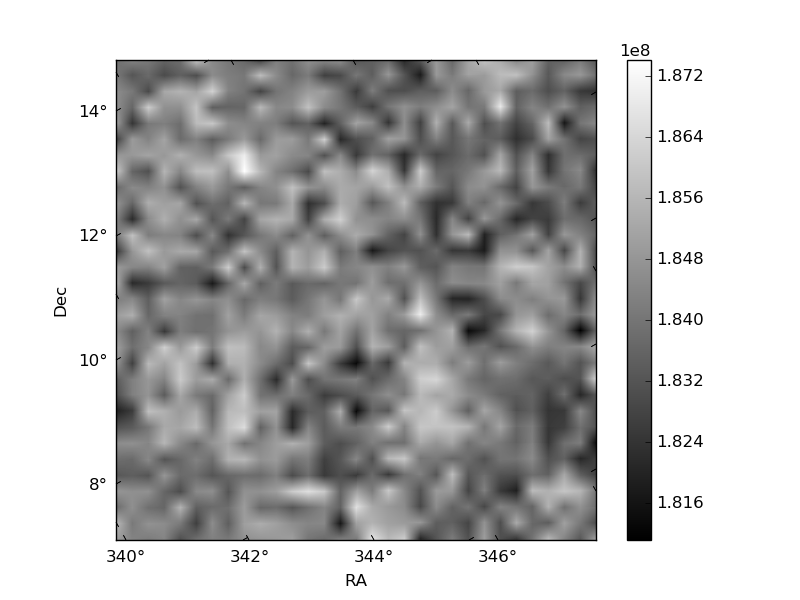
Quadrant B |
|---|---|---|---|
| Quadrant D | 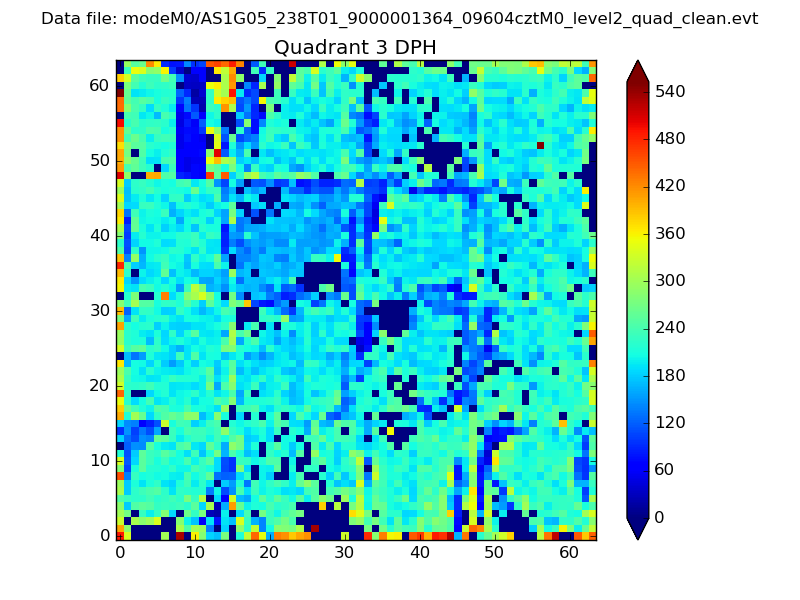 |
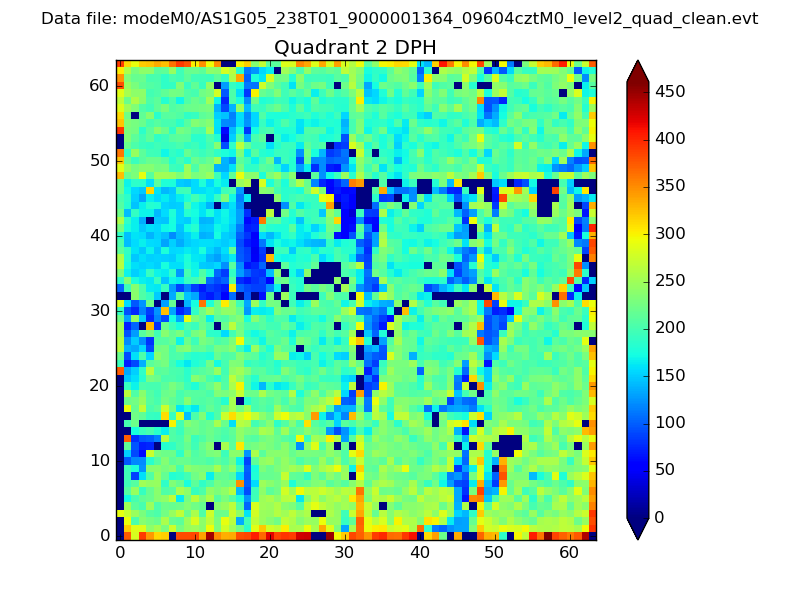 |
Quadrant C |
| Plot type | Count rate plots | Images |
|---|---|---|
| Comparison with Poisson distribution Blue bars denote a histogram of data divided into 1 sec bins. Red curve is a Poisson curve with rate = median count rate of data. |
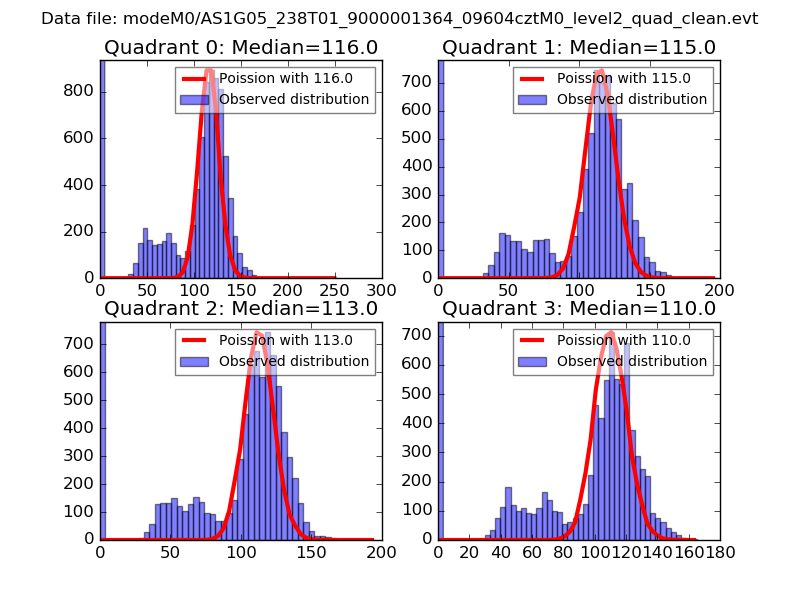 |
 |
| Quadrant-wise count rates Data is divided into 100 sec bins |
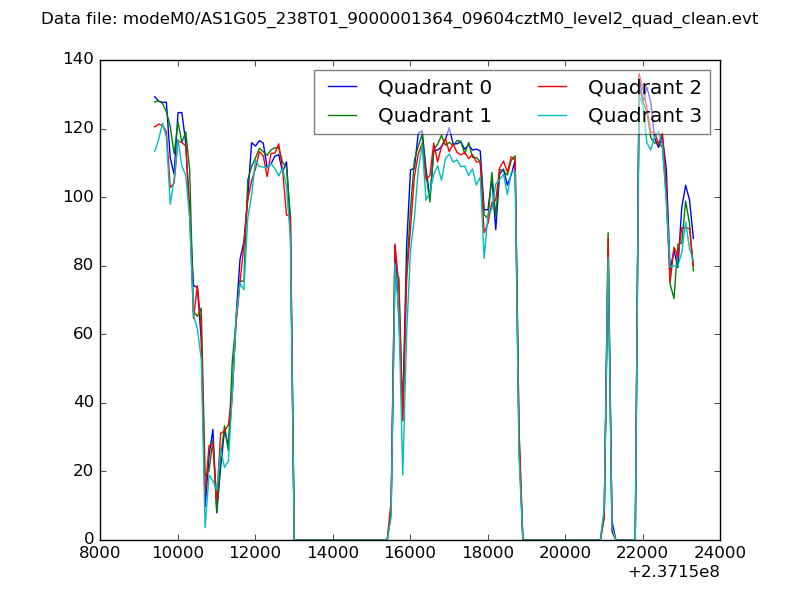 |
|
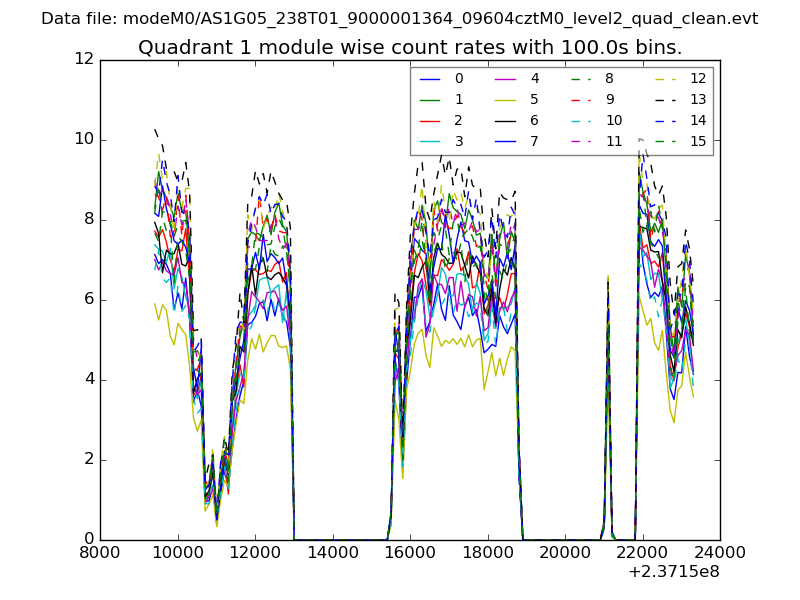
| Module-wise count rates for Quadrant A Data is divided into 100 sec bins |
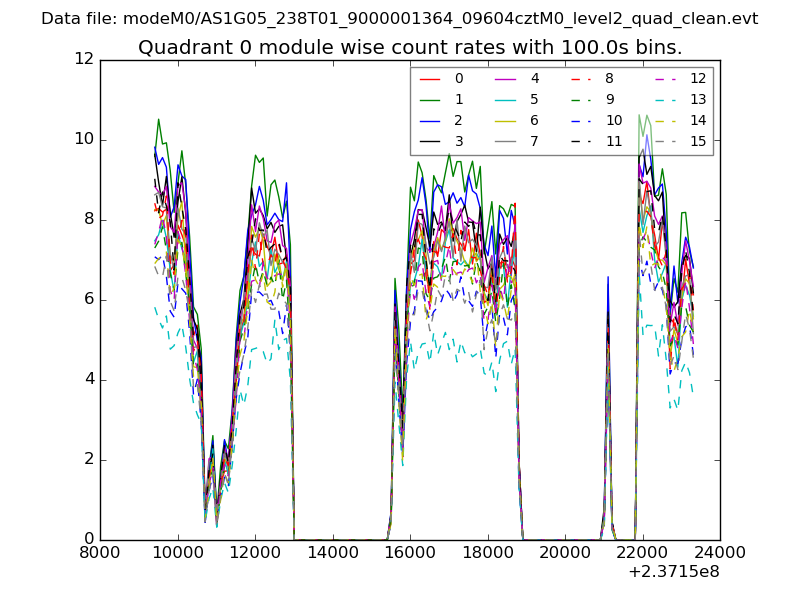 |
 |
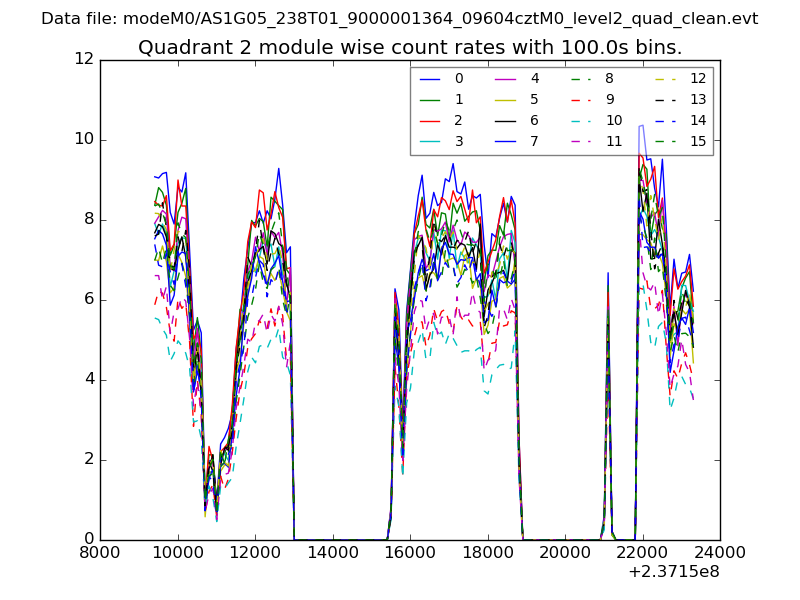
| Module-wise count rates for Quadrant B Data is divided into 100 sec bins |
 |
 |
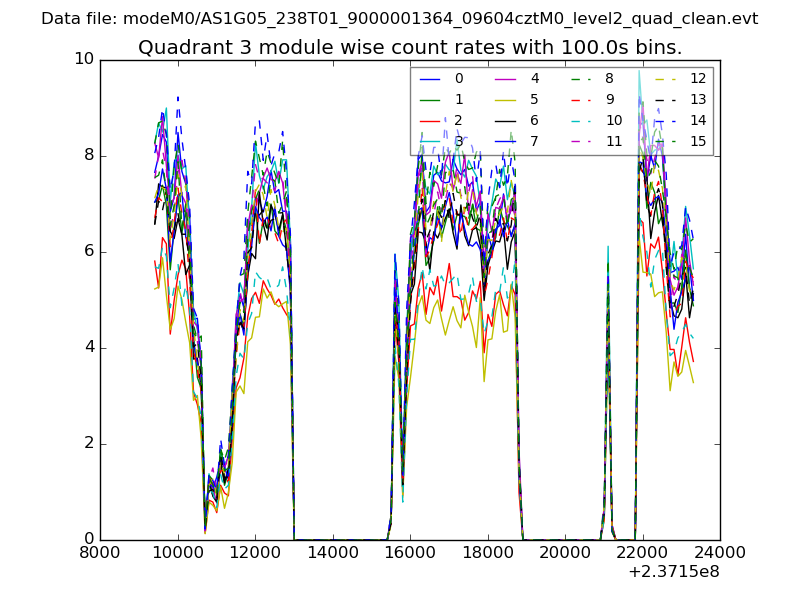
| Module-wise count rates for Quadrant C Data is divided into 100 sec bins |
 |
 |
| Module-wise count rates for Quadrant D Data is divided into 100 sec bins |
 |
 |
| Parameter | Plot |
|---|---|
| CZT HV Monitor | 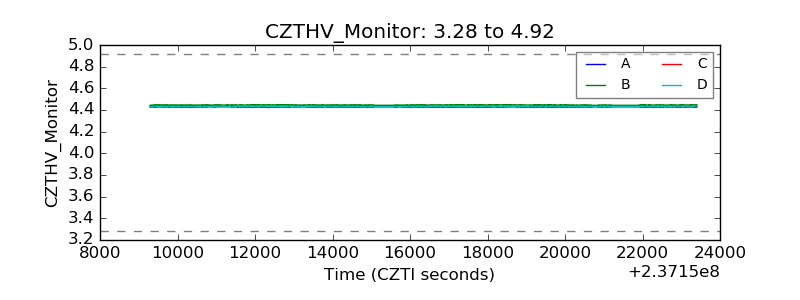 |
| D_VDD | 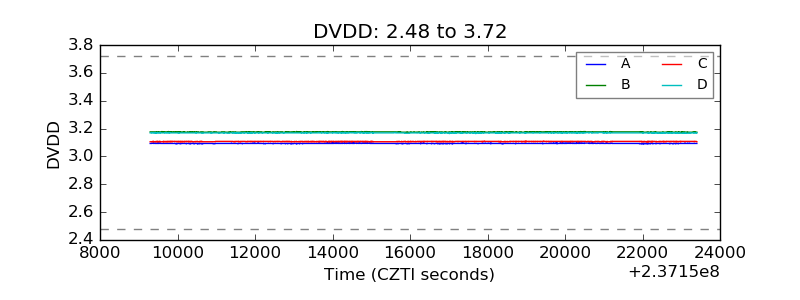 |
| Temperature 1 | 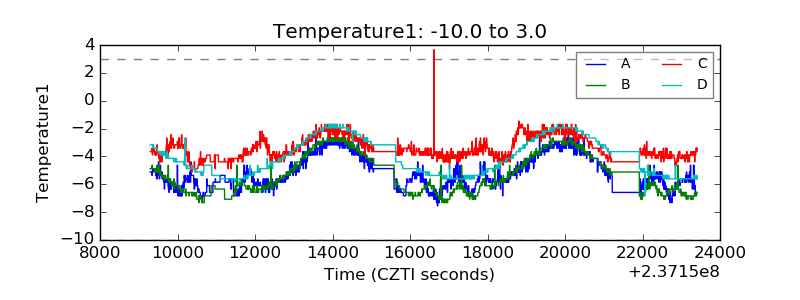 |
| Veto HV Monitor | 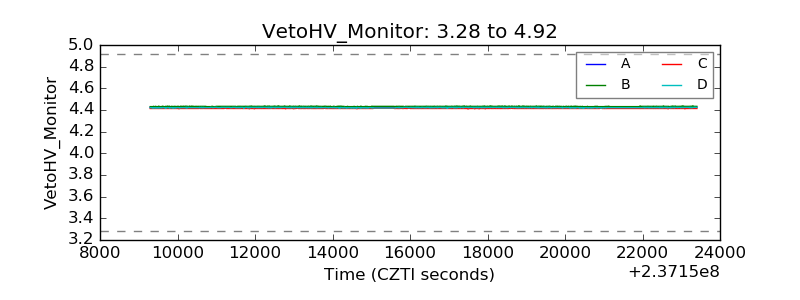 |
| Veto LLD | 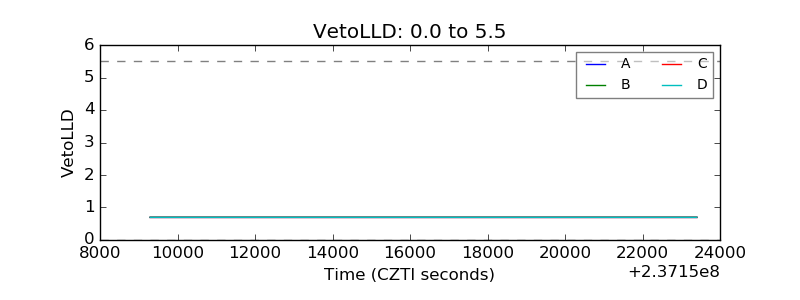 |
| Alpha Counter | 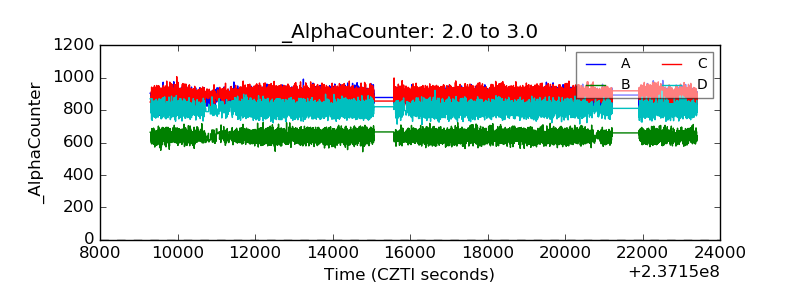 |
| _CPM_Rate | 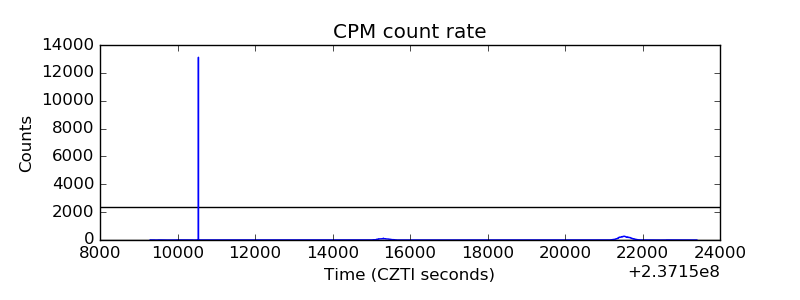 |
| CZT Counter | 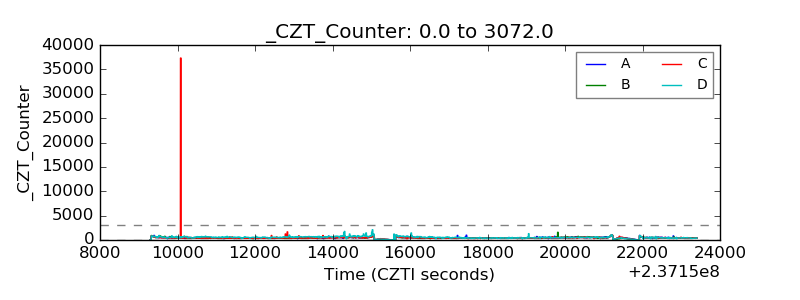 |
| +2.5 Volts monitor |  |
| +5 Volts monitor |  |
| _ROLL_ROT |  |
| _Roll_DEC | 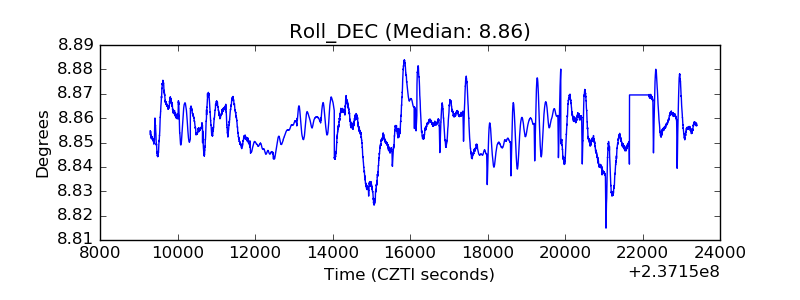 |
| _Roll_RA | 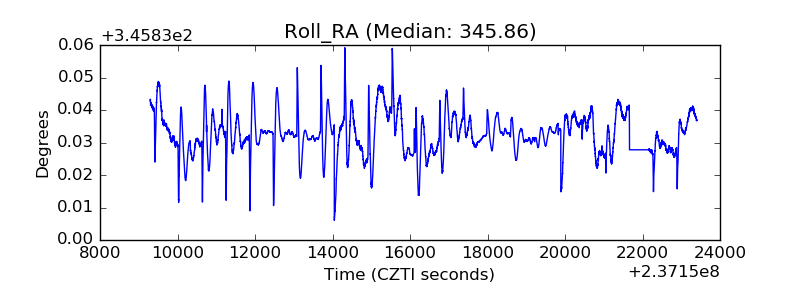 |
| Veto Counter | 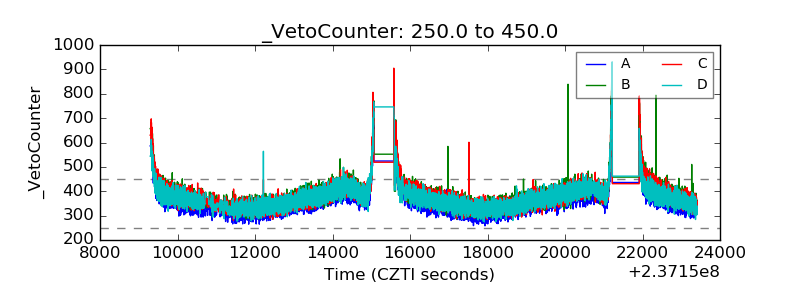 |