| Param | Original file | Final file |
|---|---|---|
| Filename | modeM0/AS1G05_238T01_9000001364_09605cztM0_level2.evt | modeM0/AS1G05_238T01_9000001364_09605cztM0_level2_quad_clean.evt |
| Size (bytes) | 454,564,800 | 90,354,240 |
| Size | 433.5 MB | 86.2 MB |
| Events in quadrant A | 3,330,619 | 572,126 |
| Events in quadrant B | 3,385,474 | 570,211 |
| Events in quadrant C | 3,200,010 | 556,125 |
| Events in quadrant D | 3,366,075 | 541,762 |
| Mode M0 | |||
|---|---|---|---|
| Quadrant | BADHDUFLAG | Total packets | Discarded packets |
| A | 0 | 15046 | 347 |
| B | 0 | 15136 | 294 |
| C | 0 | 14894 | 360 |
| D | 0 | 15239 | 335 |
| Mode SS | |||
|---|---|---|---|
| Quadrant | BADHDUFLAG | Total packets | Discarded packets |
| A | 0 | 148 | 2 |
| B | 0 | 148 | 6 |
| C | 0 | 148 | 0 |
| D | 0 | 148 | 8 |
| Mode M9 | |||
|---|---|---|---|
| Quadrant | BADHDUFLAG | Total packets | Discarded packets |
| A | 0 | 16 | 0 |
| B | 0 | 16 | 0 |
| C | 0 | 16 | 0 |
| D | 0 | 16 | 0 |
| Quadrant | Total seconds | Saturated seconds | Saturation percentage |
|---|---|---|---|
| A | 7119 | 71 | 0.997331% |
| B | 7144 | 100 | 1.399776% |
| C | 7114 | 64 | 0.899635% |
| D | 7128 | 67 | 0.939955% |
Noise dominated data is calculated using 1-second bins in cleaned event files. If a bin has >2000 counts, and if more than 50% of those come from <1% of pixels, then it is considered to be noise-dominated and hence unusable.
| Quadrant | # 1 sec bins | Bins with >0 counts | Bins with >2000 counts | High rate bins dominated by noise | Noise dominated (total time) | Noise dominated (detector-on time) | Marked lightcurve |
|---|---|---|---|---|---|---|---|
| A | 8878 | 7271 | 0 | 0 | 0.00% | 0.00% | 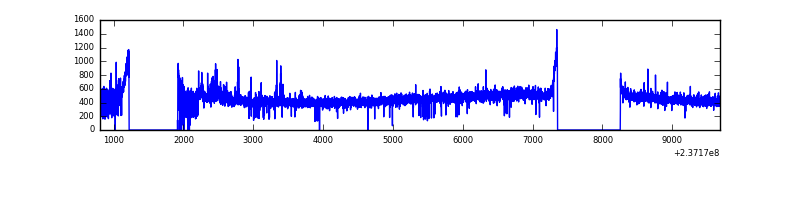 |
| B | 8878 | 7268 | 4 | 4 | 0.05% | 0.06% | 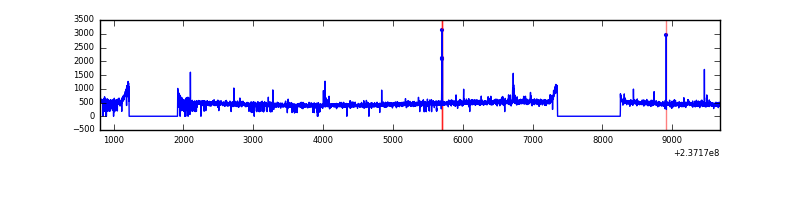 |
| C | 8878 | 7264 | 0 | 0 | 0.00% | 0.00% | 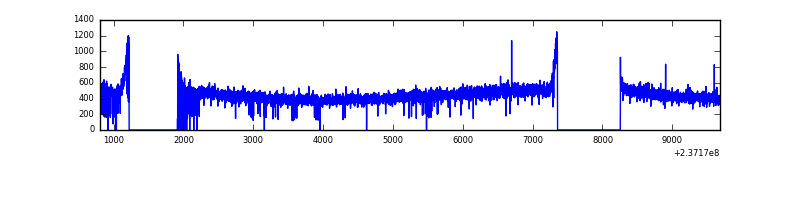 |
| D | 8878 | 7261 | 2 | 2 | 0.02% | 0.03% | 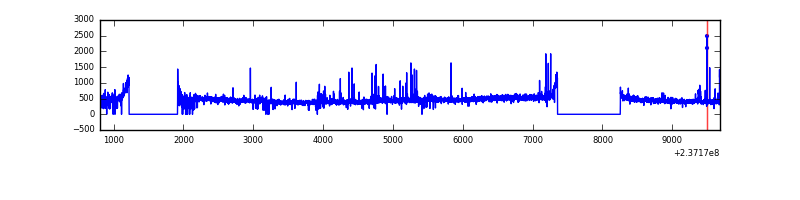 |
Top three noisy pixels from each quadrant. If the there are fewer than three noisy pixels in the level2.evt file, extra rows are filled as -1
| Pixel properties | Quadrant properties | ||||||
|---|---|---|---|---|---|---|---|
| Quadrant | DetID | PixID | Counts | Sigma | Mean | Median | Sigma |
| A | 1 | 162 | 30581 | 171.15 | 848 | 829 | 173.8 |
| A | 1 | 178 | 12246 | 65.68 | 848 | 829 | 173.8 |
| A | 1 | 161 | 11471 | 61.22 | 848 | 829 | 173.8 |
| B | 10 | 252 | 20148 | 117.43 | 853 | 834 | 164.5 |
| B | 4 | 80 | 19364 | 112.67 | 853 | 834 | 164.5 |
| B | 12 | 111 | 19031 | 110.64 | 853 | 834 | 164.5 |
| C | 13 | 61 | 6045 | 27.14 | 820 | 825 | 192.3 |
| C | 3 | 202 | 2094 | 6.6 | 820 | 825 | 192.3 |
| C | 14 | 67 | 1898 | 5.58 | 820 | 825 | 192.3 |
| D | 1 | 52 | 76742 | 360.15 | 816 | 794 | 210.9 |
| D | 13 | 122 | 67411 | 315.9 | 816 | 794 | 210.9 |
| D | 8 | 195 | 37511 | 174.11 | 816 | 794 | 210.9 |
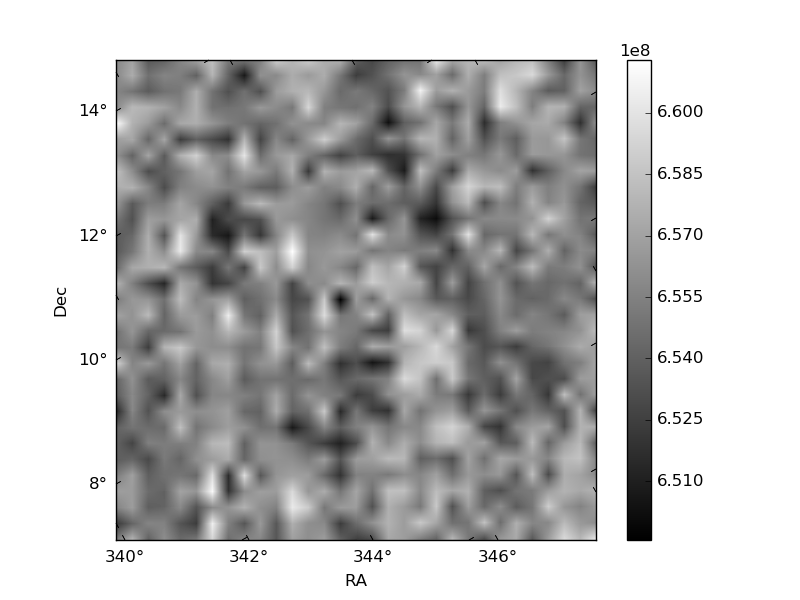
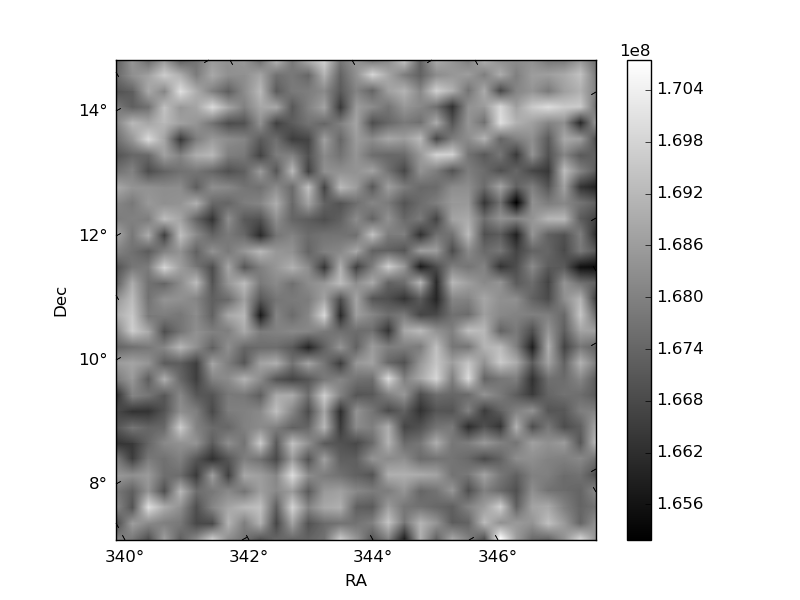
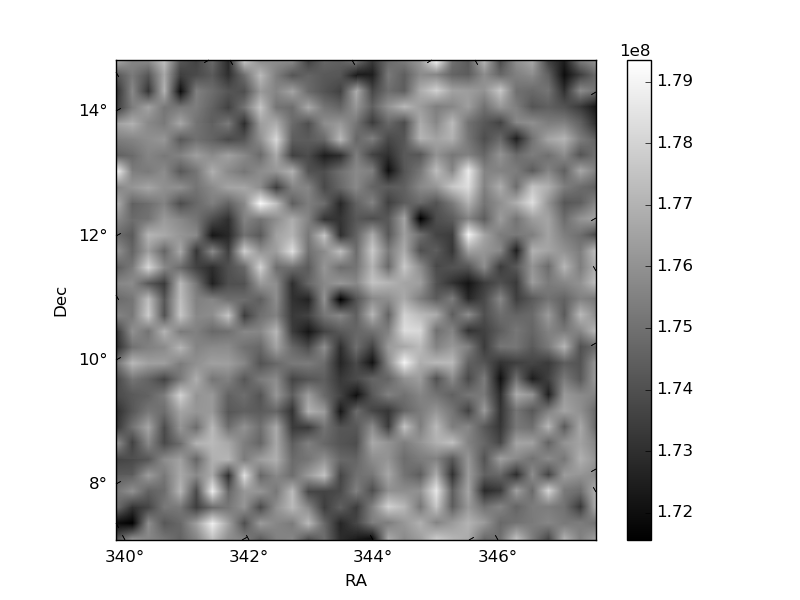
Histogram calculated using DETX and DETY for each event in the final _common_clean file
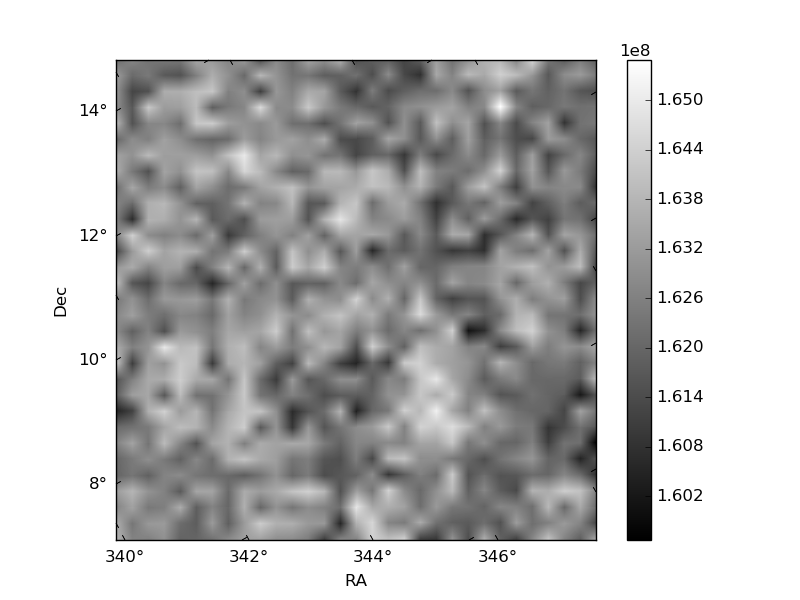
| Quadrant A | 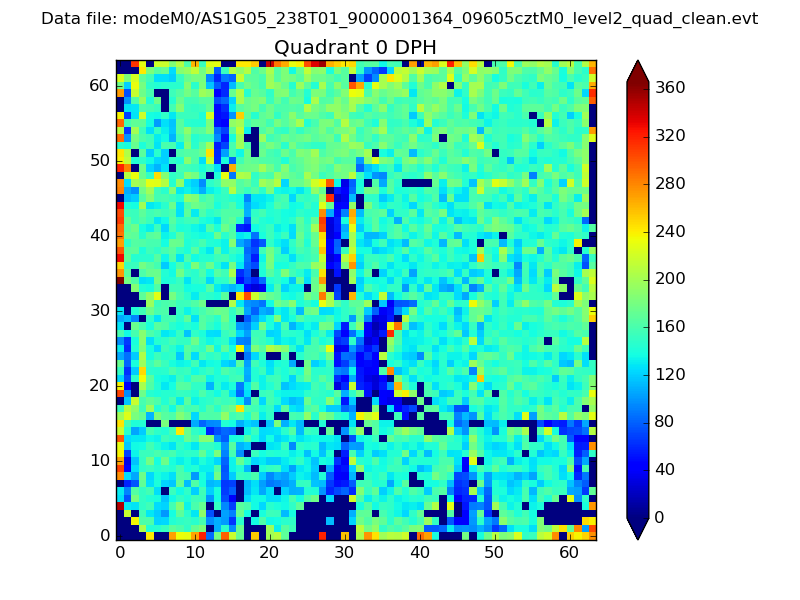 |
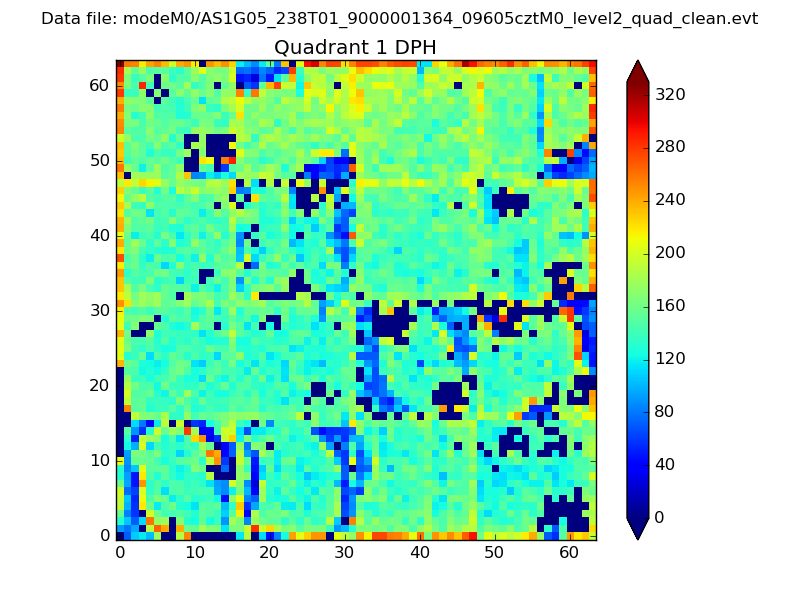 |
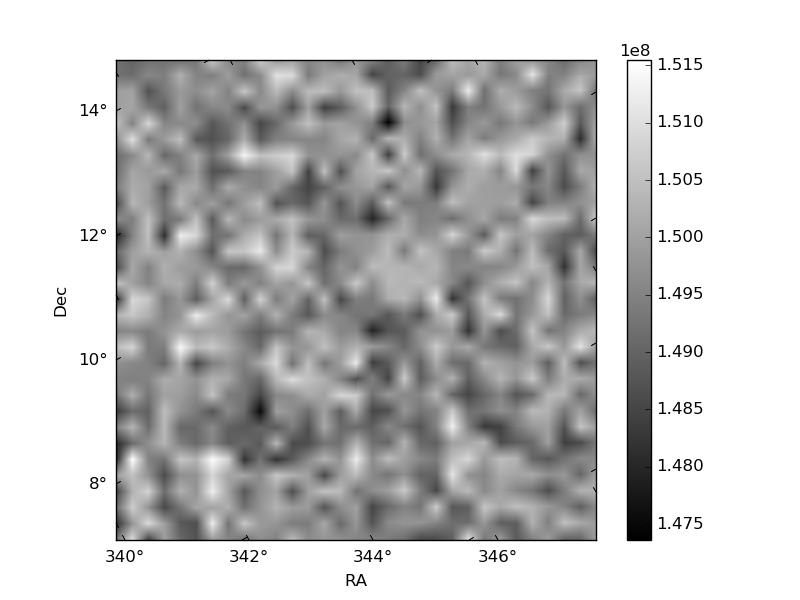
Quadrant B |
|---|---|---|---|
| Quadrant D |  |
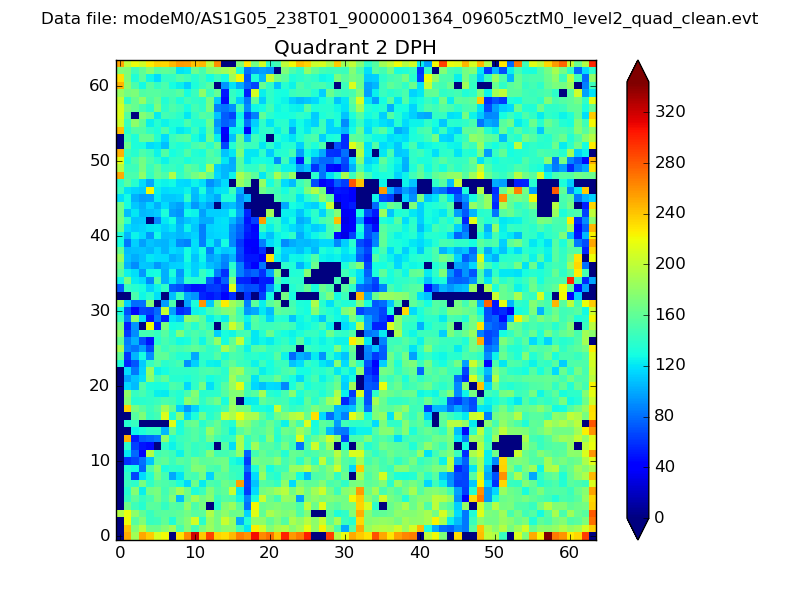 |
Quadrant C |
| Plot type | Count rate plots | Images |
|---|---|---|
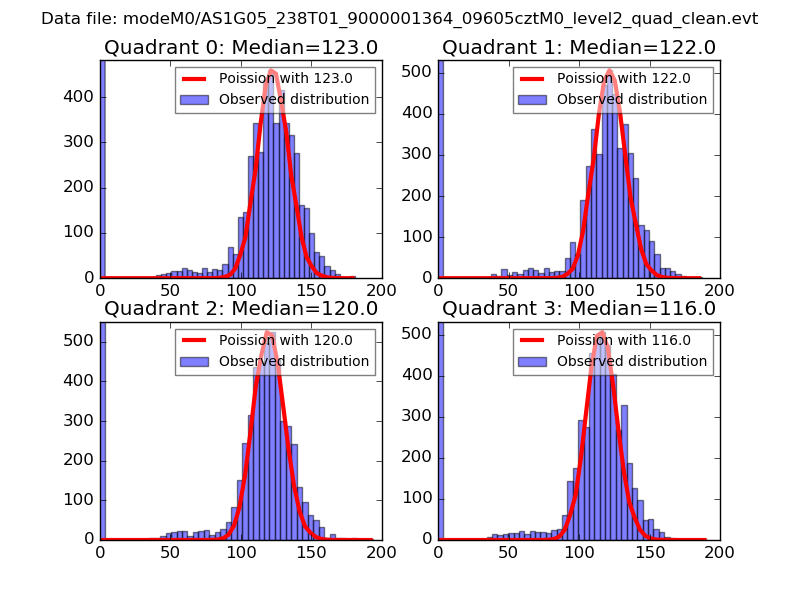
| Comparison with Poisson distribution Blue bars denote a histogram of data divided into 1 sec bins. Red curve is a Poisson curve with rate = median count rate of data. |
 |
 |
| Quadrant-wise count rates Data is divided into 100 sec bins |
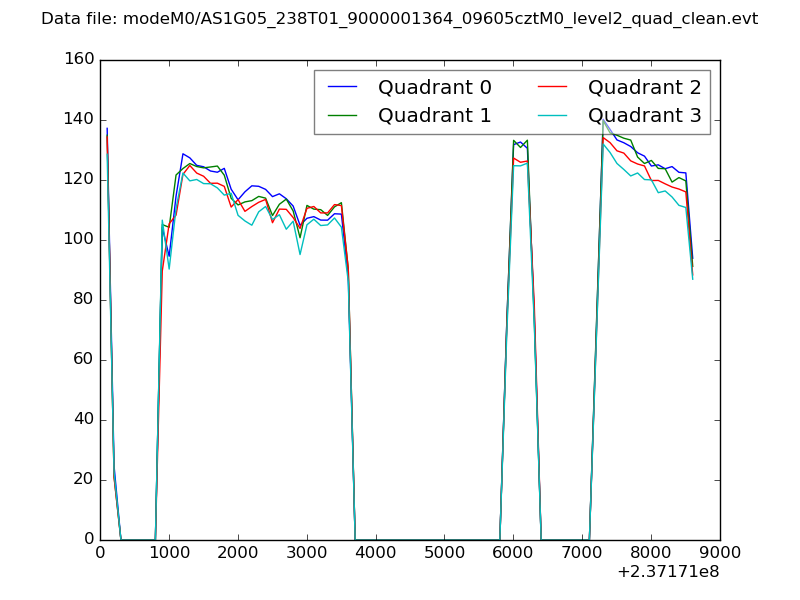 |
|
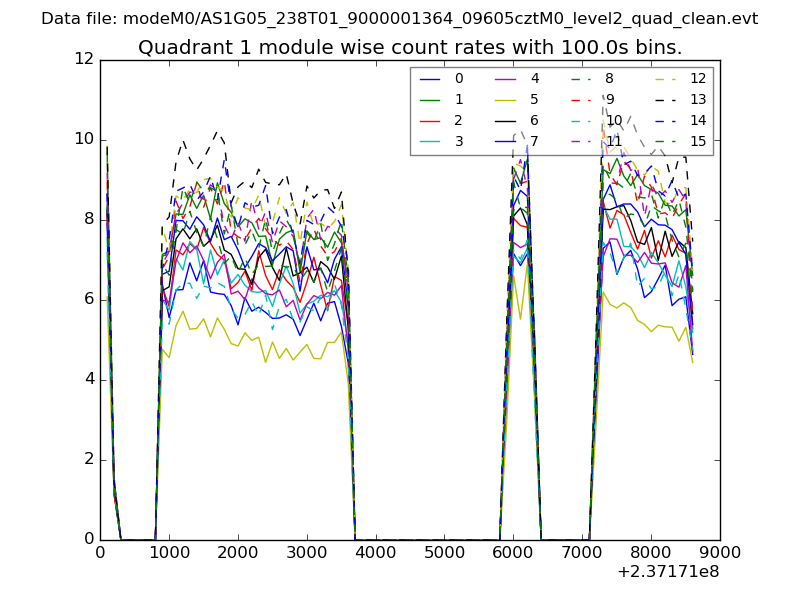
| Module-wise count rates for Quadrant A Data is divided into 100 sec bins |
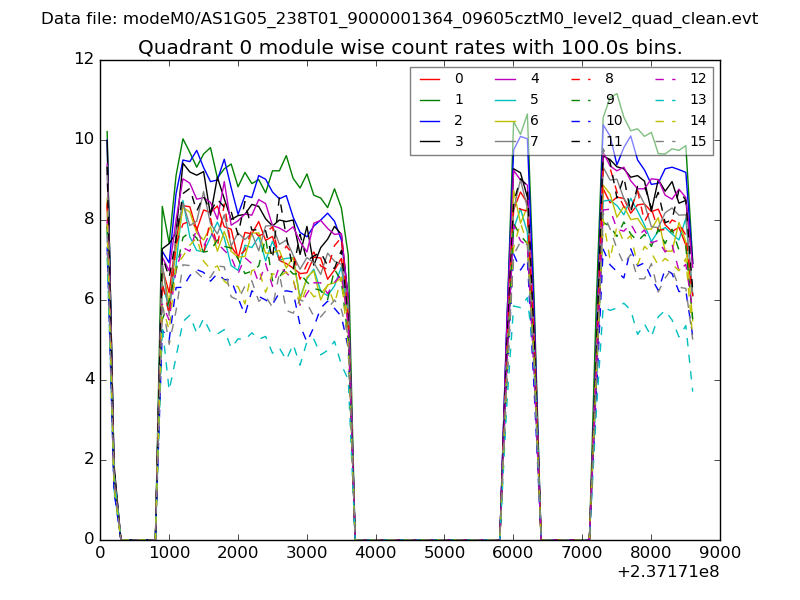 |
 |
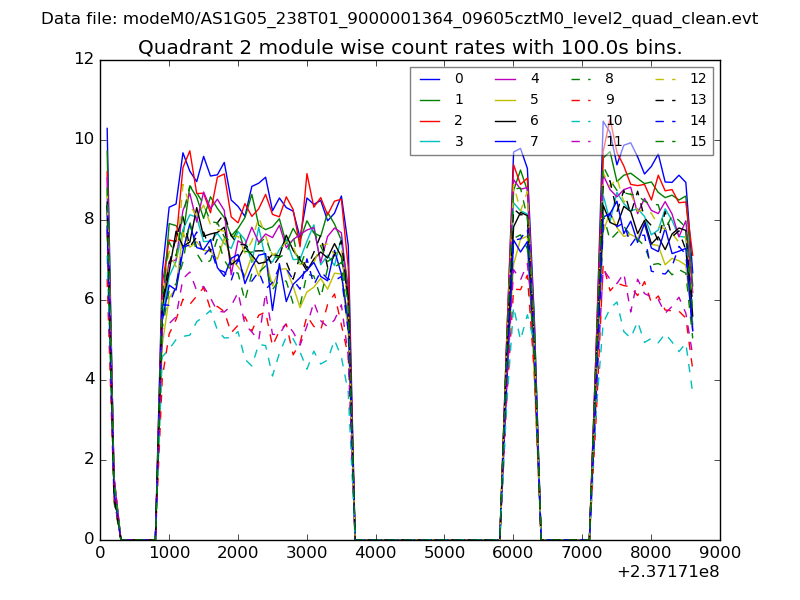
| Module-wise count rates for Quadrant B Data is divided into 100 sec bins |
 |
 |
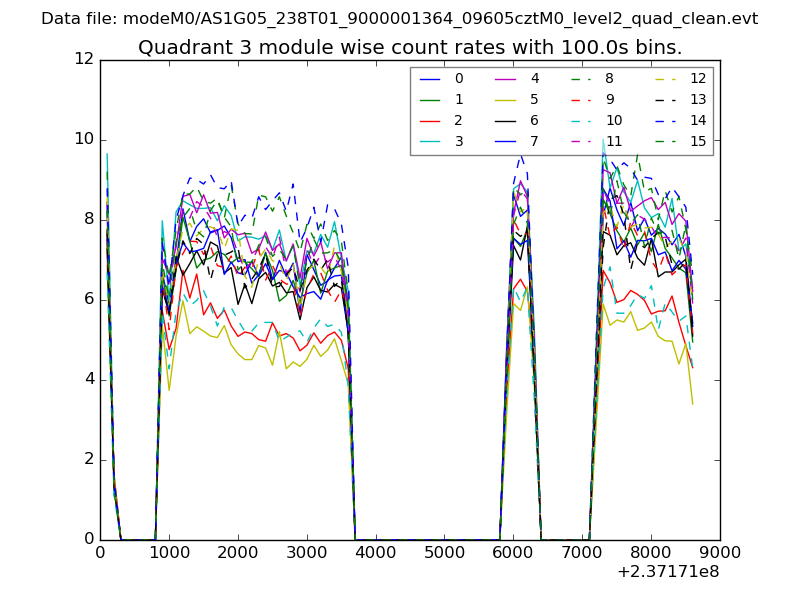
| Module-wise count rates for Quadrant C Data is divided into 100 sec bins |
 |
 |
| Module-wise count rates for Quadrant D Data is divided into 100 sec bins |
 |
 |
| Parameter | Plot |
|---|---|
| CZT HV Monitor | 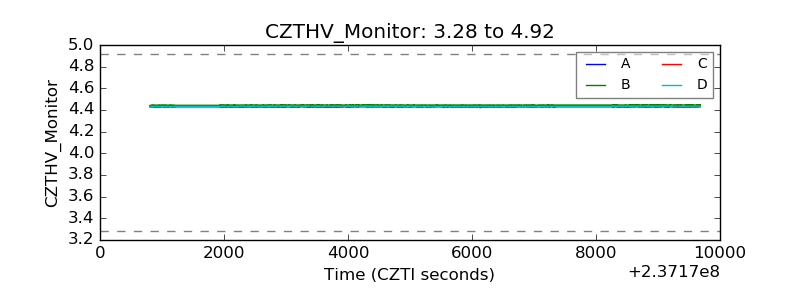 |
| D_VDD | 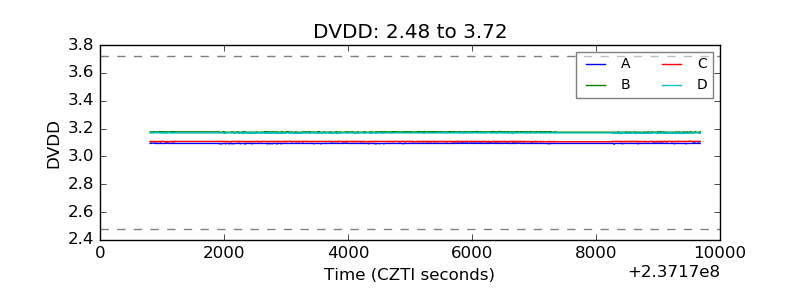 |
| Temperature 1 | 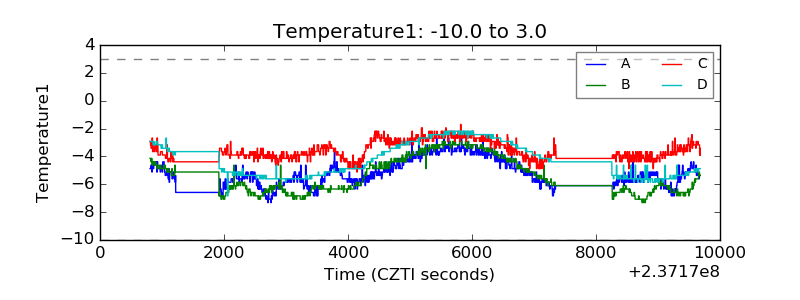 |
| Veto HV Monitor | 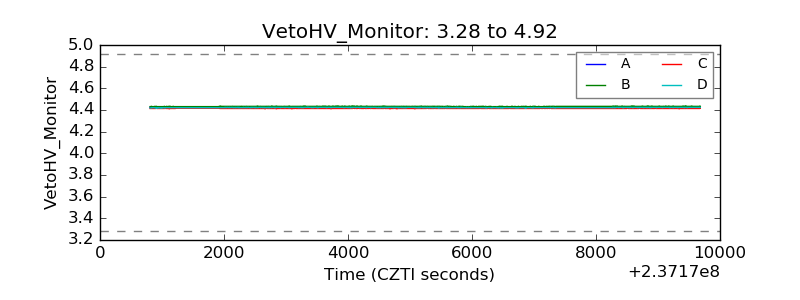 |
| Veto LLD | 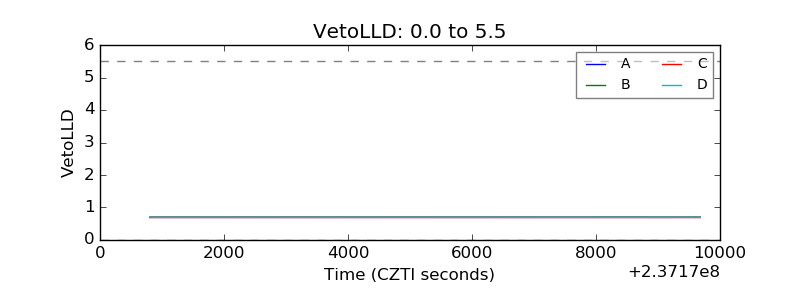 |
| Alpha Counter | 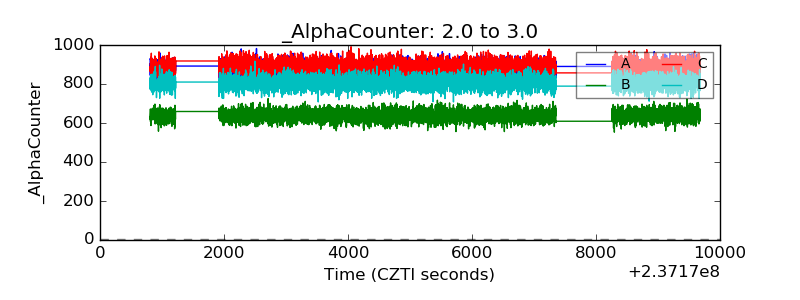 |
| _CPM_Rate | 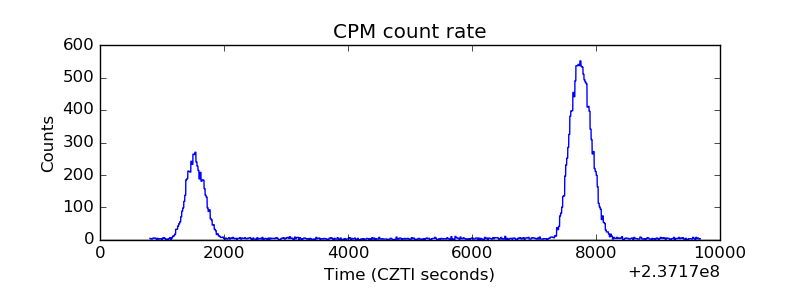 |
| CZT Counter | 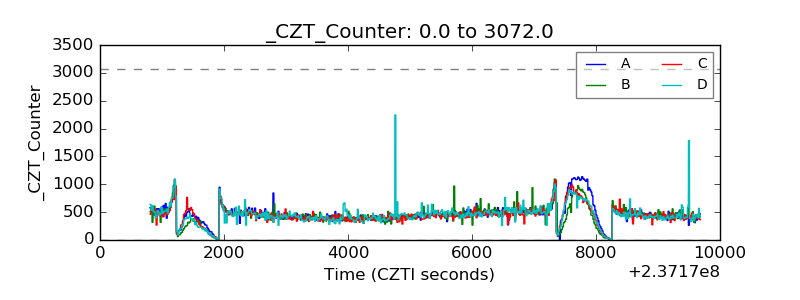 |
| +2.5 Volts monitor |  |
| +5 Volts monitor |  |
| _ROLL_ROT | 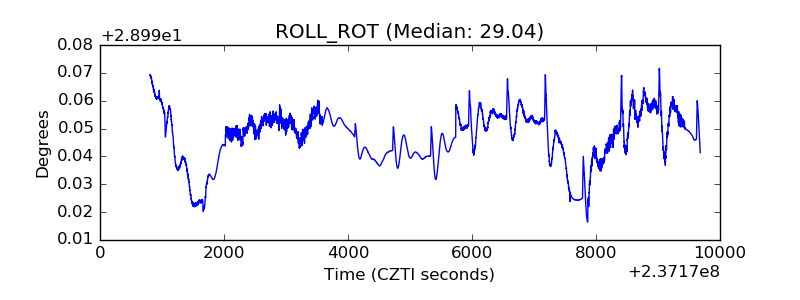 |
| _Roll_DEC | 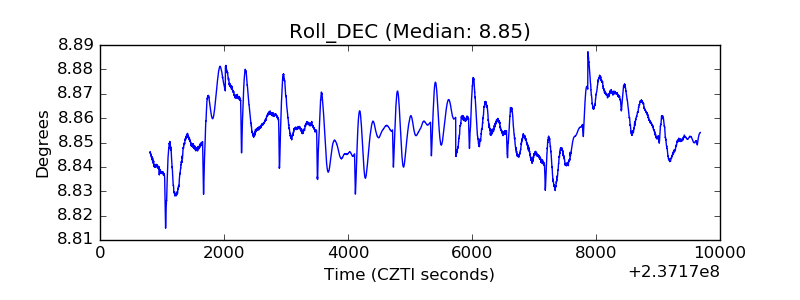 |
| _Roll_RA | 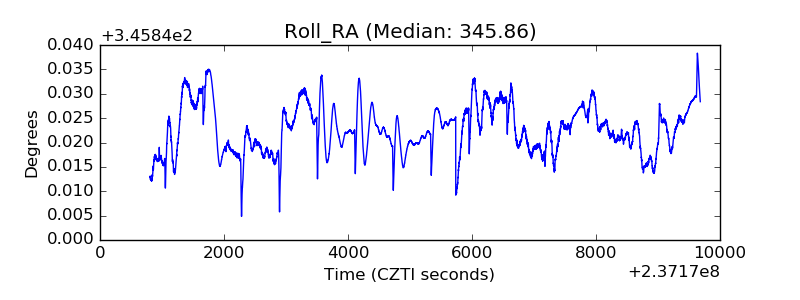 |
| Veto Counter | 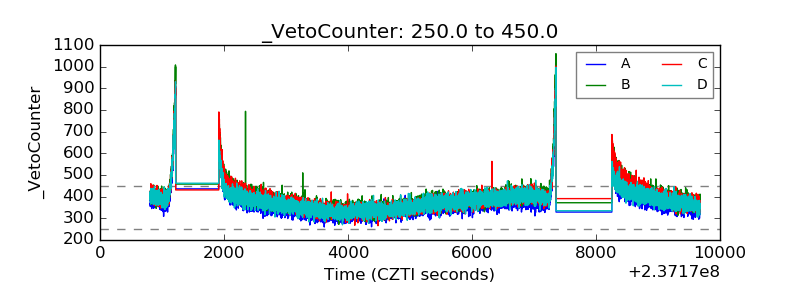 |