| Param | Original file | Final file |
|---|---|---|
| Filename | modeM0/AS1G05_238T01_9000001364_09606cztM0_level2.evt | modeM0/AS1G05_238T01_9000001364_09606cztM0_level2_quad_clean.evt |
| Size (bytes) | 1,620,123,840 | 314,616,960 |
| Size | 1.5 GB | 300.0 MB |
| Events in quadrant A | 11,476,446 | 2,005,573 |
| Events in quadrant B | 11,602,504 | 1,994,602 |
| Events in quadrant C | 11,123,586 | 1,943,195 |
| Events in quadrant D | 13,204,091 | 1,897,837 |
| Mode M0 | |||
|---|---|---|---|
| Quadrant | BADHDUFLAG | Total packets | Discarded packets |
| A | 0 | 51266 | 535 |
| B | 0 | 51574 | 499 |
| C | 0 | 50858 | 464 |
| D | 0 | 56820 | 535 |
| Mode SS | |||
|---|---|---|---|
| Quadrant | BADHDUFLAG | Total packets | Discarded packets |
| A | 0 | 504 | 4 |
| B | 0 | 504 | 2 |
| C | 0 | 504 | 4 |
| D | 0 | 504 | 10 |
| Mode M9 | |||
|---|---|---|---|
| Quadrant | BADHDUFLAG | Total packets | Discarded packets |
| A | 0 | 32 | 1 |
| B | 0 | 32 | 0 |
| C | 0 | 32 | 0 |
| D | 0 | 32 | 1 |
| Quadrant | Total seconds | Saturated seconds | Saturation percentage |
|---|---|---|---|
| A | 24530 | 174 | 0.709336% |
| B | 24546 | 214 | 0.871832% |
| C | 24555 | 153 | 0.623091% |
| D | 24530 | 225 | 0.917244% |
Noise dominated data is calculated using 1-second bins in cleaned event files. If a bin has >2000 counts, and if more than 50% of those come from <1% of pixels, then it is considered to be noise-dominated and hence unusable.
| Quadrant | # 1 sec bins | Bins with >0 counts | Bins with >2000 counts | High rate bins dominated by noise | Noise dominated (total time) | Noise dominated (detector-on time) | Marked lightcurve |
|---|---|---|---|---|---|---|---|
| A | 38286 | 24751 | 0 | 0 | 0.00% | 0.00% | 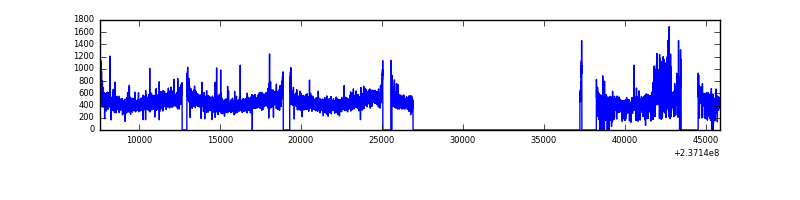 |
| B | 38286 | 24746 | 3 | 3 | 0.01% | 0.01% | 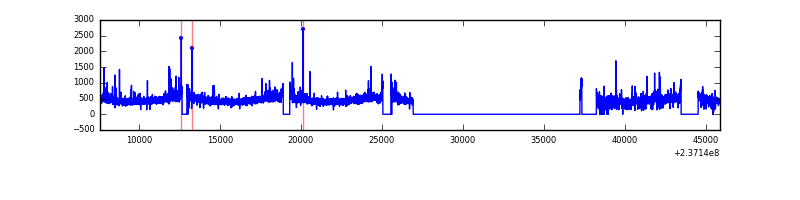 |
| C | 38286 | 24753 | 25 | 25 | 0.07% | 0.10% | 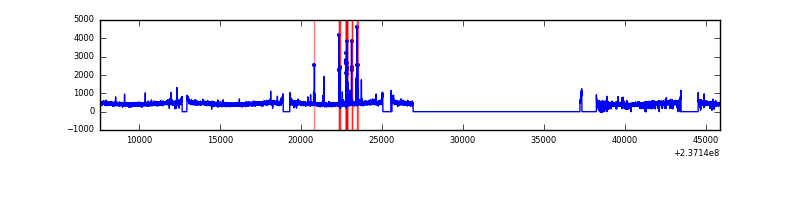 |
| D | 38286 | 24762 | 78 | 78 | 0.20% | 0.31% | 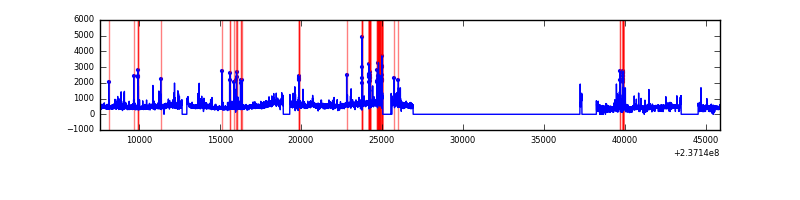 |
Top three noisy pixels from each quadrant. If the there are fewer than three noisy pixels in the level2.evt file, extra rows are filled as -1
| Pixel properties | Quadrant properties | ||||||
|---|---|---|---|---|---|---|---|
| Quadrant | DetID | PixID | Counts | Sigma | Mean | Median | Sigma |
| A | 1 | 162 | 97833 | 162.73 | 2918 | 2866 | 583.6 |
| A | 1 | 178 | 42239 | 67.47 | 2918 | 2866 | 583.6 |
| A | 1 | 161 | 39489 | 62.75 | 2918 | 2866 | 583.6 |
| B | 0 | 214 | 132345 | 234.7 | 2912 | 2837 | 551.8 |
| B | 12 | 111 | 64041 | 110.91 | 2912 | 2837 | 551.8 |
| B | 4 | 80 | 58244 | 100.41 | 2912 | 2837 | 551.8 |
| C | 14 | 234 | 168385 | 253.27 | 2809 | 2824 | 653.7 |
| C | 13 | 61 | 20650 | 27.27 | 2809 | 2824 | 653.7 |
| C | 14 | 67 | 9478 | 10.18 | 2809 | 2824 | 653.7 |
| D | 8 | 195 | 1745663 | 2506.27 | 2795 | 2729 | 695.4 |
| D | 1 | 52 | 290968 | 414.48 | 2795 | 2729 | 695.4 |
| D | 13 | 104 | 140994 | 198.82 | 2795 | 2729 | 695.4 |
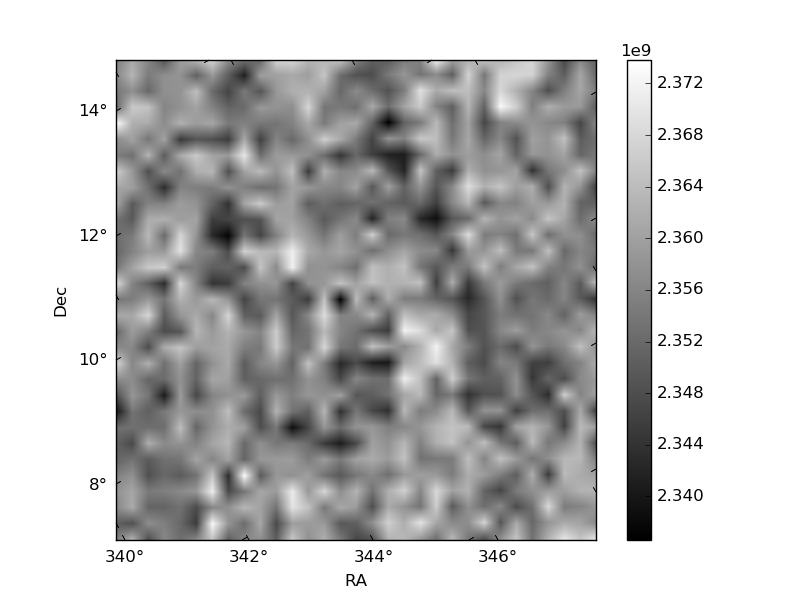
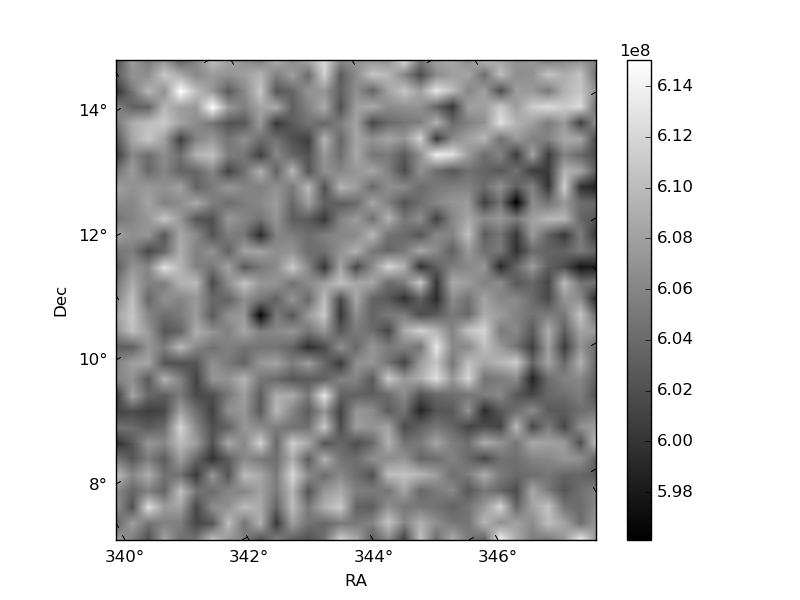
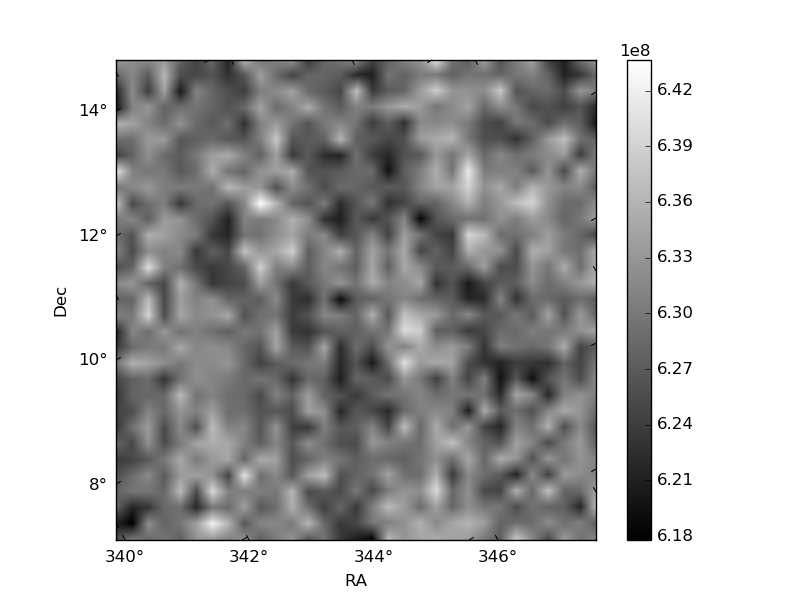
Histogram calculated using DETX and DETY for each event in the final _common_clean file
| Quadrant A | 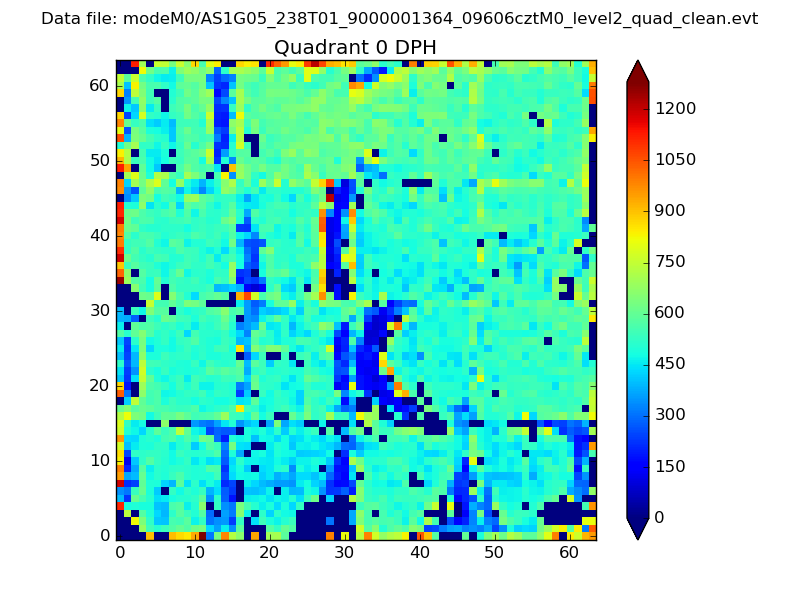 |
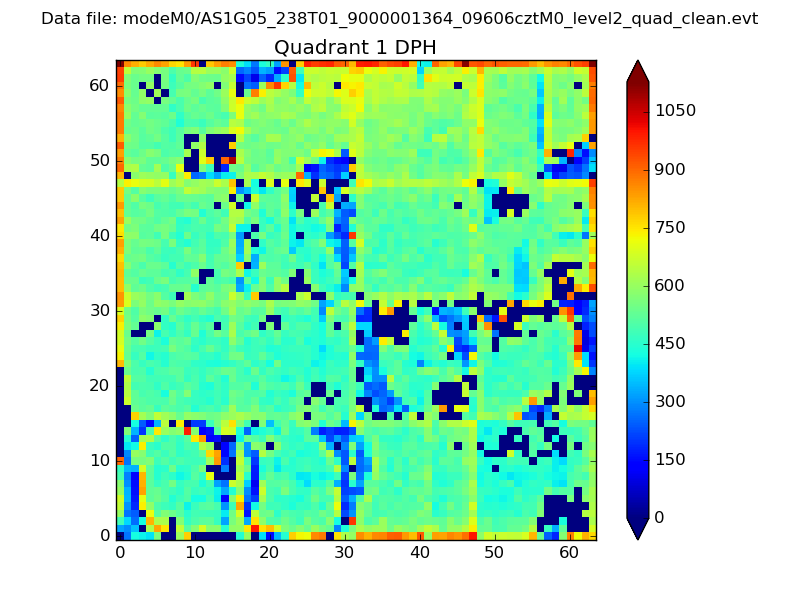 |
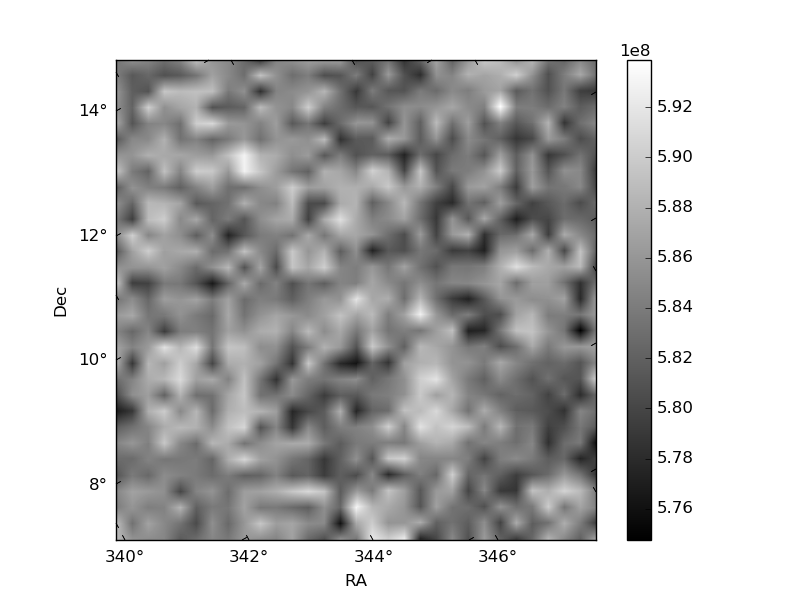
Quadrant B |
|---|---|---|---|
| Quadrant D | 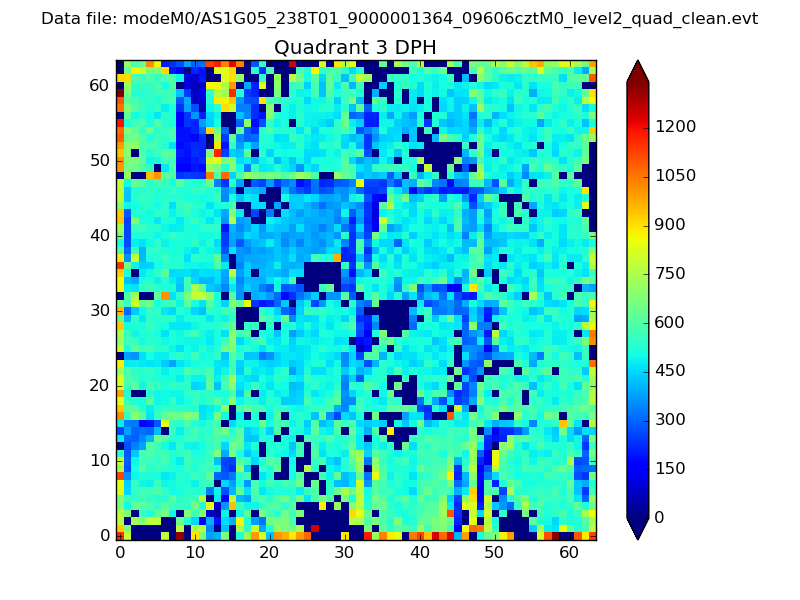 |
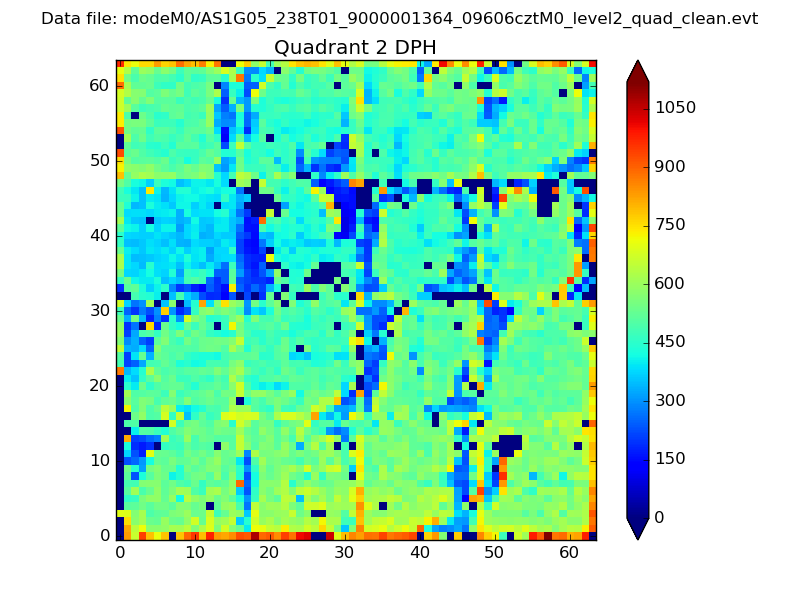 |
Quadrant C |
| Plot type | Count rate plots | Images |
|---|---|---|
| Comparison with Poisson distribution Blue bars denote a histogram of data divided into 1 sec bins. Red curve is a Poisson curve with rate = median count rate of data. |
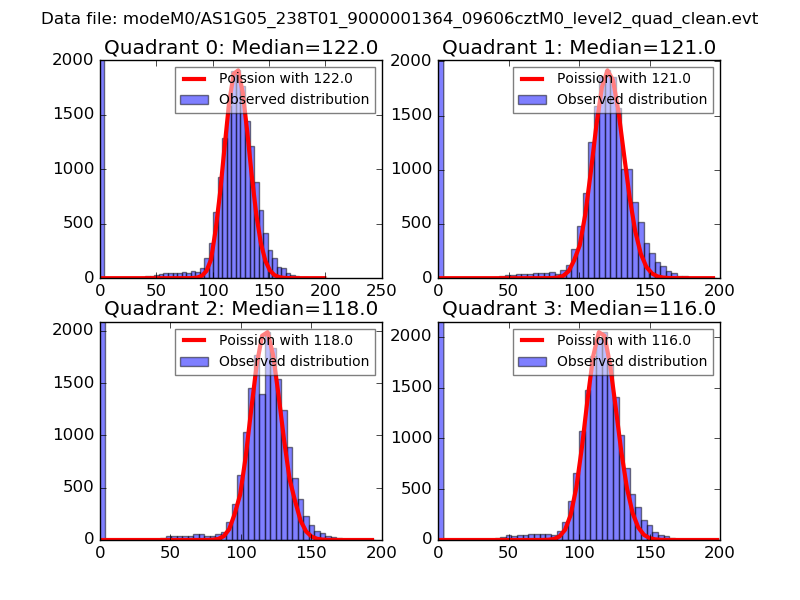 |
 |
| Quadrant-wise count rates Data is divided into 100 sec bins |
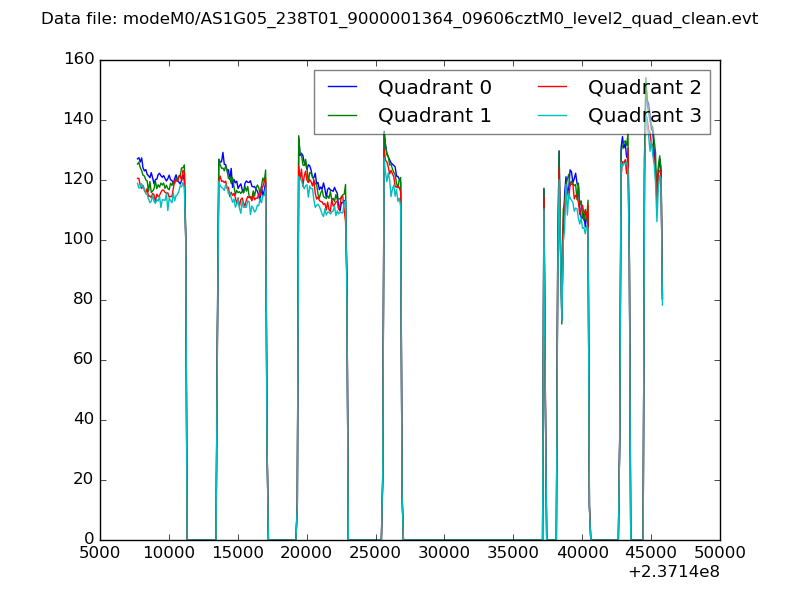 |
|
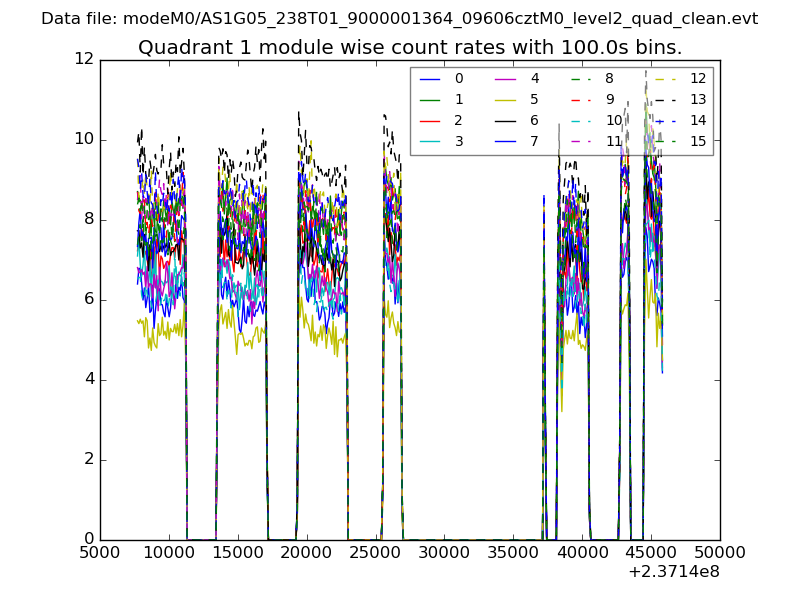
| Module-wise count rates for Quadrant A Data is divided into 100 sec bins |
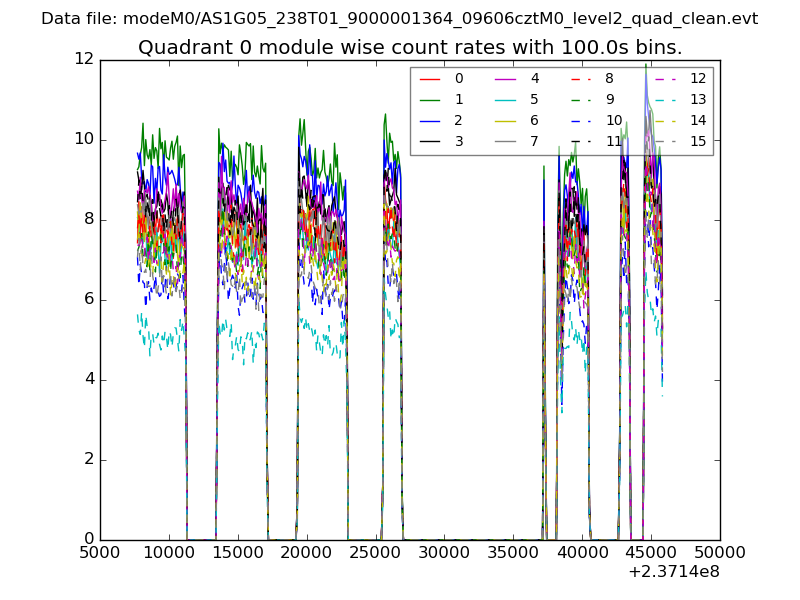 |
 |
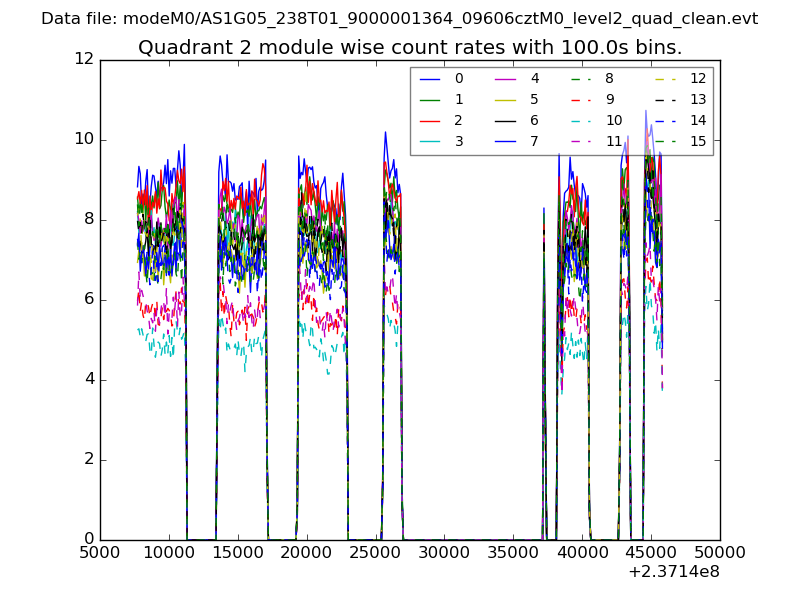
| Module-wise count rates for Quadrant B Data is divided into 100 sec bins |
 |
 |
| Module-wise count rates for Quadrant C Data is divided into 100 sec bins |
 |
 |
| Module-wise count rates for Quadrant D Data is divided into 100 sec bins |
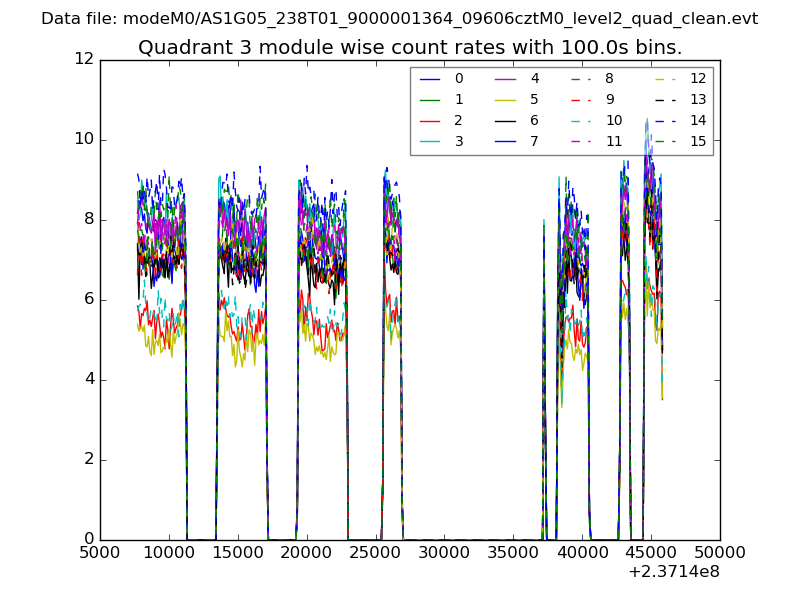 |
 |
| Parameter | Plot |
|---|---|
| CZT HV Monitor | 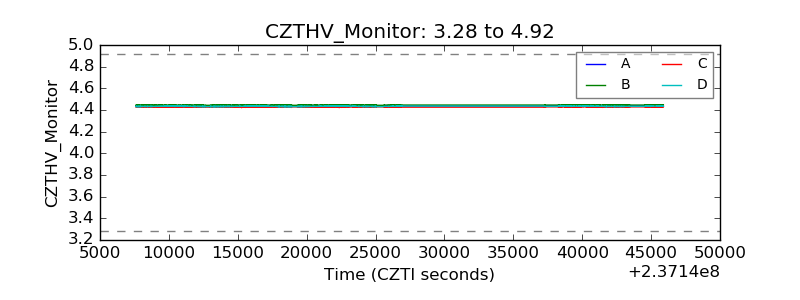 |
| D_VDD | 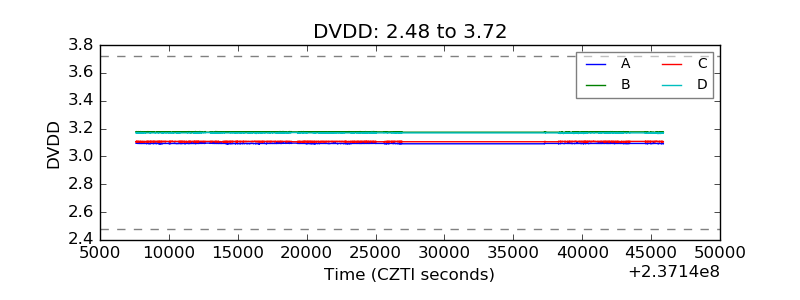 |
| Temperature 1 | 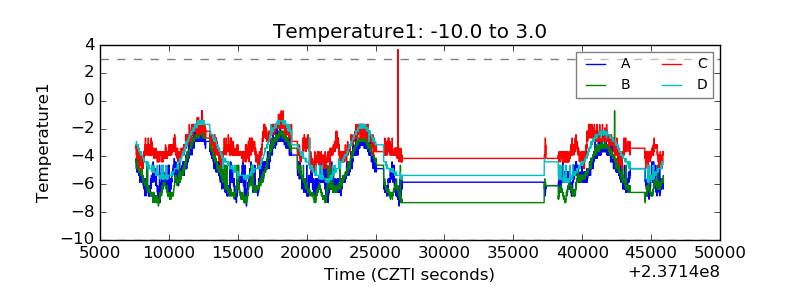 |
| Veto HV Monitor | 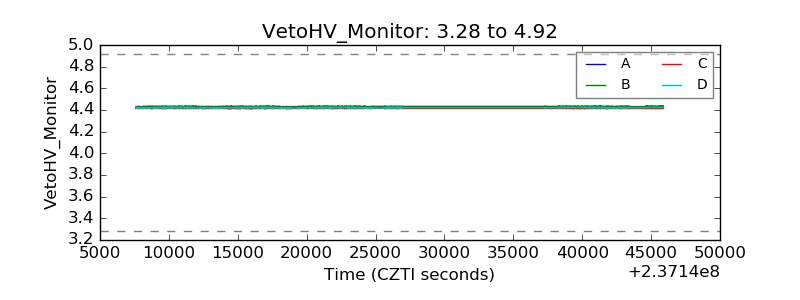 |
| Veto LLD | 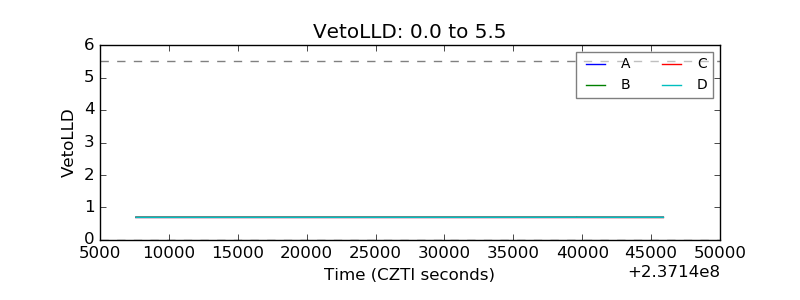 |
| Alpha Counter | 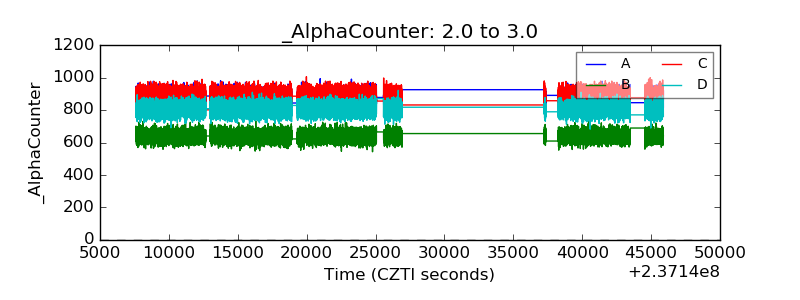 |
| _CPM_Rate | 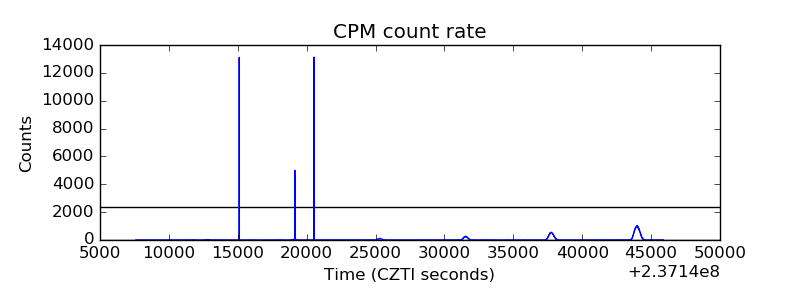 |
| CZT Counter | 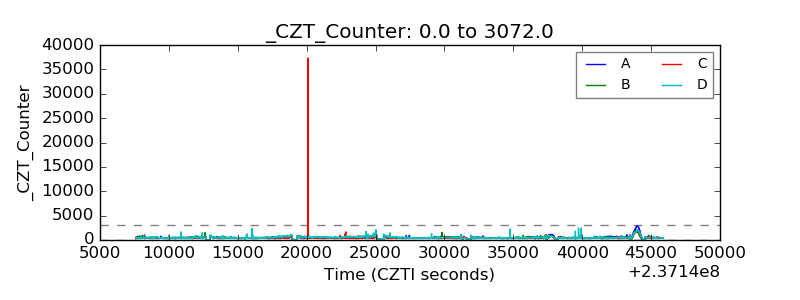 |
| +2.5 Volts monitor |  |
| +5 Volts monitor |  |
| _ROLL_ROT |  |
| _Roll_DEC |  |
| _Roll_RA | 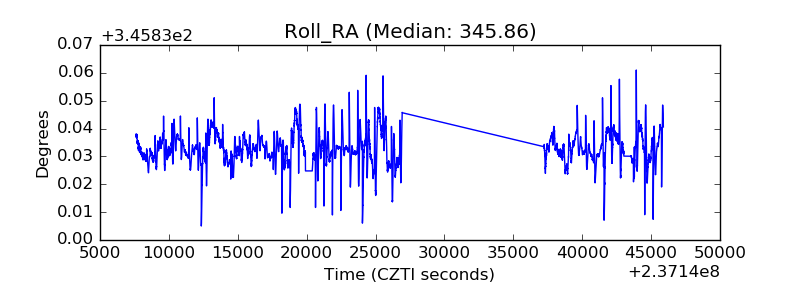 |
| Veto Counter | 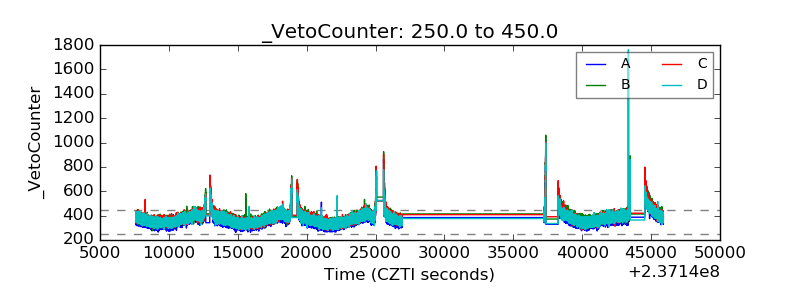 |