| Param | Original file | Final file |
|---|---|---|
| Filename | modeM0/AS1G05_238T01_9000001364_09609cztM0_level2.evt | modeM0/AS1G05_238T01_9000001364_09609cztM0_level2_quad_clean.evt |
| Size (bytes) | 399,113,280 | 73,275,840 |
| Size | 380.6 MB | 69.9 MB |
| Events in quadrant A | 2,930,145 | 462,340 |
| Events in quadrant B | 2,915,352 | 464,060 |
| Events in quadrant C | 2,805,726 | 447,350 |
| Events in quadrant D | 3,036,873 | 435,105 |
| Mode M0 | |||
|---|---|---|---|
| Quadrant | BADHDUFLAG | Total packets | Discarded packets |
| A | 0 | 12175 | 2 |
| B | 0 | 12132 | 1 |
| C | 0 | 12066 | 1 |
| D | 0 | 12745 | 1 |
| Mode SS | |||
|---|---|---|---|
| Quadrant | BADHDUFLAG | Total packets | Discarded packets |
| A | 0 | 120 | 0 |
| B | 0 | 120 | 0 |
| C | 0 | 120 | 0 |
| D | 0 | 120 | 0 |
| Mode M9 | |||
|---|---|---|---|
| Quadrant | BADHDUFLAG | Total packets | Discarded packets |
| A | 0 | 12 | 0 |
| B | 0 | 12 | 0 |
| C | 0 | 12 | 0 |
| D | 0 | 12 | 0 |
| Quadrant | Total seconds | Saturated seconds | Saturation percentage |
|---|---|---|---|
| A | 5864 | 66 | 1.125512% |
| B | 5864 | 76 | 1.296044% |
| C | 5864 | 40 | 0.682128% |
| D | 5864 | 53 | 0.903820% |
Noise dominated data is calculated using 1-second bins in cleaned event files. If a bin has >2000 counts, and if more than 50% of those come from <1% of pixels, then it is considered to be noise-dominated and hence unusable.
| Quadrant | # 1 sec bins | Bins with >0 counts | Bins with >2000 counts | High rate bins dominated by noise | Noise dominated (total time) | Noise dominated (detector-on time) | Marked lightcurve |
|---|---|---|---|---|---|---|---|
| A | 7094 | 5865 | 0 | 0 | 0.00% | 0.00% | 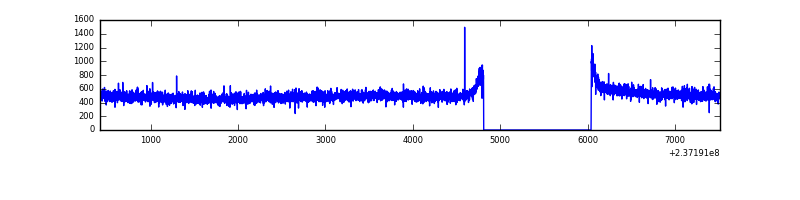 |
| B | 7094 | 5865 | 0 | 0 | 0.00% | 0.00% | 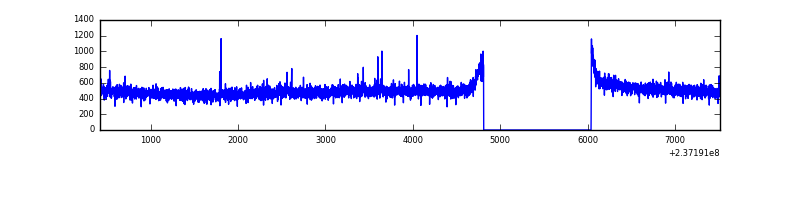 |
| C | 7094 | 5865 | 2 | 2 | 0.03% | 0.03% | 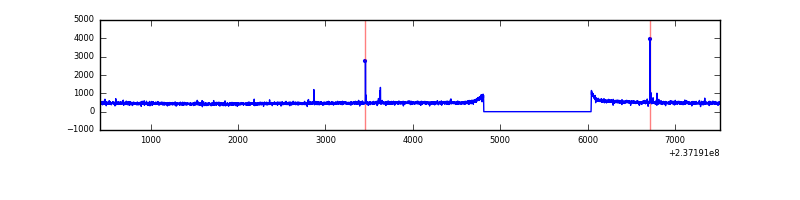 |
| D | 7094 | 5865 | 4 | 4 | 0.06% | 0.07% | 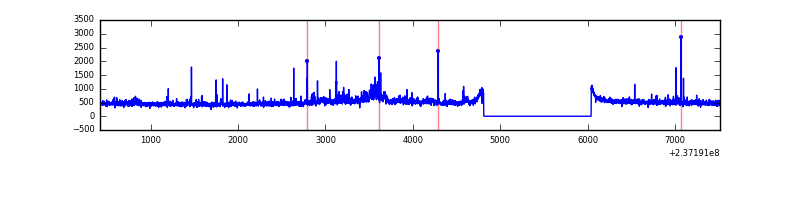 |
Top three noisy pixels from each quadrant. If the there are fewer than three noisy pixels in the level2.evt file, extra rows are filled as -1
| Pixel properties | Quadrant properties | ||||||
|---|---|---|---|---|---|---|---|
| Quadrant | DetID | PixID | Counts | Sigma | Mean | Median | Sigma |
| A | 13 | 14 | 19153 | 120.78 | 755 | 739 | 152.5 |
| A | 0 | 226 | 7020 | 41.2 | 755 | 739 | 152.5 |
| A | 12 | 194 | 6174 | 35.65 | 755 | 739 | 152.5 |
| B | 12 | 111 | 15769 | 105.43 | 744 | 727 | 142.7 |
| B | 11 | 111 | 13010 | 86.09 | 744 | 727 | 142.7 |
| B | 14 | 111 | 10018 | 65.12 | 744 | 727 | 142.7 |
| C | 14 | 234 | 22052 | 129.49 | 714 | 718 | 164.7 |
| C | 13 | 61 | 5434 | 28.62 | 714 | 718 | 164.7 |
| C | 3 | 202 | 1768 | 6.37 | 714 | 718 | 164.7 |
| D | 8 | 195 | 120826 | 640.39 | 719 | 702 | 187.6 |
| D | 1 | 52 | 78048 | 412.34 | 719 | 702 | 187.6 |
| D | 2 | 234 | 21563 | 111.21 | 719 | 702 | 187.6 |
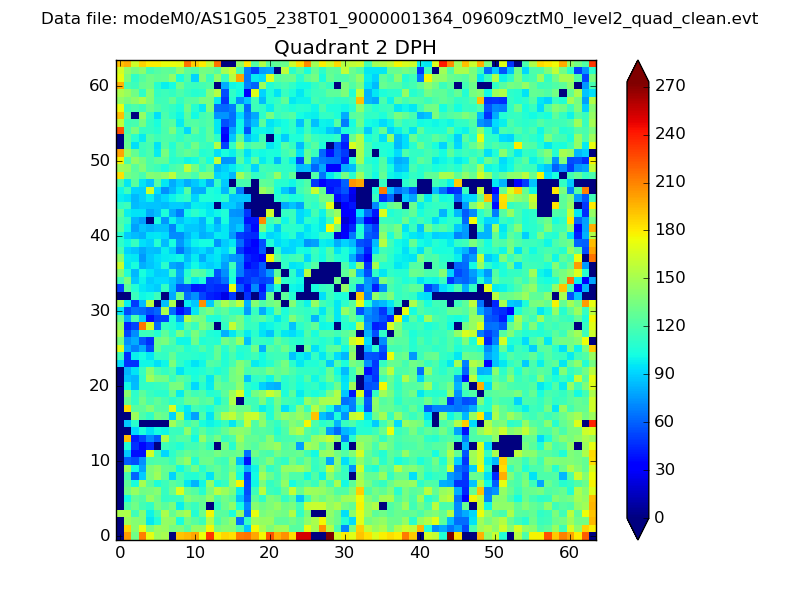
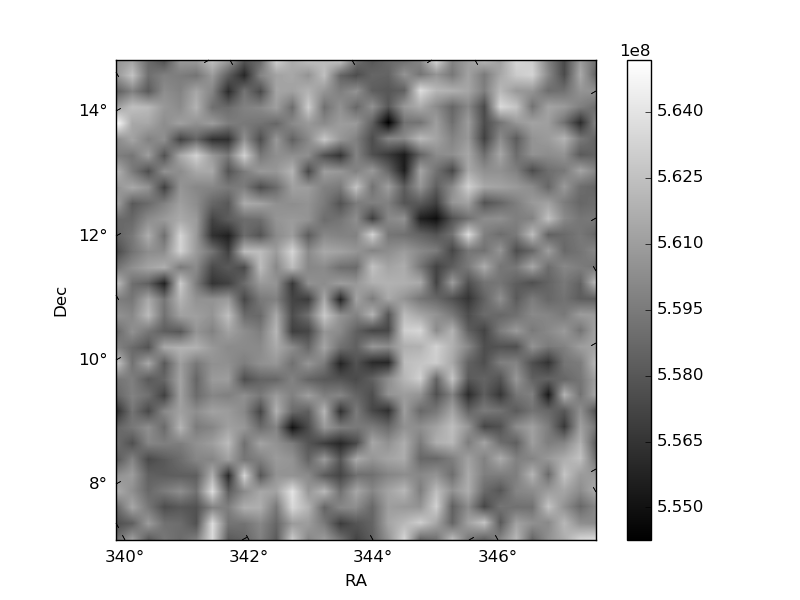
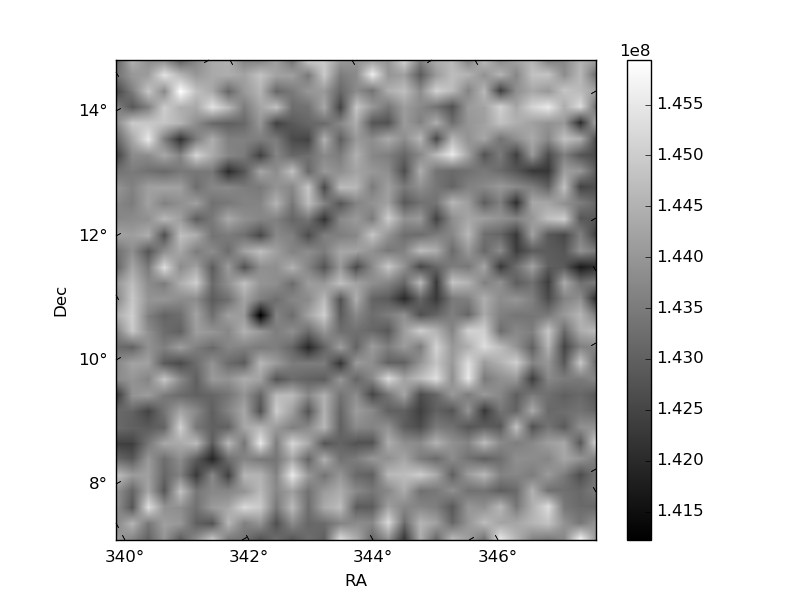
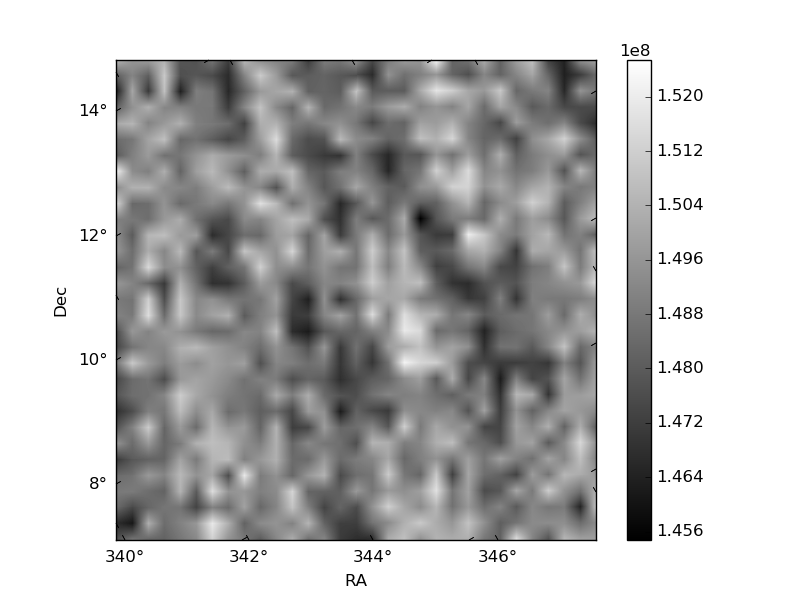
Histogram calculated using DETX and DETY for each event in the final _common_clean file
| Quadrant A | 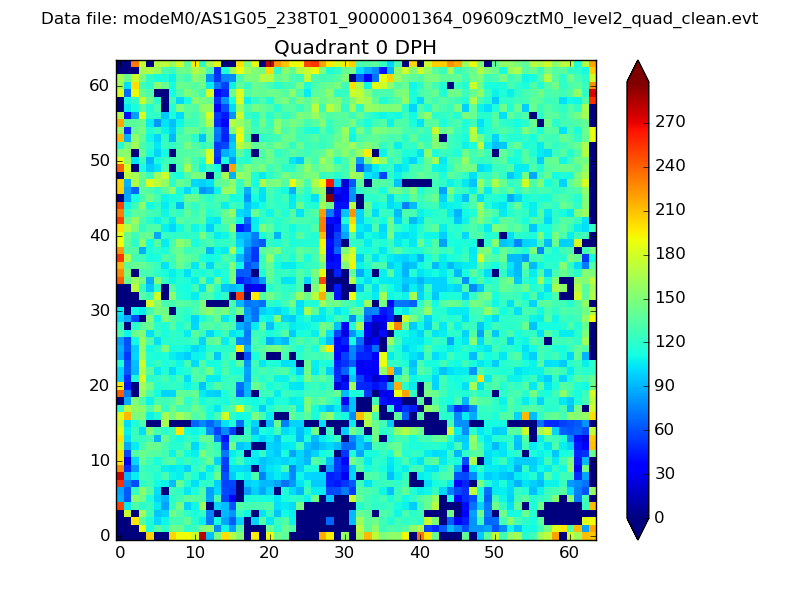 |
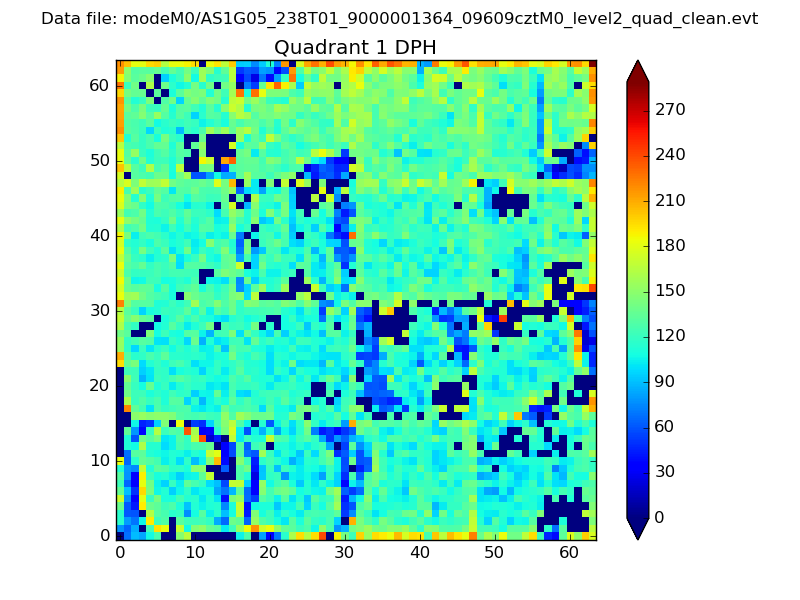 |
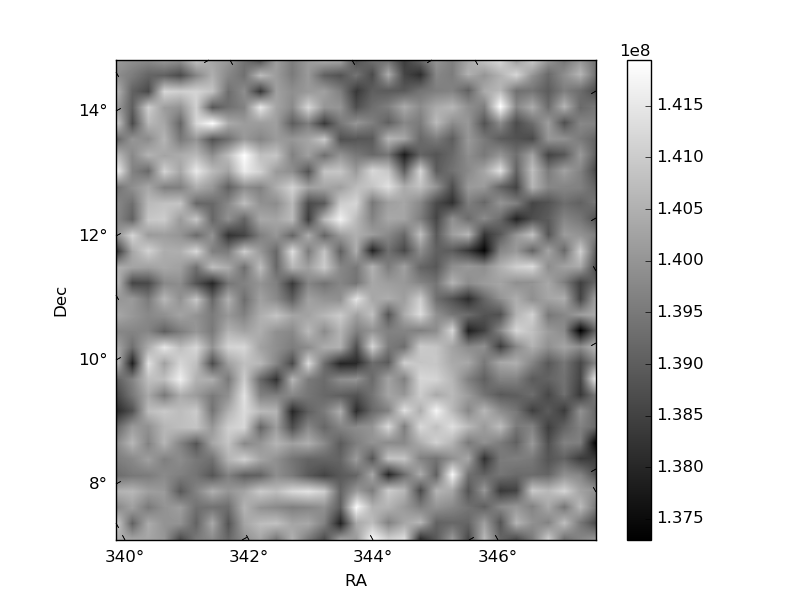
Quadrant B |
|---|---|---|---|
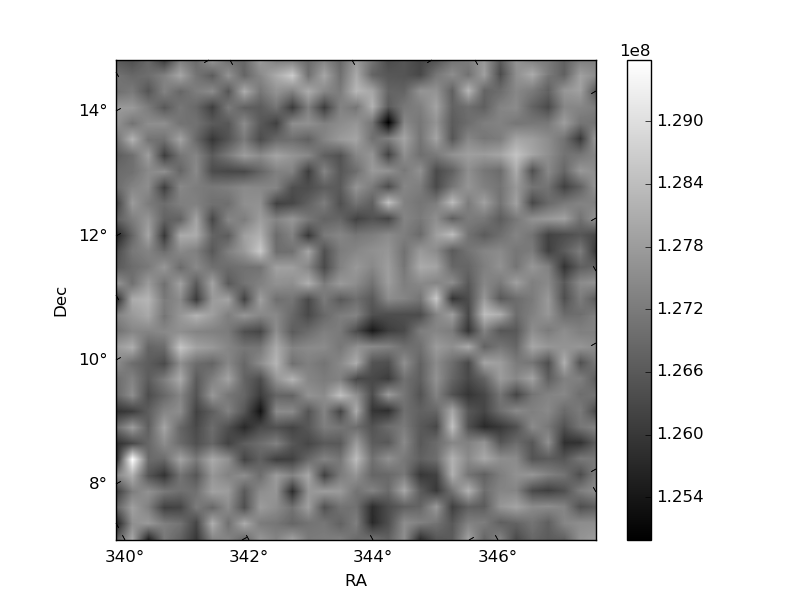
| Quadrant D | 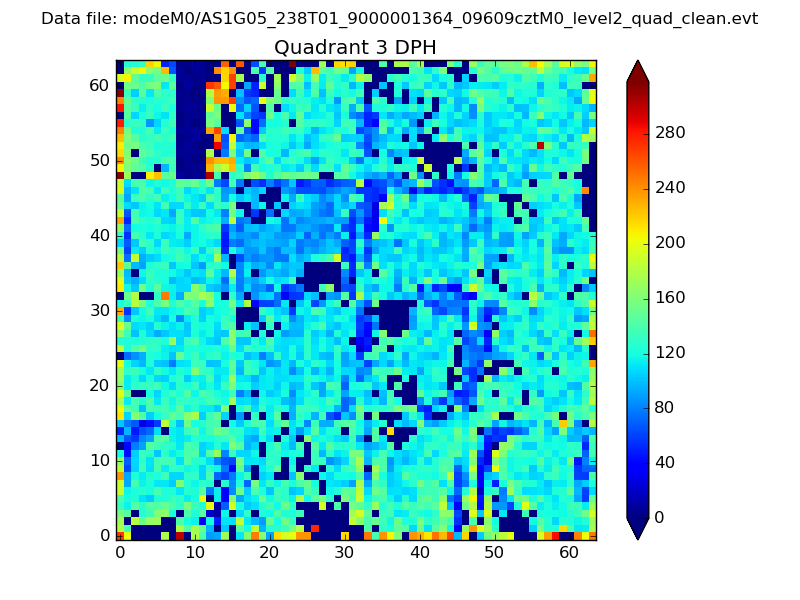 |
 |
Quadrant C |
| Plot type | Count rate plots | Images |
|---|---|---|
| Comparison with Poisson distribution Blue bars denote a histogram of data divided into 1 sec bins. Red curve is a Poisson curve with rate = median count rate of data. |
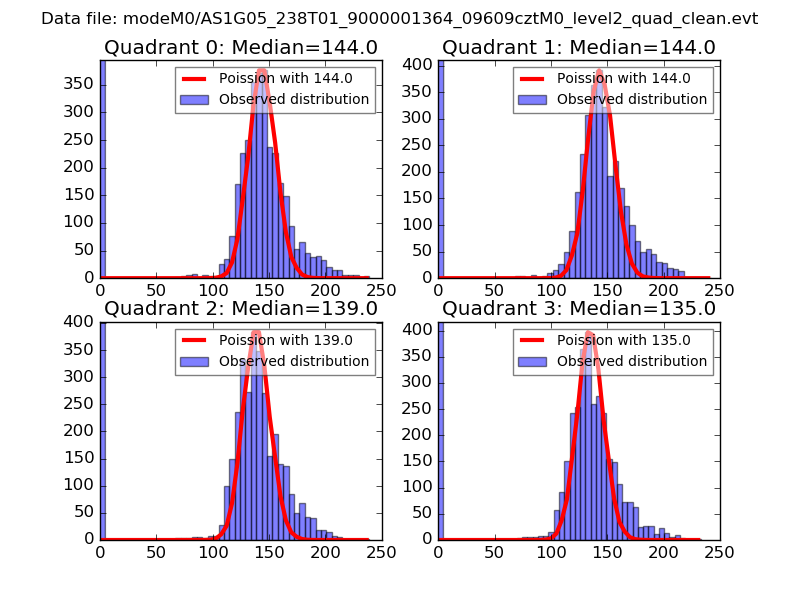 |
 |
| Quadrant-wise count rates Data is divided into 100 sec bins |
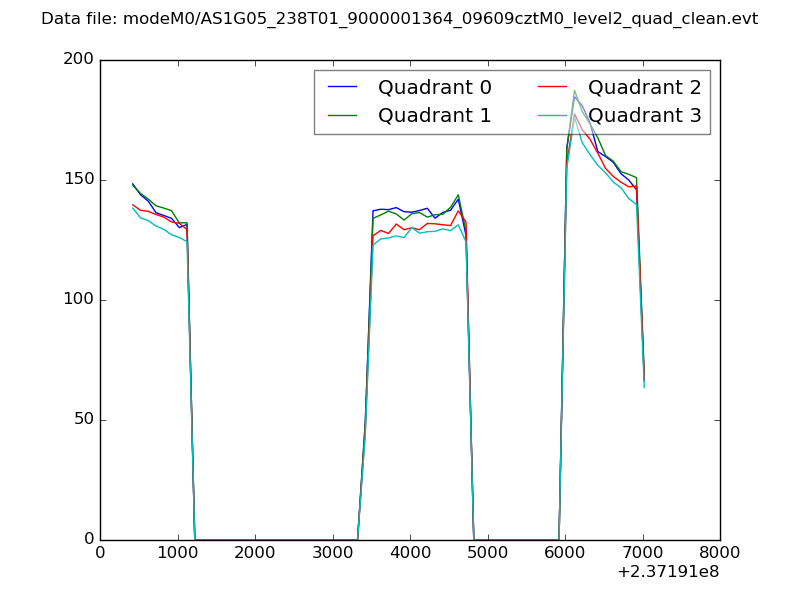 |
|
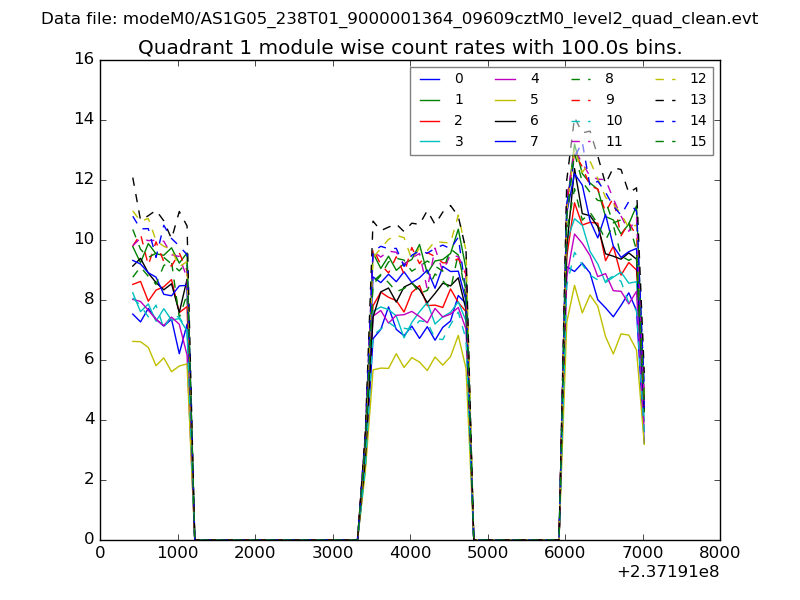
| Module-wise count rates for Quadrant A Data is divided into 100 sec bins |
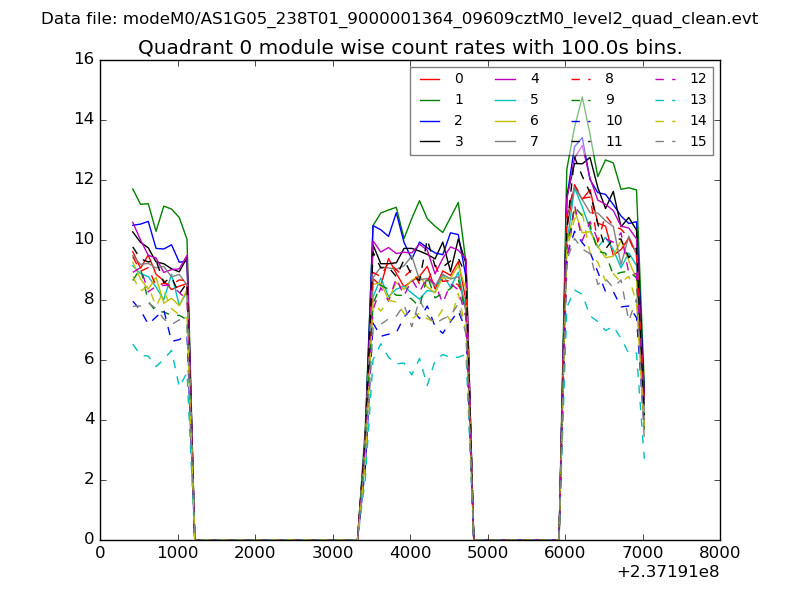 |
 |
| Module-wise count rates for Quadrant B Data is divided into 100 sec bins |
 |
 |
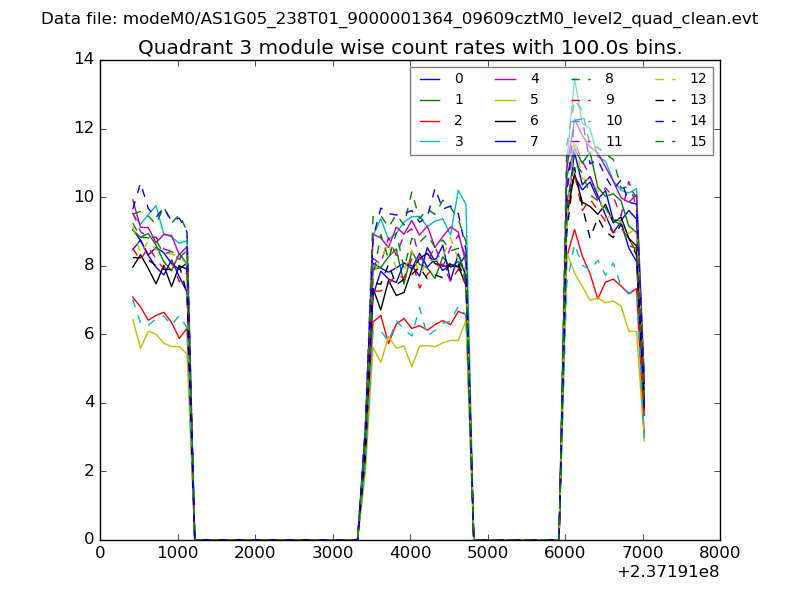
| Module-wise count rates for Quadrant C Data is divided into 100 sec bins |
 |
 |
| Module-wise count rates for Quadrant D Data is divided into 100 sec bins |
 |
 |
| Parameter | Plot |
|---|---|
| CZT HV Monitor | 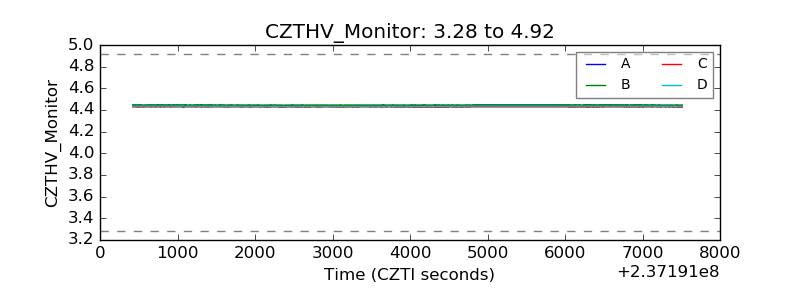 |
| D_VDD | 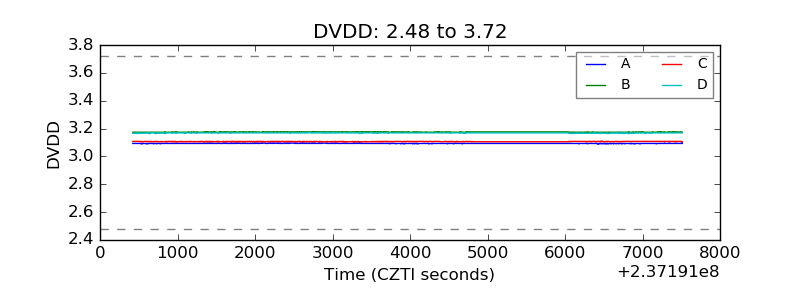 |
| Temperature 1 | 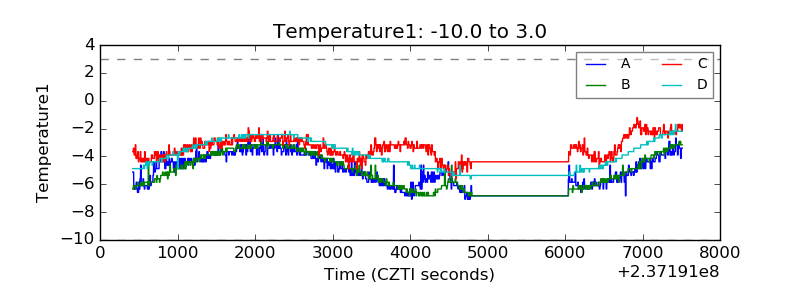 |
| Veto HV Monitor | 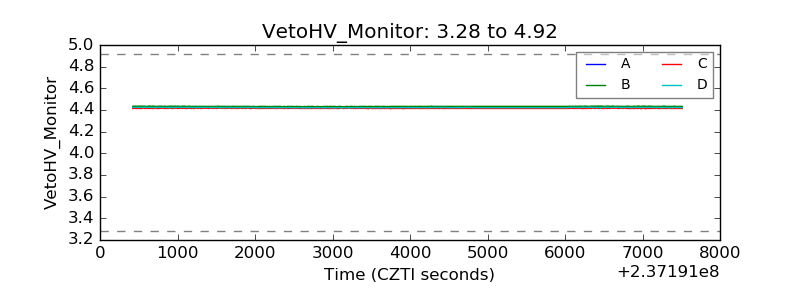 |
| Veto LLD | 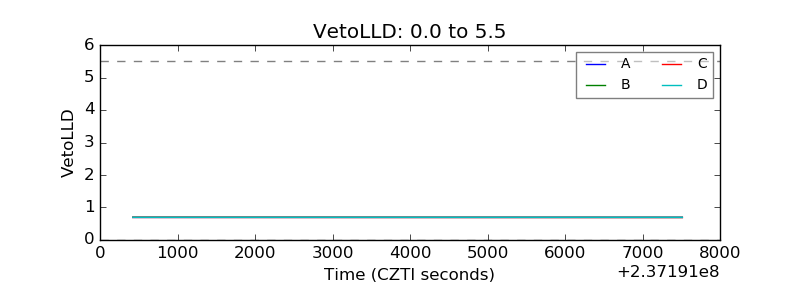 |
| Alpha Counter | 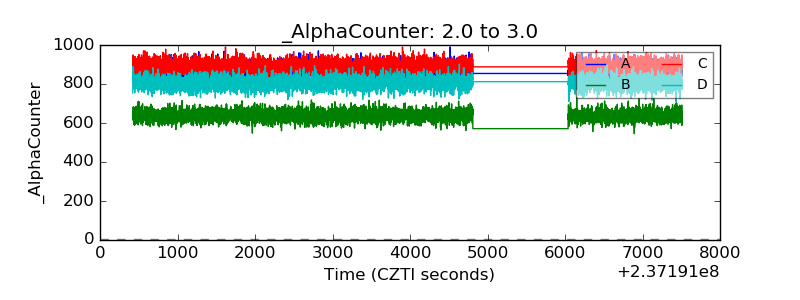 |
| _CPM_Rate | 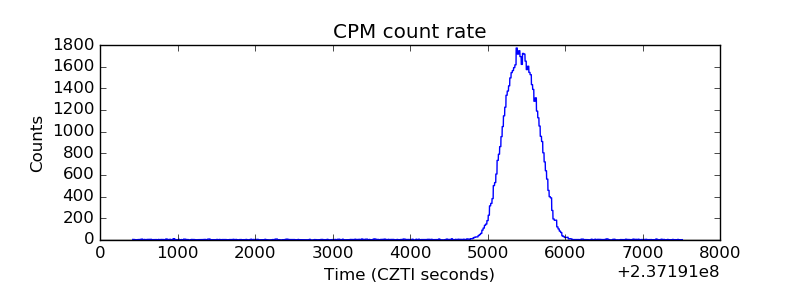 |
| CZT Counter | 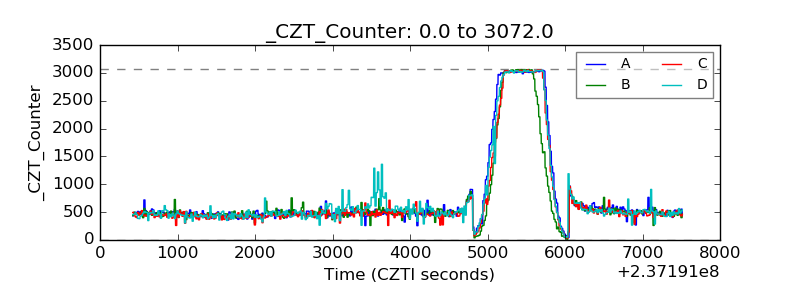 |
| +2.5 Volts monitor | 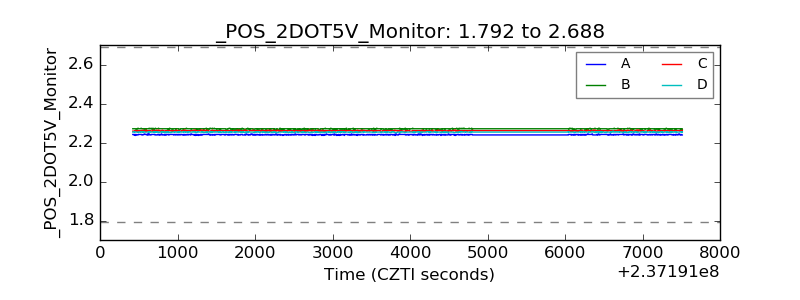 |
| +5 Volts monitor |  |
| _ROLL_ROT | 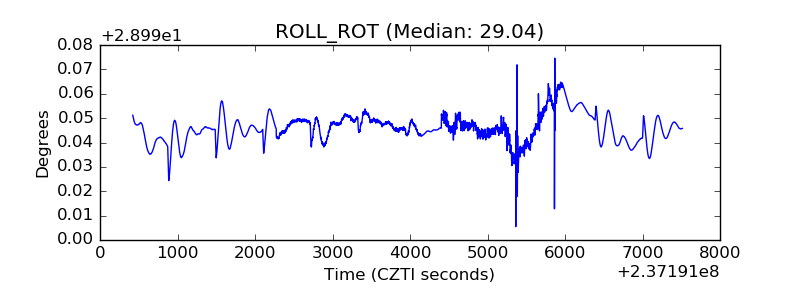 |
| _Roll_DEC | 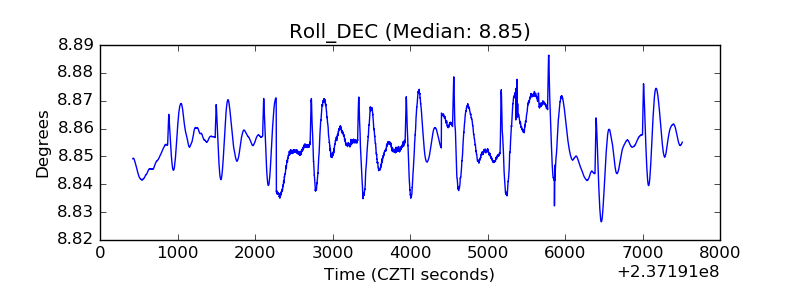 |
| _Roll_RA | 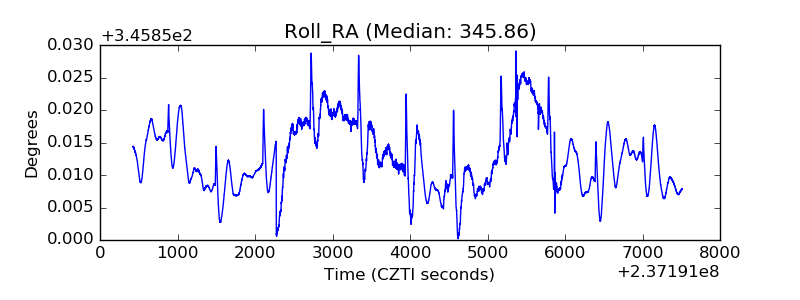 |
| Veto Counter | 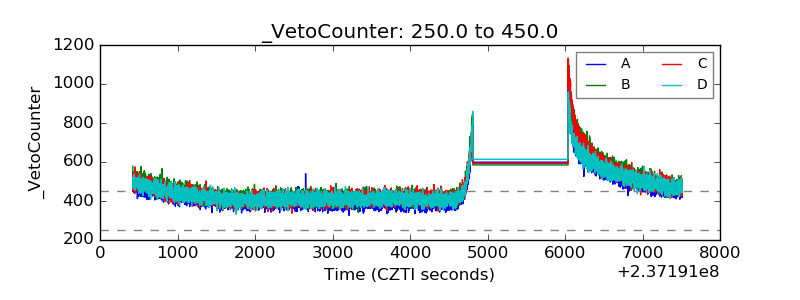 |