| Param | Original file | Final file |
|---|---|---|
| Filename | modeM0/AS1G05_238T01_9000001364_09612cztM0_level2.evt | modeM0/AS1G05_238T01_9000001364_09612cztM0_level2_quad_clean.evt |
| Size (bytes) | 491,837,760 | 65,770,560 |
| Size | 469.1 MB | 62.7 MB |
| Events in quadrant A | 3,346,663 | 394,574 |
| Events in quadrant B | 3,519,888 | 389,832 |
| Events in quadrant C | 3,224,792 | 380,794 |
| Events in quadrant D | 4,360,096 | 370,060 |
| Mode M0 | |||
|---|---|---|---|
| Quadrant | BADHDUFLAG | Total packets | Discarded packets |
| A | 0 | 13787 | 3 |
| B | 0 | 14366 | 2 |
| C | 0 | 13642 | 2 |
| D | 0 | 17415 | 2 |
| Mode SS | |||
|---|---|---|---|
| Quadrant | BADHDUFLAG | Total packets | Discarded packets |
| A | 0 | 132 | 0 |
| B | 0 | 132 | 0 |
| C | 0 | 132 | 0 |
| D | 0 | 132 | 0 |
| Mode M9 | |||
|---|---|---|---|
| Quadrant | BADHDUFLAG | Total packets | Discarded packets |
| A | 0 | 17 | 0 |
| B | 0 | 17 | 0 |
| C | 0 | 17 | 0 |
| D | 0 | 18 | 0 |
| Quadrant | Total seconds | Saturated seconds | Saturation percentage |
|---|---|---|---|
| A | 6541 | 150 | 2.293227% |
| B | 6541 | 160 | 2.446109% |
| C | 6541 | 102 | 1.559395% |
| D | 6541 | 164 | 2.507262% |
Noise dominated data is calculated using 1-second bins in cleaned event files. If a bin has >2000 counts, and if more than 50% of those come from <1% of pixels, then it is considered to be noise-dominated and hence unusable.
| Quadrant | # 1 sec bins | Bins with >0 counts | Bins with >2000 counts | High rate bins dominated by noise | Noise dominated (total time) | Noise dominated (detector-on time) | Marked lightcurve |
|---|---|---|---|---|---|---|---|
| A | 7721 | 6542 | 0 | 0 | 0.00% | 0.00% | 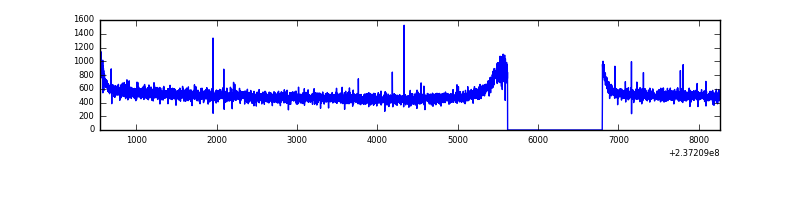 |
| B | 7721 | 6541 | 6 | 6 | 0.08% | 0.09% | 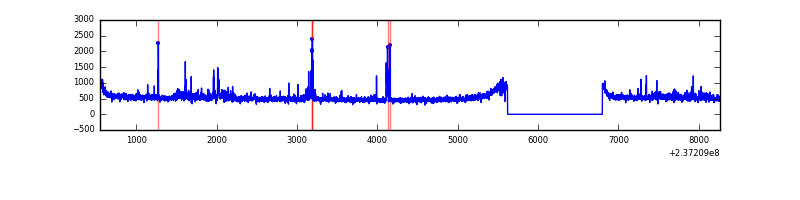 |
| C | 7721 | 6542 | 0 | 0 | 0.00% | 0.00% | 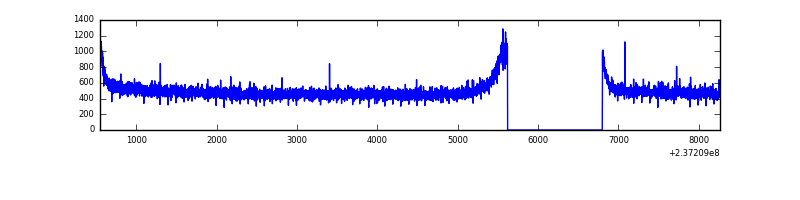 |
| D | 7721 | 6542 | 44 | 44 | 0.57% | 0.67% | 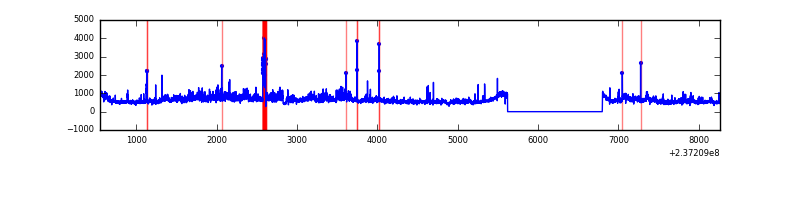 |
Top three noisy pixels from each quadrant. If the there are fewer than three noisy pixels in the level2.evt file, extra rows are filled as -1
| Pixel properties | Quadrant properties | ||||||
|---|---|---|---|---|---|---|---|
| Quadrant | DetID | PixID | Counts | Sigma | Mean | Median | Sigma |
| A | 13 | 14 | 13559 | 71.88 | 867 | 848 | 176.8 |
| A | 0 | 226 | 8086 | 40.93 | 867 | 848 | 176.8 |
| A | 12 | 194 | 7132 | 35.53 | 867 | 848 | 176.8 |
| B | 4 | 80 | 73523 | 445.34 | 857 | 837 | 163.2 |
| B | 0 | 214 | 68514 | 414.65 | 857 | 837 | 163.2 |
| B | 10 | 252 | 24858 | 147.17 | 857 | 837 | 163.2 |
| C | 13 | 61 | 6220 | 28.18 | 826 | 828 | 191.4 |
| C | 14 | 67 | 2294 | 7.66 | 826 | 828 | 191.4 |
| C | 3 | 202 | 2037 | 6.32 | 826 | 828 | 191.4 |
| D | 13 | 122 | 796034 | 3783.09 | 828 | 809 | 210.2 |
| D | 12 | 227 | 115151 | 543.95 | 828 | 809 | 210.2 |
| D | 6 | 240 | 88576 | 417.53 | 828 | 809 | 210.2 |
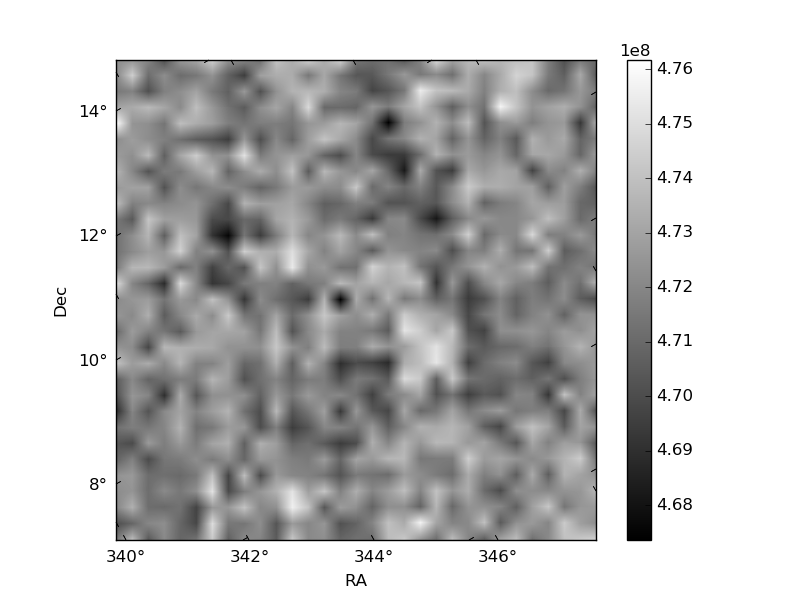
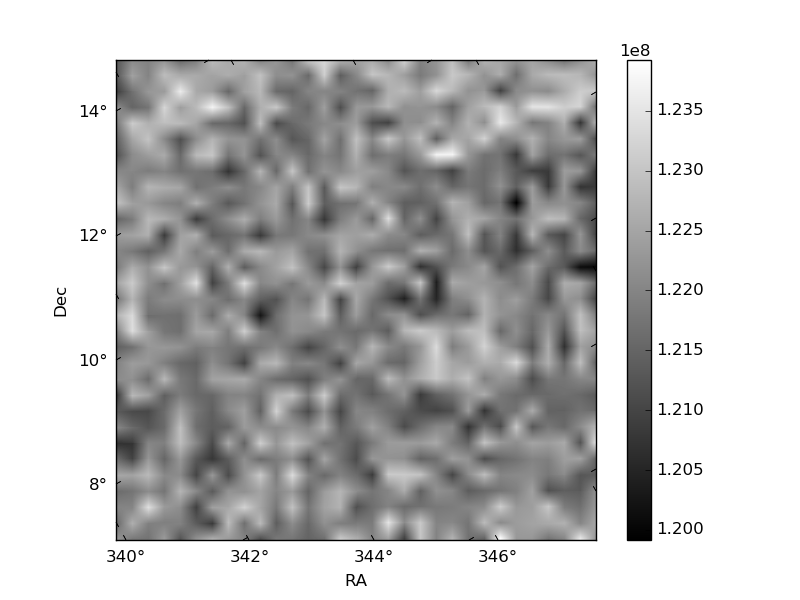
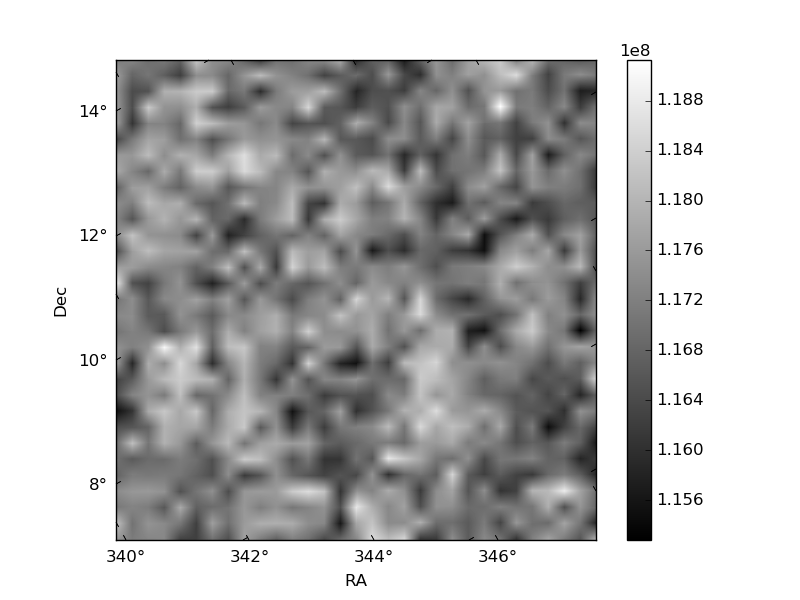
Histogram calculated using DETX and DETY for each event in the final _common_clean file
| Quadrant A | 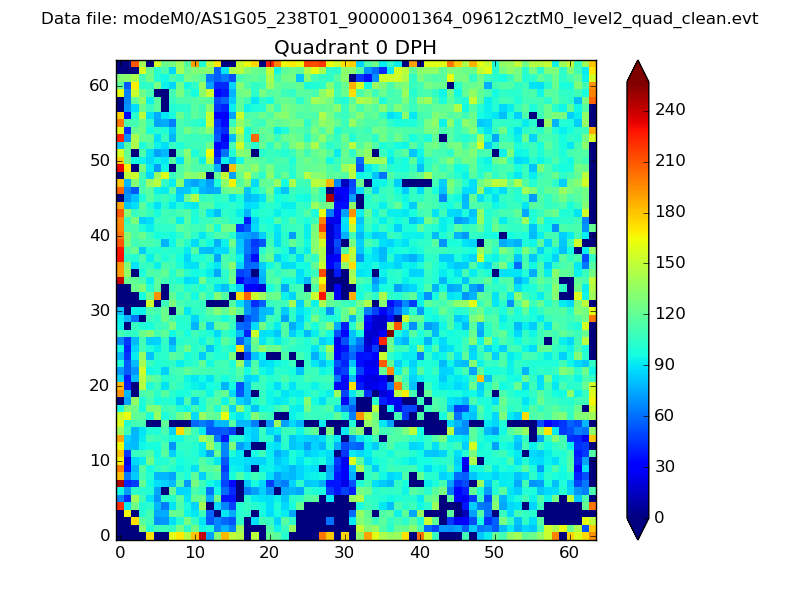 |
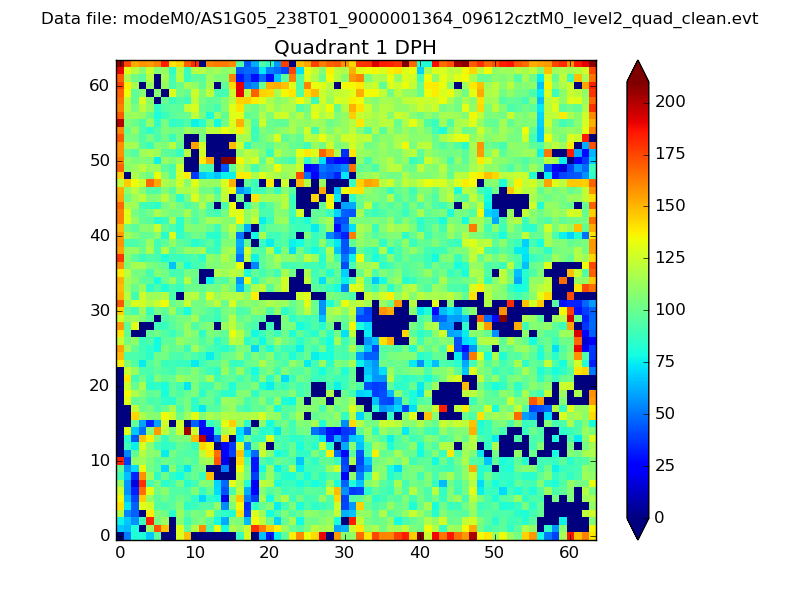 |
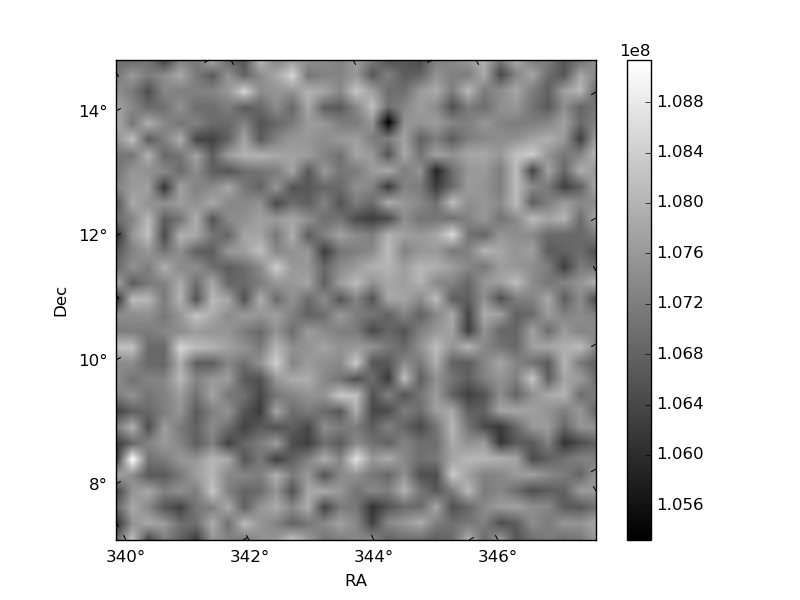
Quadrant B |
|---|---|---|---|
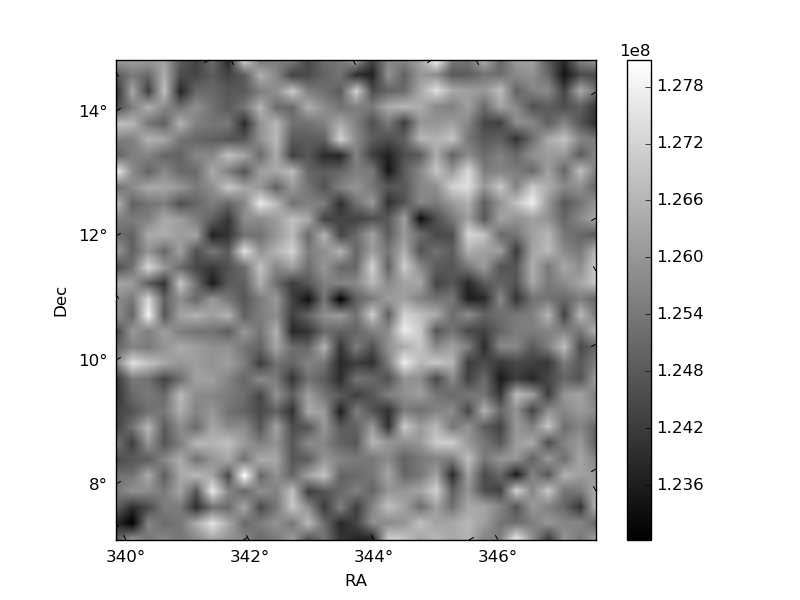
| Quadrant D | 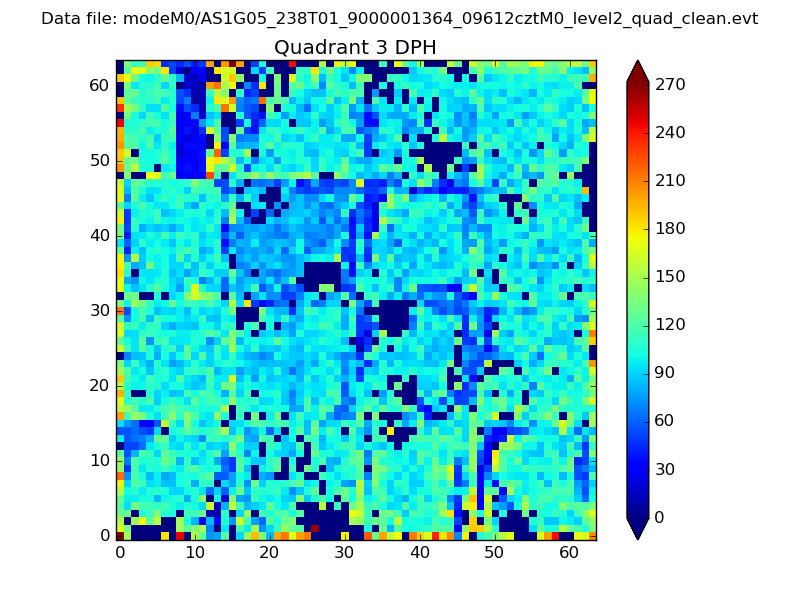 |
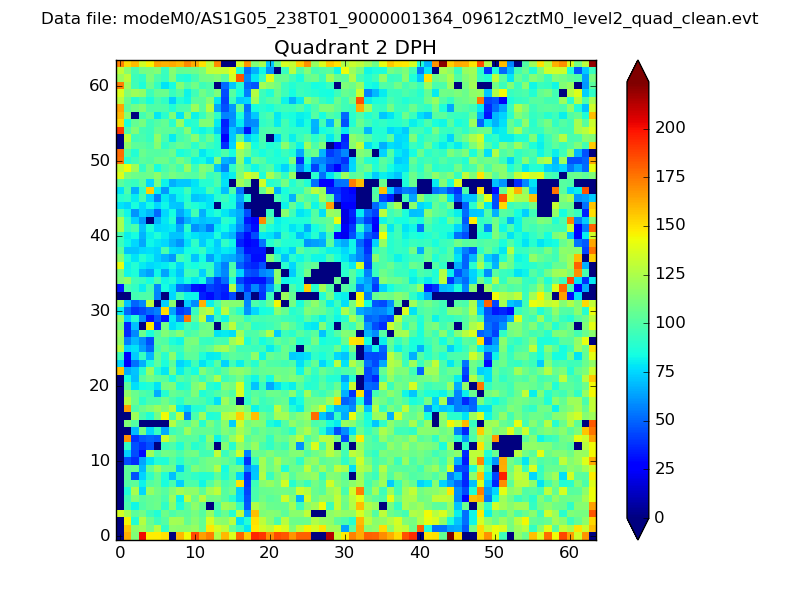 |
Quadrant C |
| Plot type | Count rate plots | Images |
|---|---|---|
| Comparison with Poisson distribution Blue bars denote a histogram of data divided into 1 sec bins. Red curve is a Poisson curve with rate = median count rate of data. |
 |
 |
| Quadrant-wise count rates Data is divided into 100 sec bins |
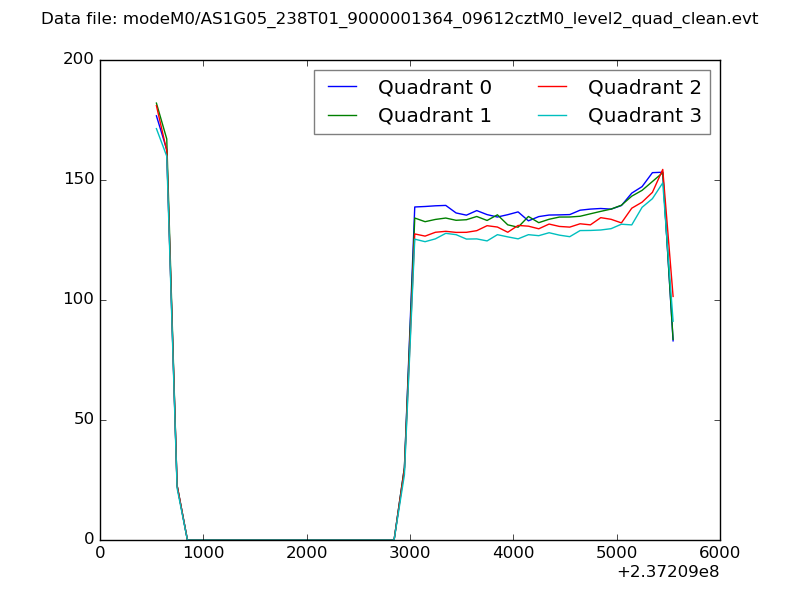 |
|
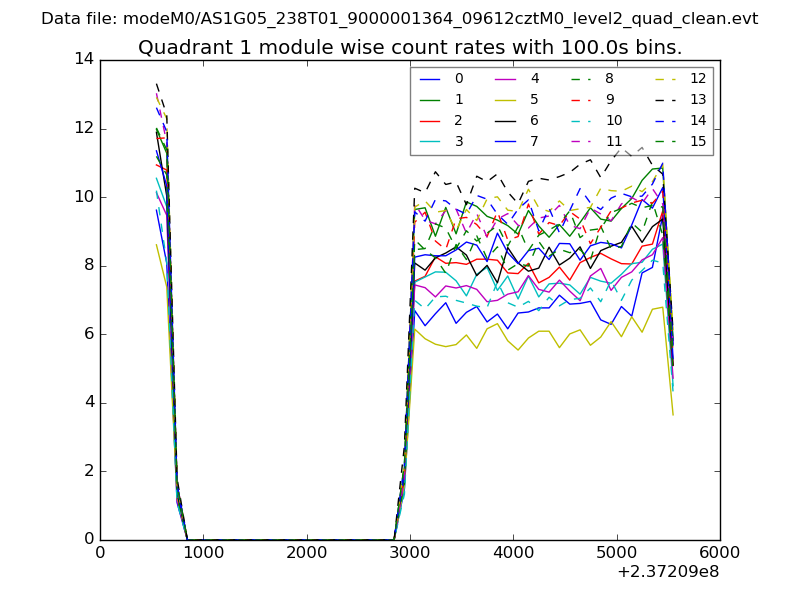
| Module-wise count rates for Quadrant A Data is divided into 100 sec bins |
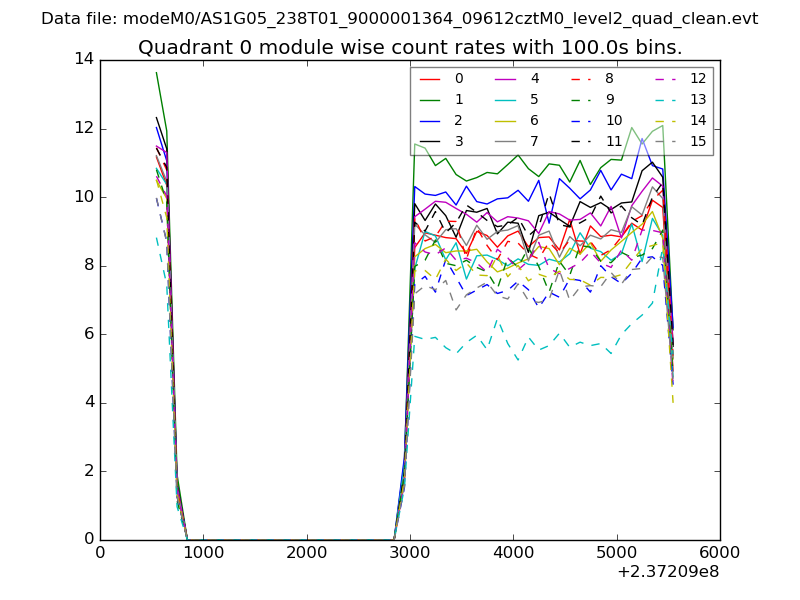 |
 |
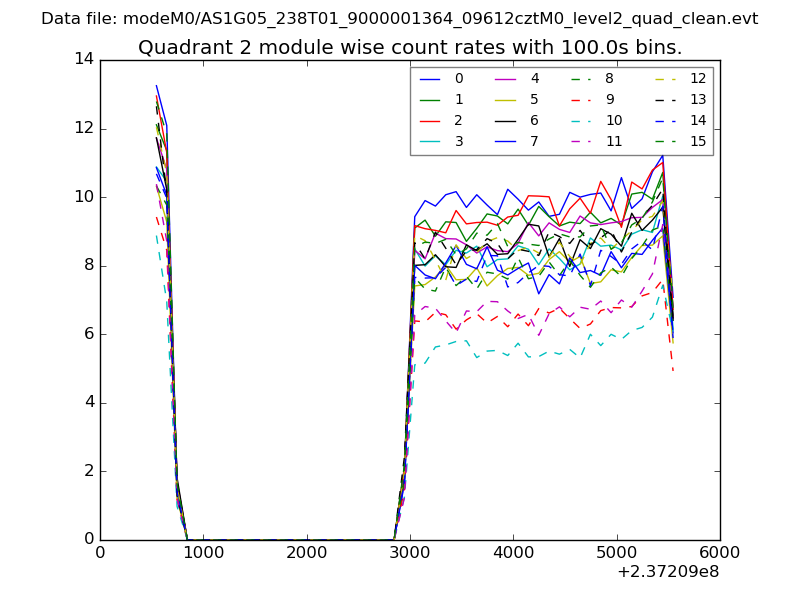
| Module-wise count rates for Quadrant B Data is divided into 100 sec bins |
 |
 |
| Module-wise count rates for Quadrant C Data is divided into 100 sec bins |
 |
 |
| Module-wise count rates for Quadrant D Data is divided into 100 sec bins |
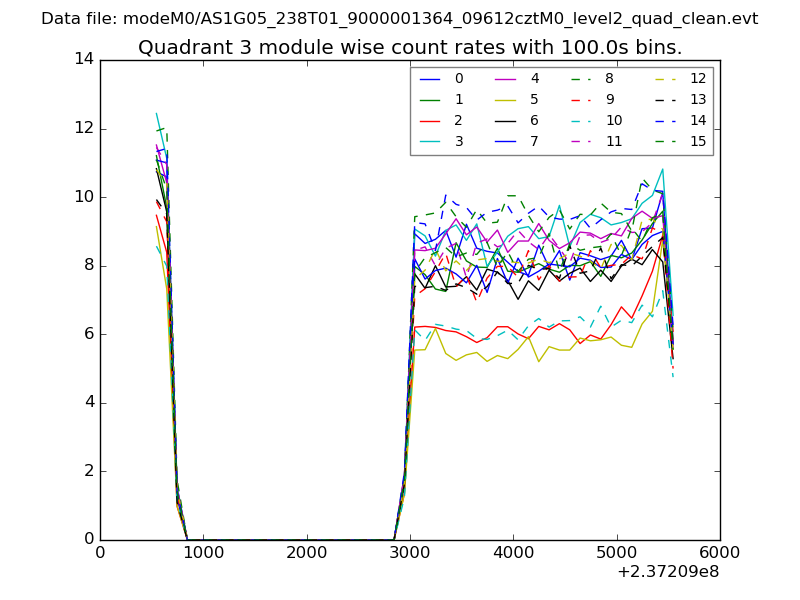 |
 |
| Parameter | Plot |
|---|---|
| CZT HV Monitor | 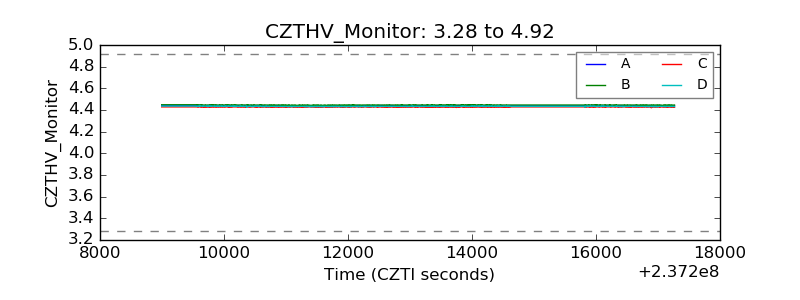 |
| D_VDD | 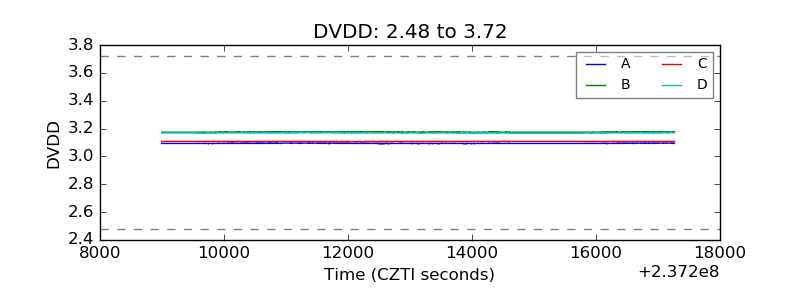 |
| Temperature 1 | 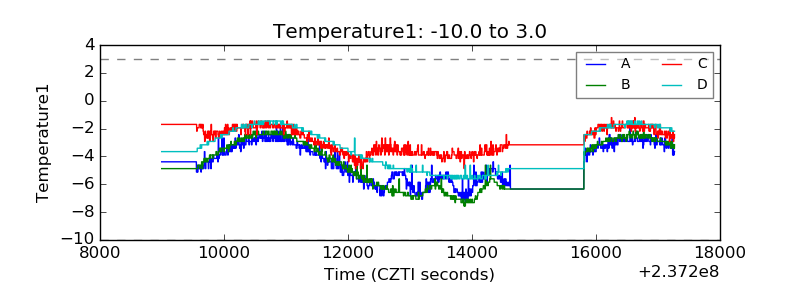 |
| Veto HV Monitor |  |
| Veto LLD | 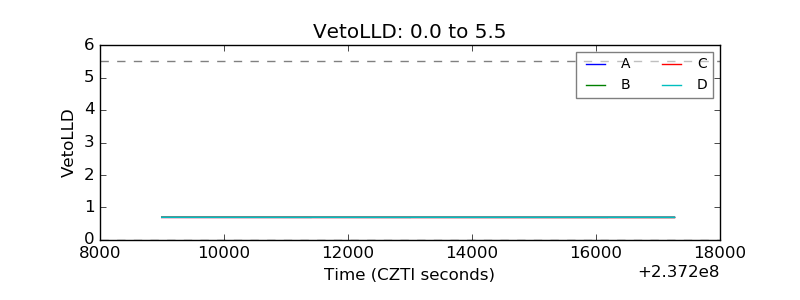 |
| Alpha Counter | 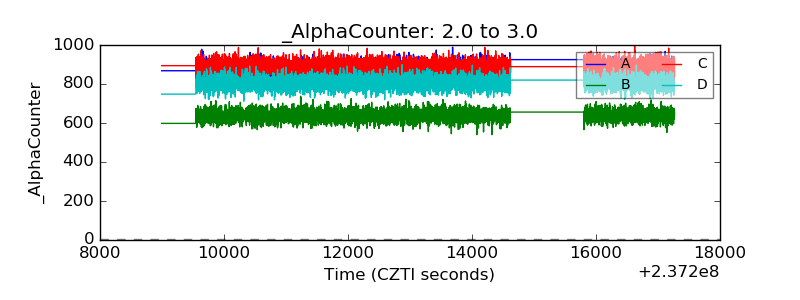 |
| _CPM_Rate | 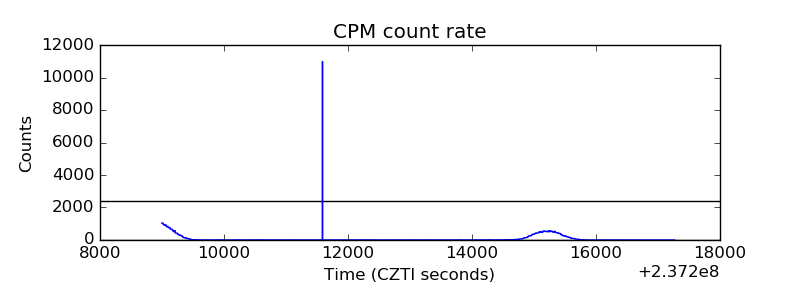 |
| CZT Counter | 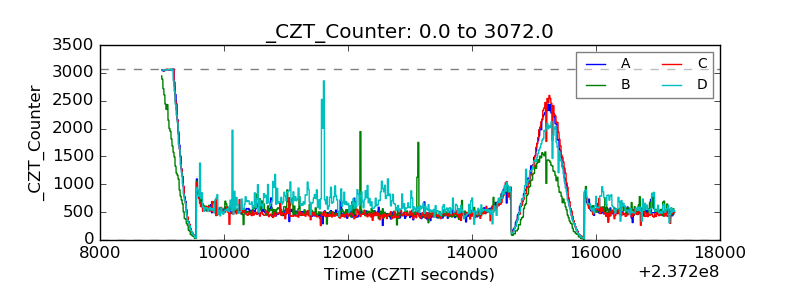 |
| +2.5 Volts monitor |  |
| +5 Volts monitor |  |
| _ROLL_ROT | 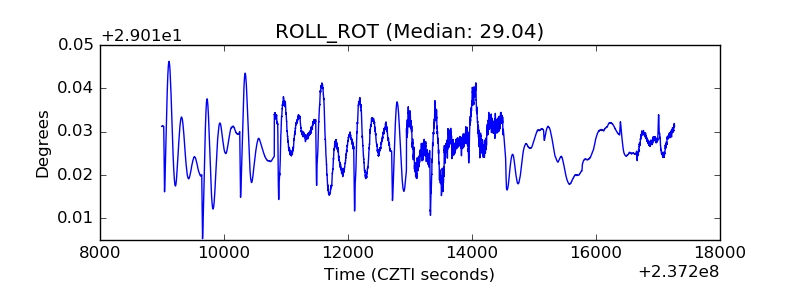 |
| _Roll_DEC | 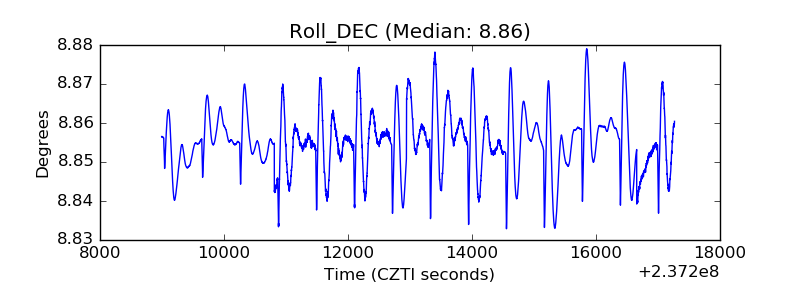 |
| _Roll_RA | 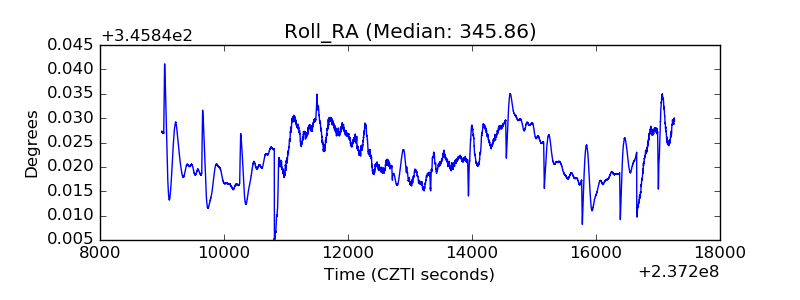 |
| Veto Counter | 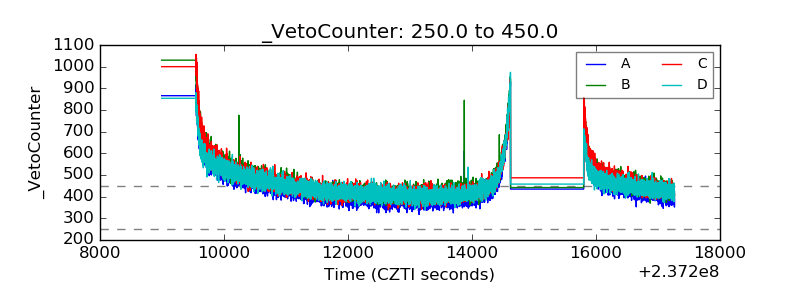 |