| Param | Original file | Final file |
|---|---|---|
| Filename | modeM0/AS1G05_238T01_9000001364_09614cztM0_level2.evt | modeM0/AS1G05_238T01_9000001364_09614cztM0_level2_quad_clean.evt |
| Size (bytes) | 681,419,520 | 114,310,080 |
| Size | 649.9 MB | 109.0 MB |
| Events in quadrant A | 4,739,801 | 716,247 |
| Events in quadrant B | 4,966,199 | 707,731 |
| Events in quadrant C | 4,623,610 | 689,015 |
| Events in quadrant D | 5,641,521 | 668,511 |
| Mode M0 | |||
|---|---|---|---|
| Quadrant | BADHDUFLAG | Total packets | Discarded packets |
| A | 0 | 23780 | 3443 |
| B | 0 | 24621 | 3724 |
| C | 0 | 23696 | 3423 |
| D | 0 | 26807 | 3786 |
| Mode SS | |||
|---|---|---|---|
| Quadrant | BADHDUFLAG | Total packets | Discarded packets |
| A | 0 | 234 | 38 |
| B | 0 | 234 | 36 |
| C | 0 | 234 | 36 |
| D | 0 | 234 | 26 |
| Mode M9 | |||
|---|---|---|---|
| Quadrant | BADHDUFLAG | Total packets | Discarded packets |
| A | 0 | 14 | 0 |
| B | 0 | 14 | 0 |
| C | 0 | 14 | 0 |
| D | 0 | 14 | 0 |
| Quadrant | Total seconds | Saturated seconds | Saturation percentage |
|---|---|---|---|
| A | 9811 | 181 | 1.844868% |
| B | 9804 | 217 | 2.213382% |
| C | 9822 | 153 | 1.557728% |
| D | 9761 | 199 | 2.038726% |
Noise dominated data is calculated using 1-second bins in cleaned event files. If a bin has >2000 counts, and if more than 50% of those come from <1% of pixels, then it is considered to be noise-dominated and hence unusable.
| Quadrant | # 1 sec bins | Bins with >0 counts | Bins with >2000 counts | High rate bins dominated by noise | Noise dominated (total time) | Noise dominated (detector-on time) | Marked lightcurve |
|---|---|---|---|---|---|---|---|
| A | 12962 | 10394 | 1 | 1 | 0.01% | 0.01% | 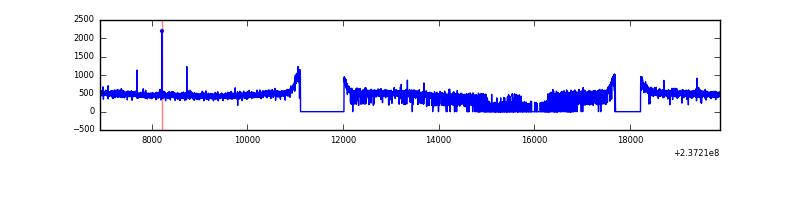 |
| B | 12962 | 10384 | 9 | 9 | 0.07% | 0.09% | 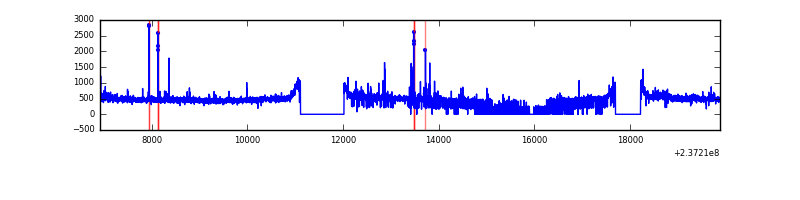 |
| C | 12962 | 10382 | 0 | 0 | 0.00% | 0.00% | 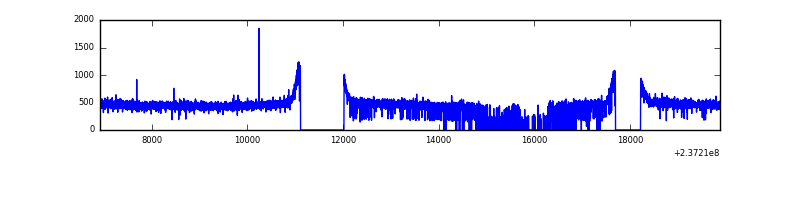 |
| D | 12962 | 10346 | 44 | 44 | 0.34% | 0.43% | 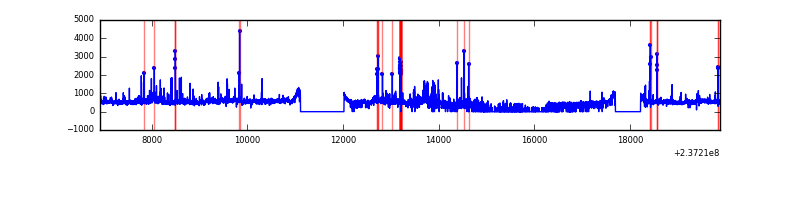 |
Top three noisy pixels from each quadrant. If the there are fewer than three noisy pixels in the level2.evt file, extra rows are filled as -1
| Pixel properties | Quadrant properties | ||||||
|---|---|---|---|---|---|---|---|
| Quadrant | DetID | PixID | Counts | Sigma | Mean | Median | Sigma |
| A | 0 | 226 | 11215 | 40.52 | 1228 | 1203 | 247.1 |
| A | 12 | 194 | 10021 | 35.69 | 1228 | 1203 | 247.1 |
| A | 13 | 248 | 5583 | 17.73 | 1228 | 1203 | 247.1 |
| B | 4 | 80 | 93190 | 390.73 | 1221 | 1192 | 235.4 |
| B | 0 | 214 | 69821 | 291.48 | 1221 | 1192 | 235.4 |
| B | 0 | 219 | 31036 | 126.75 | 1221 | 1192 | 235.4 |
| C | 13 | 61 | 8793 | 27.58 | 1182 | 1188 | 275.7 |
| C | 8 | 128 | 5723 | 16.45 | 1182 | 1188 | 275.7 |
| C | 14 | 234 | 4304 | 11.3 | 1182 | 1188 | 275.7 |
| D | 13 | 122 | 536384 | 1847.47 | 1174 | 1147 | 289.7 |
| D | 12 | 227 | 172322 | 590.84 | 1174 | 1147 | 289.7 |
| D | 6 | 240 | 149468 | 511.96 | 1174 | 1147 | 289.7 |
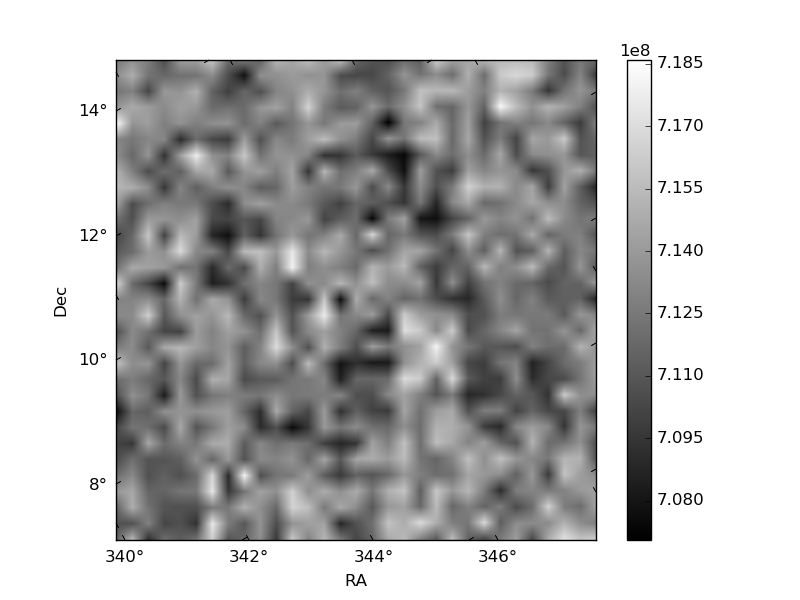
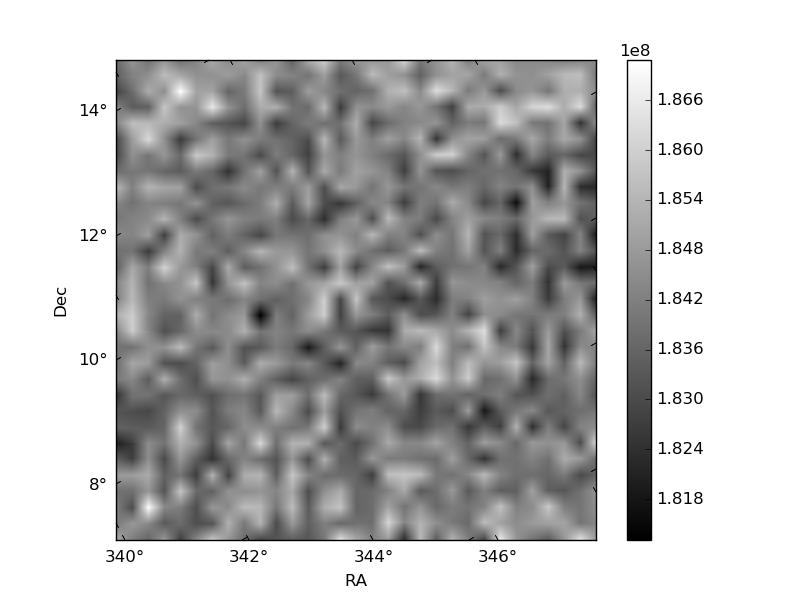
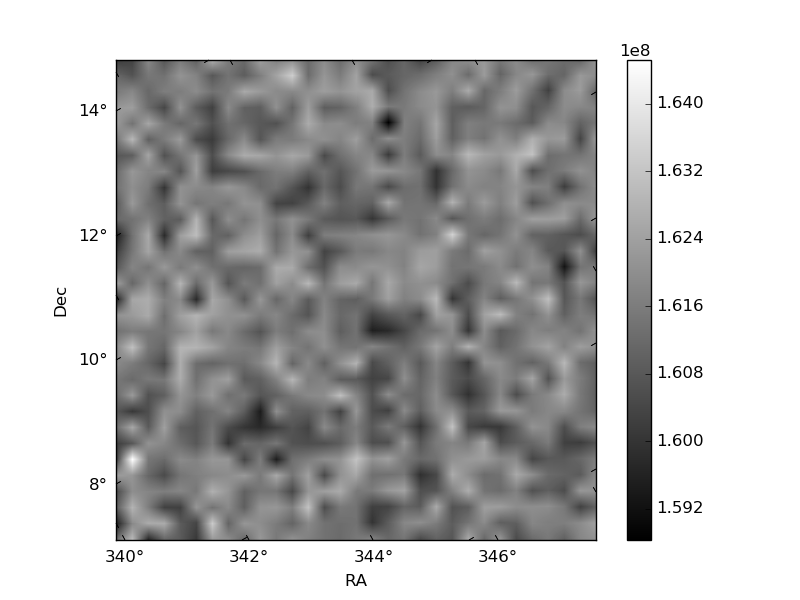
Histogram calculated using DETX and DETY for each event in the final _common_clean file
| Quadrant A | 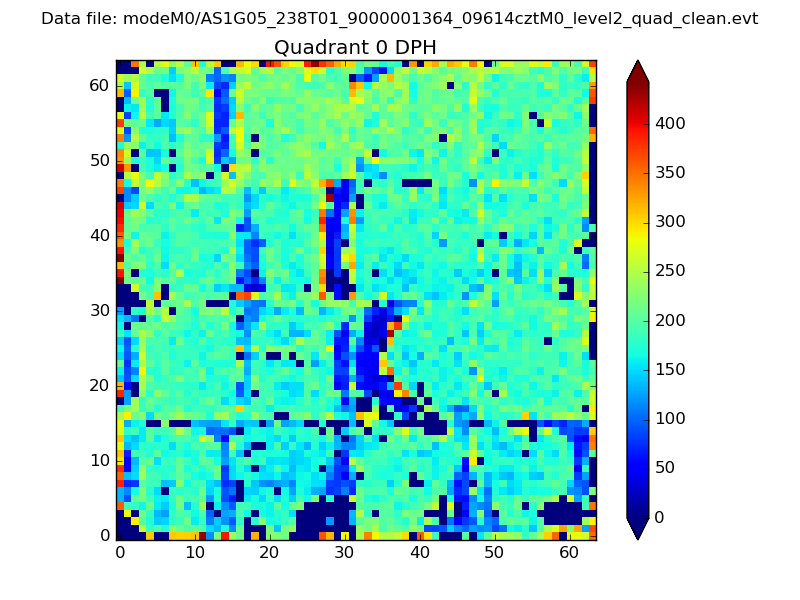 |
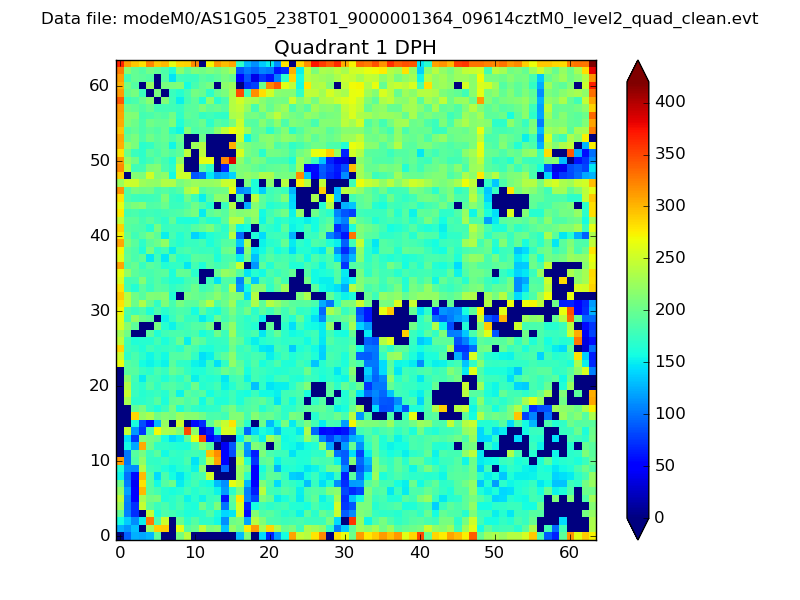 |
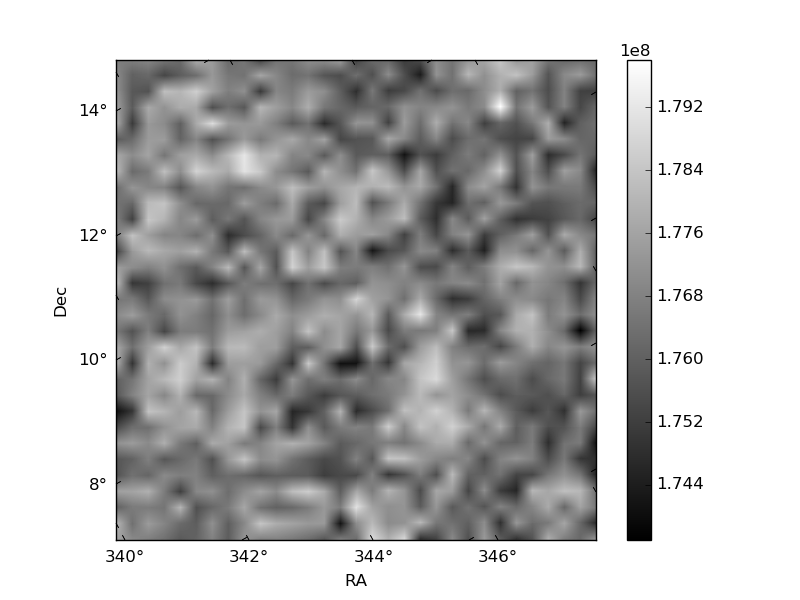
Quadrant B |
|---|---|---|---|
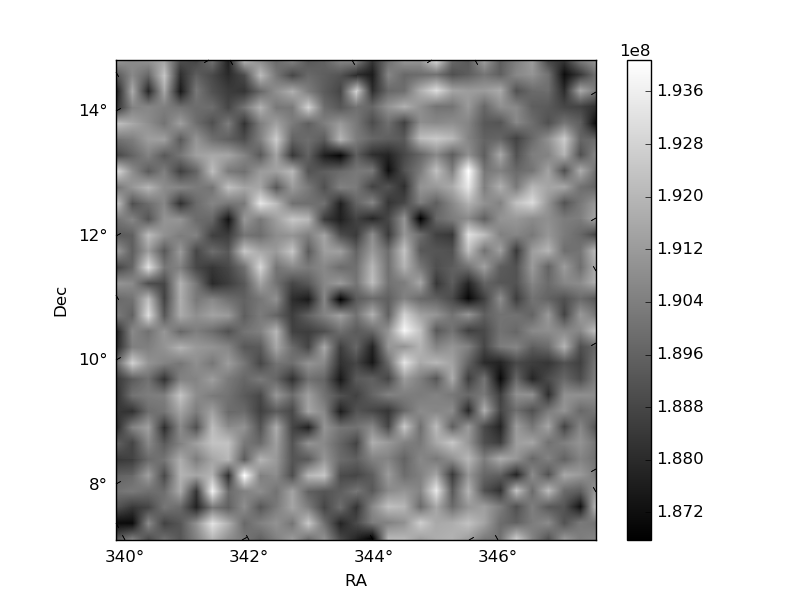
| Quadrant D | 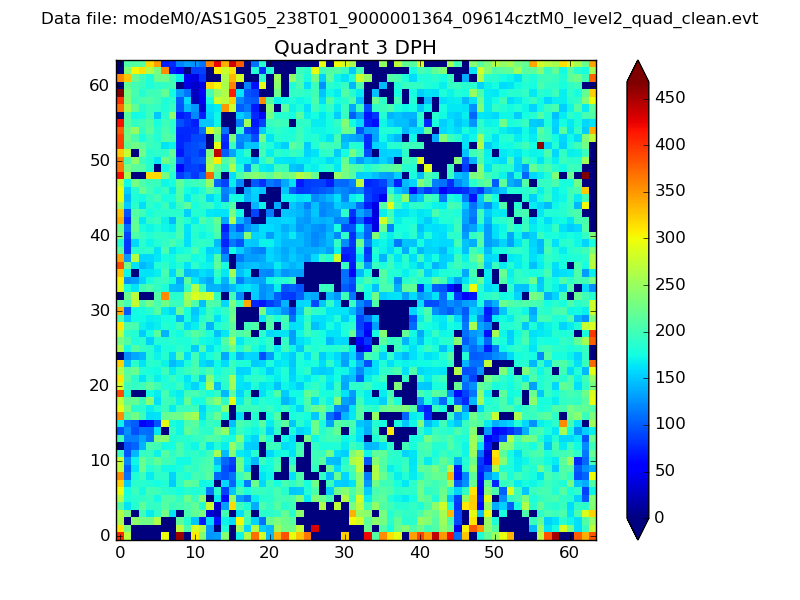 |
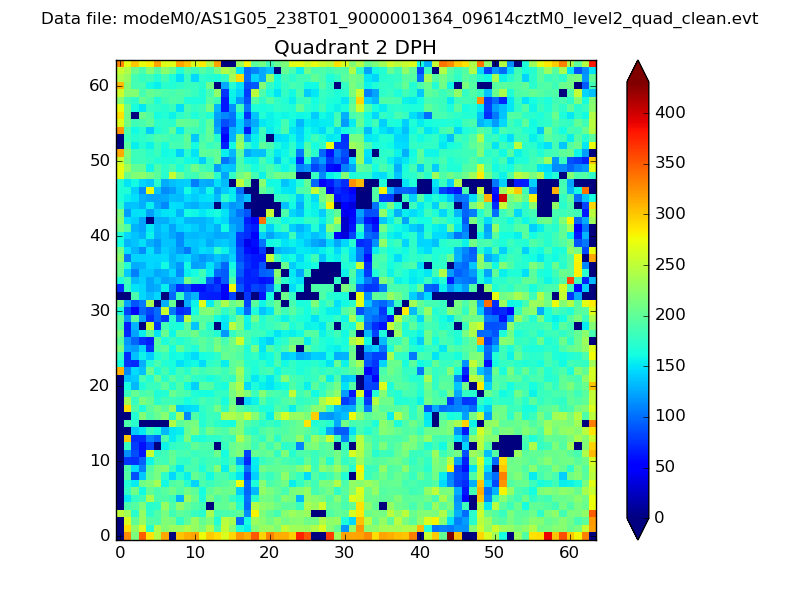 |
Quadrant C |
| Plot type | Count rate plots | Images |
|---|---|---|
| Comparison with Poisson distribution Blue bars denote a histogram of data divided into 1 sec bins. Red curve is a Poisson curve with rate = median count rate of data. |
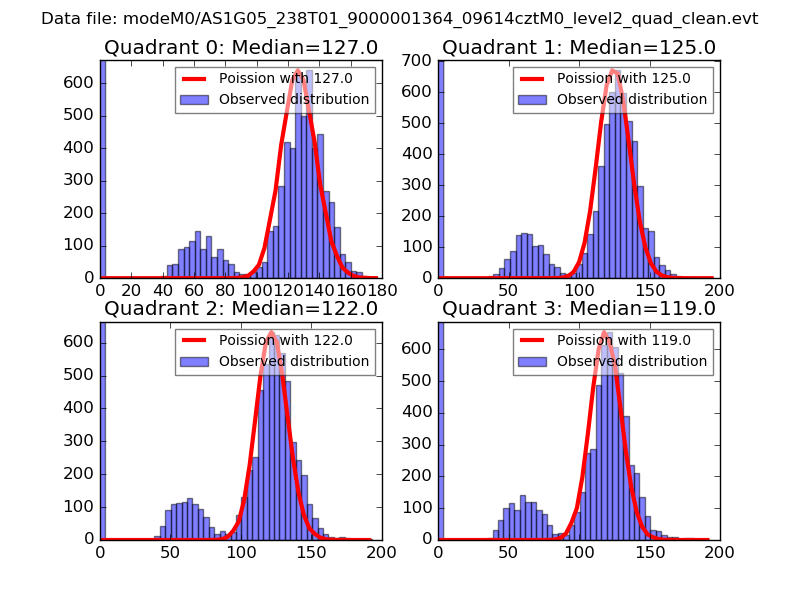 |
 |
| Quadrant-wise count rates Data is divided into 100 sec bins |
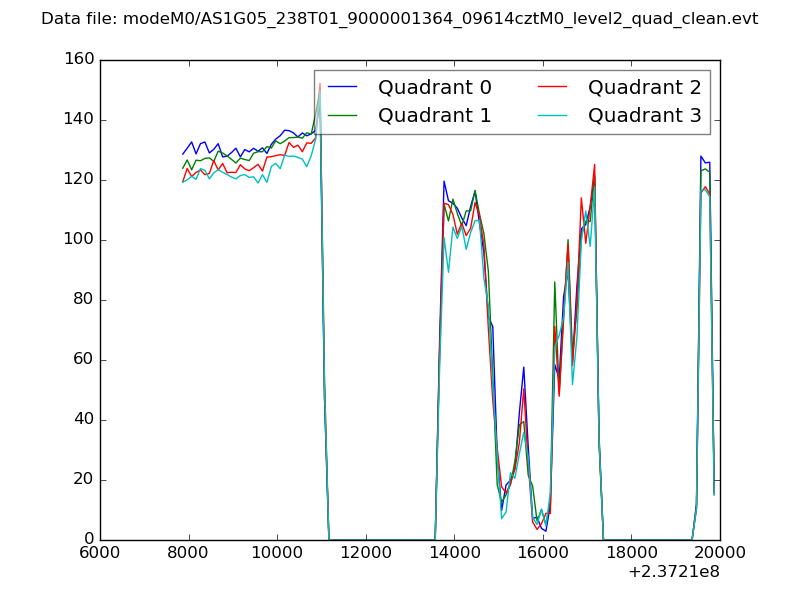 |
|
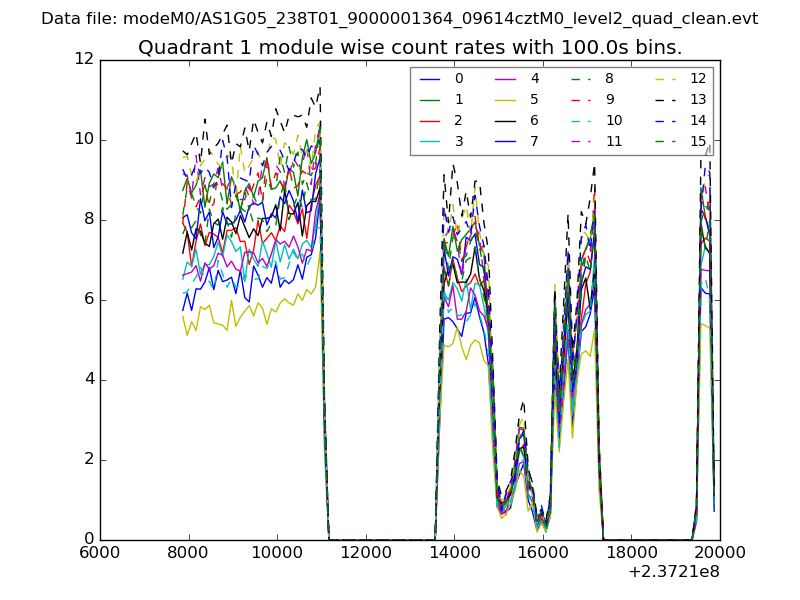
| Module-wise count rates for Quadrant A Data is divided into 100 sec bins |
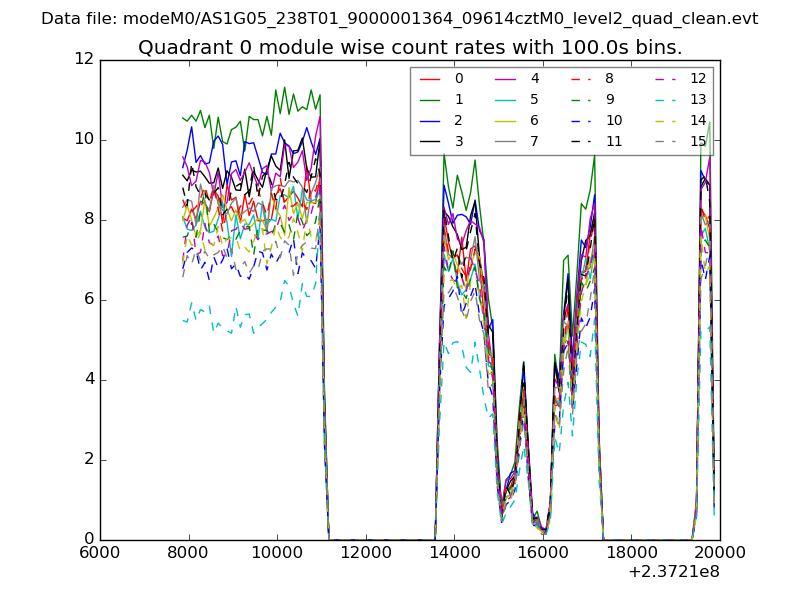 |
 |
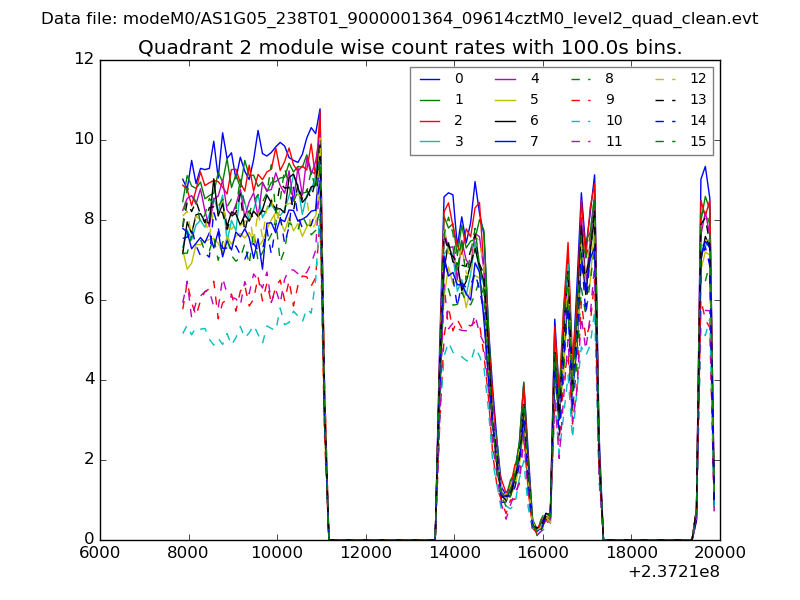
| Module-wise count rates for Quadrant B Data is divided into 100 sec bins |
 |
 |
| Module-wise count rates for Quadrant C Data is divided into 100 sec bins |
 |
 |
| Module-wise count rates for Quadrant D Data is divided into 100 sec bins |
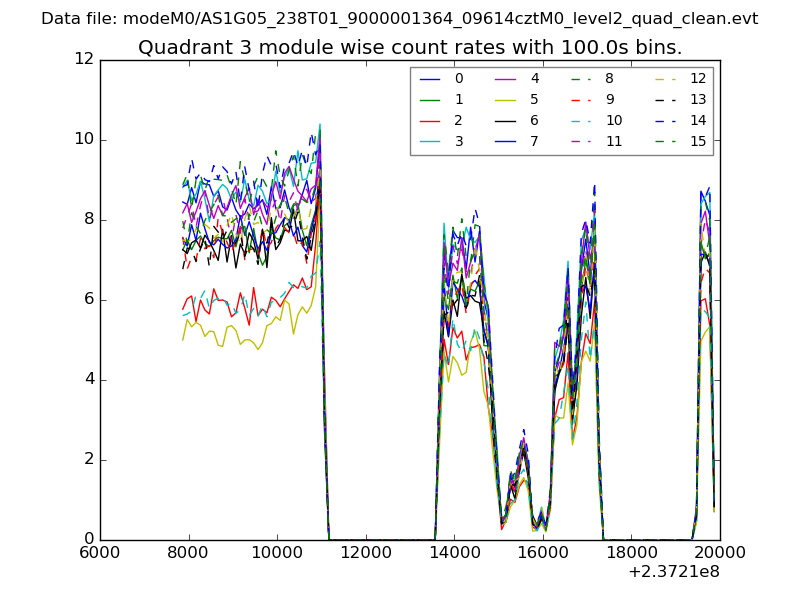 |
 |
| Parameter | Plot |
|---|---|
| CZT HV Monitor | 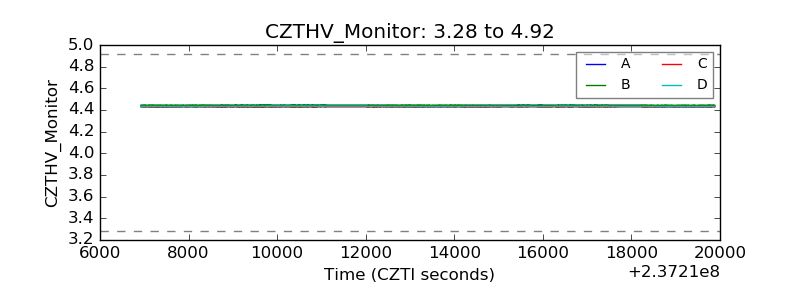 |
| D_VDD | 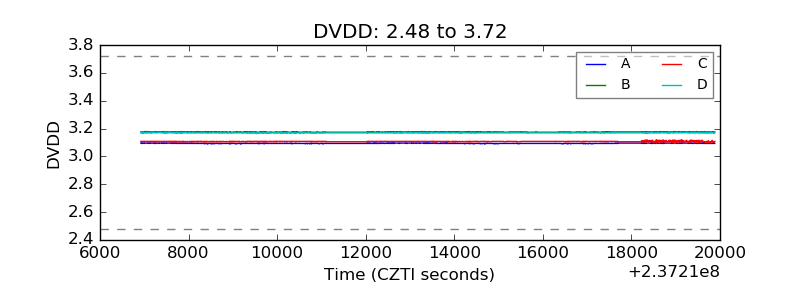 |
| Temperature 1 | 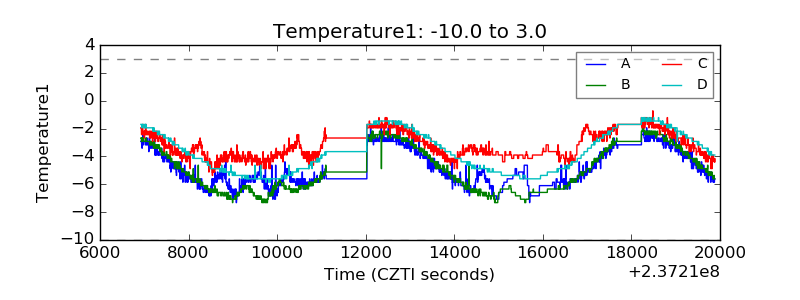 |
| Veto HV Monitor | 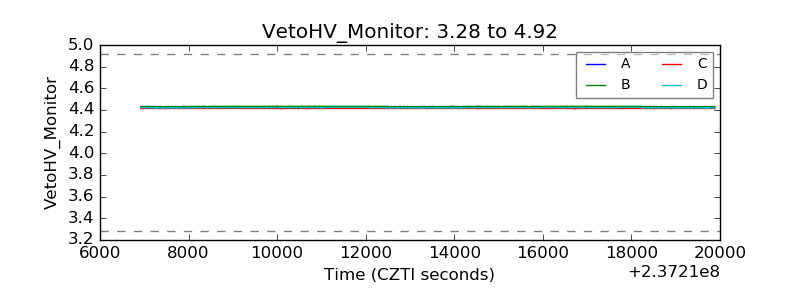 |
| Veto LLD | 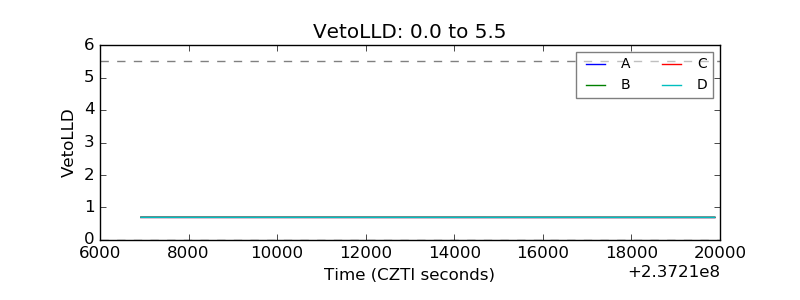 |
| Alpha Counter | 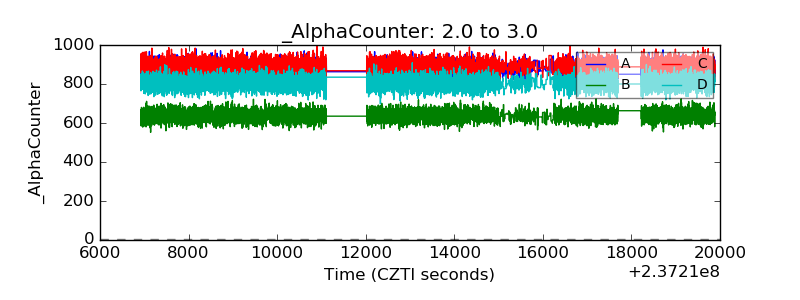 |
| _CPM_Rate | 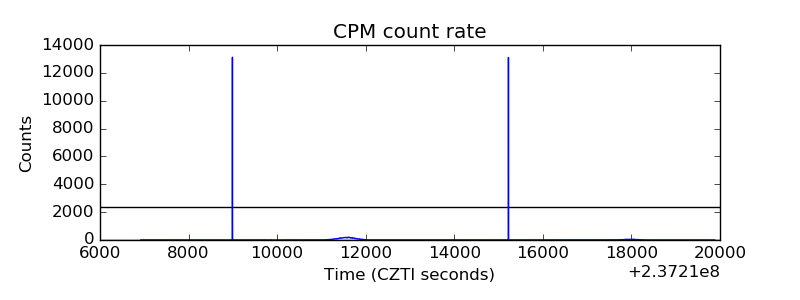 |
| CZT Counter | 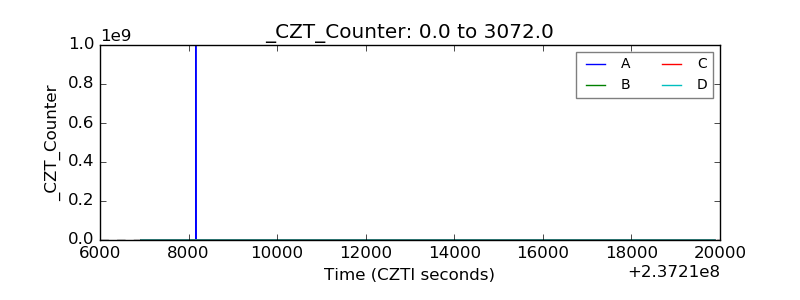 |
| +2.5 Volts monitor | 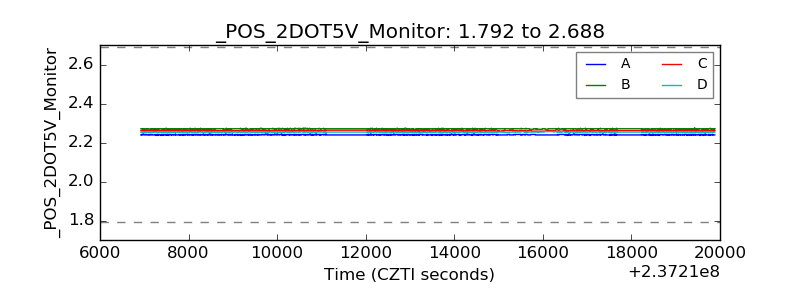 |
| +5 Volts monitor | 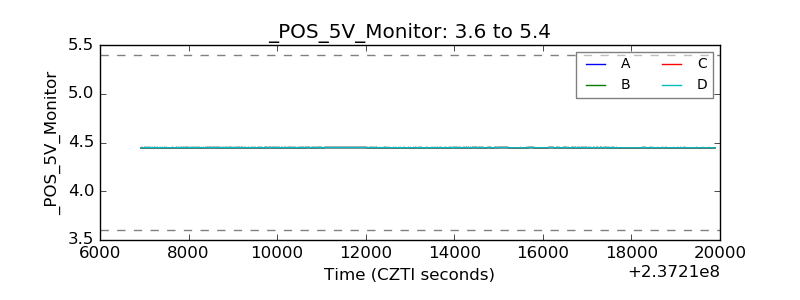 |
| _ROLL_ROT | 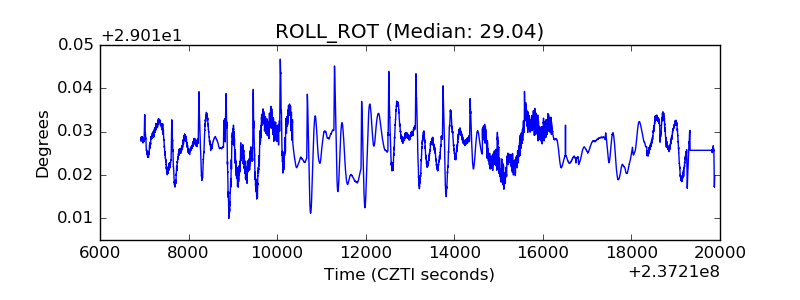 |
| _Roll_DEC | 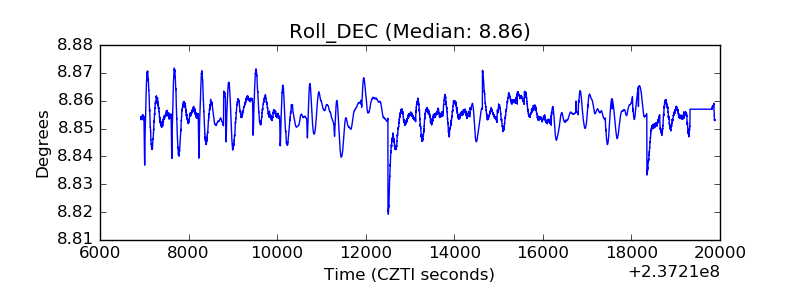 |
| _Roll_RA | 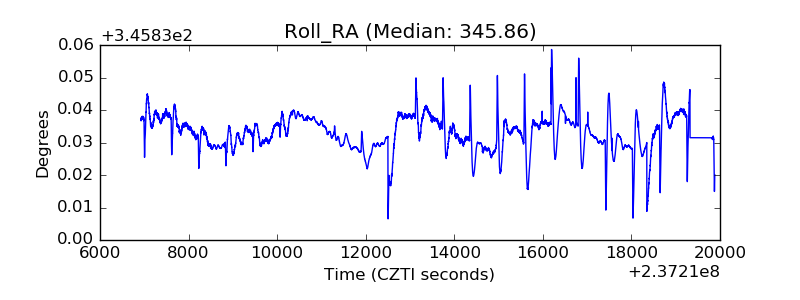 |
| Veto Counter | 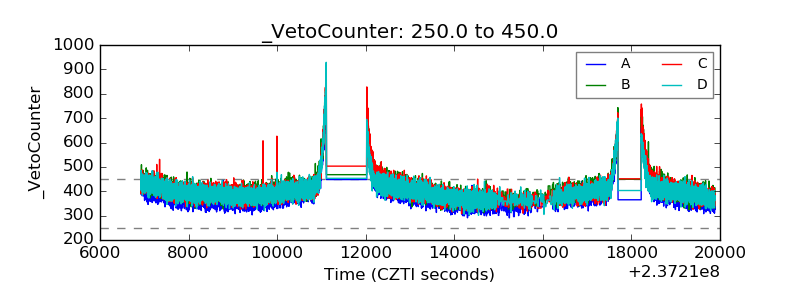 |