| Param | Original file | Final file |
|---|---|---|
| Filename | modeM0/AS1G05_238T01_9000001364_09615cztM0_level2.evt | modeM0/AS1G05_238T01_9000001364_09615cztM0_level2_quad_clean.evt |
| Size (bytes) | 149,630,400 | 23,071,680 |
| Size | 142.7 MB | 22.0 MB |
| Events in quadrant A | 1,060,365 | 137,189 |
| Events in quadrant B | 1,131,008 | 137,738 |
| Events in quadrant C | 1,093,373 | 135,350 |
| Events in quadrant D | 1,088,817 | 124,412 |
| Mode M0 | |||
|---|---|---|---|
| Quadrant | BADHDUFLAG | Total packets | Discarded packets |
| A | 0 | 16830 | 12282 |
| B | 0 | 17139 | 12407 |
| C | 0 | 16715 | 11942 |
| D | 0 | 18183 | 13610 |
| Mode SS | |||
|---|---|---|---|
| Quadrant | BADHDUFLAG | Total packets | Discarded packets |
| A | 0 | 165 | 115 |
| B | 0 | 164 | 115 |
| C | 0 | 163 | 120 |
| D | 0 | 165 | 125 |
| Mode M9 | |||
|---|---|---|---|
| Quadrant | BADHDUFLAG | Total packets | Discarded packets |
| A | 0 | 9 | 5 |
| B | 0 | 7 | 4 |
| C | 0 | 8 | 4 |
| D | 0 | 8 | 7 |
| Quadrant | Total seconds | Saturated seconds | Saturation percentage |
|---|---|---|---|
| A | 2235 | 18 | 0.805369% |
| B | 2279 | 32 | 1.404125% |
| C | 2346 | 11 | 0.468883% |
| D | 2138 | 14 | 0.654818% |
Noise dominated data is calculated using 1-second bins in cleaned event files. If a bin has >2000 counts, and if more than 50% of those come from <1% of pixels, then it is considered to be noise-dominated and hence unusable.
| Quadrant | # 1 sec bins | Bins with >0 counts | Bins with >2000 counts | High rate bins dominated by noise | Noise dominated (total time) | Noise dominated (detector-on time) | Marked lightcurve |
|---|---|---|---|---|---|---|---|
| A | 8937 | 3516 | 0 | 0 | 0.00% | 0.00% | 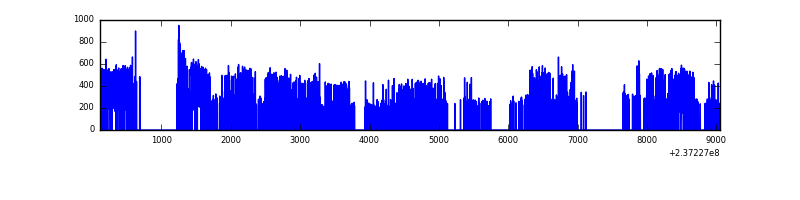 |
| B | 8931 | 3565 | 0 | 0 | 0.00% | 0.00% | 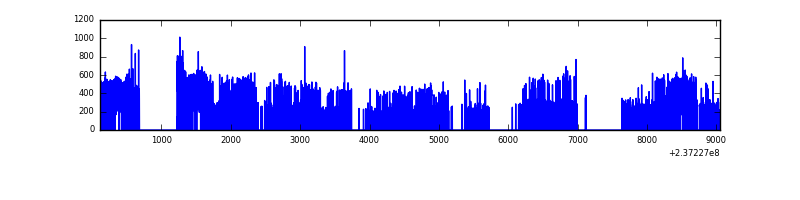 |
| C | 8922 | 3661 | 0 | 0 | 0.00% | 0.00% |  |
| D | 8936 | 3383 | 0 | 0 | 0.00% | 0.00% | 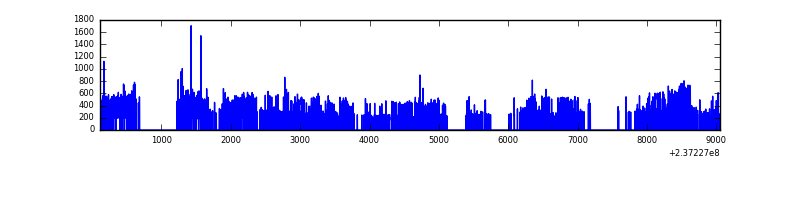 |
Top three noisy pixels from each quadrant. If the there are fewer than three noisy pixels in the level2.evt file, extra rows are filled as -1
| Pixel properties | Quadrant properties | ||||||
|---|---|---|---|---|---|---|---|
| Quadrant | DetID | PixID | Counts | Sigma | Mean | Median | Sigma |
| A | 0 | 226 | 2548 | 39.56 | 274 | 268 | 57.6 |
| A | 12 | 194 | 2328 | 35.74 | 274 | 268 | 57.6 |
| A | 13 | 14 | 2025 | 30.49 | 274 | 268 | 57.6 |
| B | 0 | 214 | 18344 | 324.24 | 279 | 273 | 55.7 |
| B | 0 | 219 | 13956 | 245.51 | 279 | 273 | 55.7 |
| B | 12 | 111 | 5991 | 102.6 | 279 | 273 | 55.7 |
| C | 8 | 128 | 4181 | 59.06 | 277 | 279 | 66.1 |
| C | 13 | 61 | 2080 | 27.26 | 277 | 279 | 66.1 |
| C | 8 | 112 | 1986 | 25.84 | 277 | 279 | 66.1 |
| D | 13 | 122 | 67211 | 1081.65 | 251 | 245 | 61.9 |
| D | 1 | 52 | 23904 | 382.14 | 251 | 245 | 61.9 |
| D | 2 | 234 | 9268 | 145.74 | 251 | 245 | 61.9 |
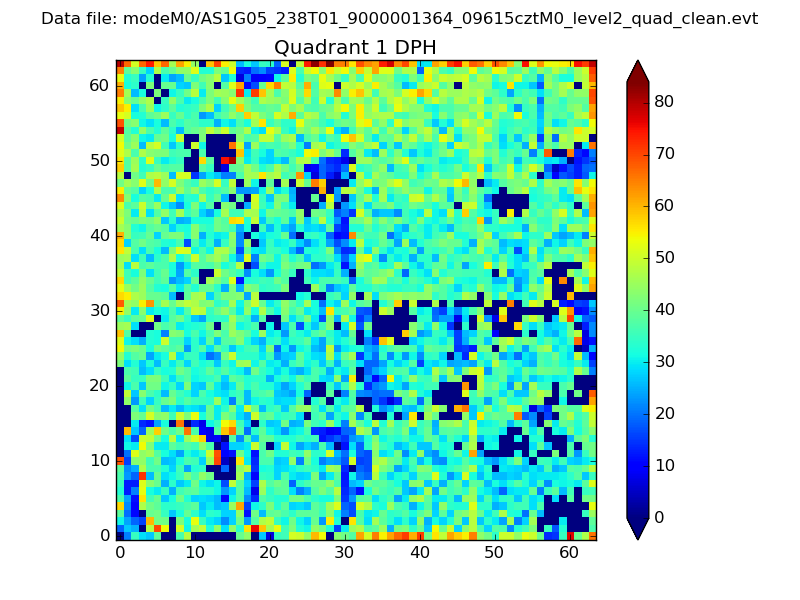
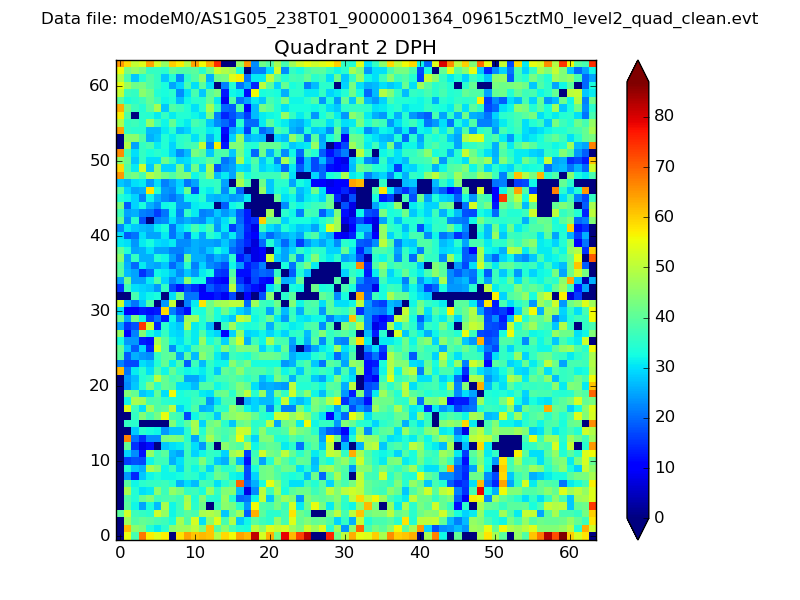
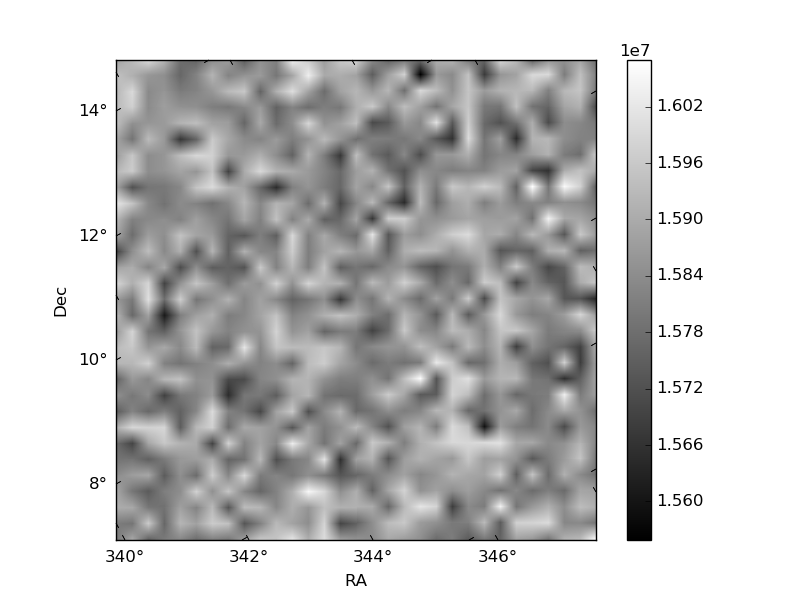
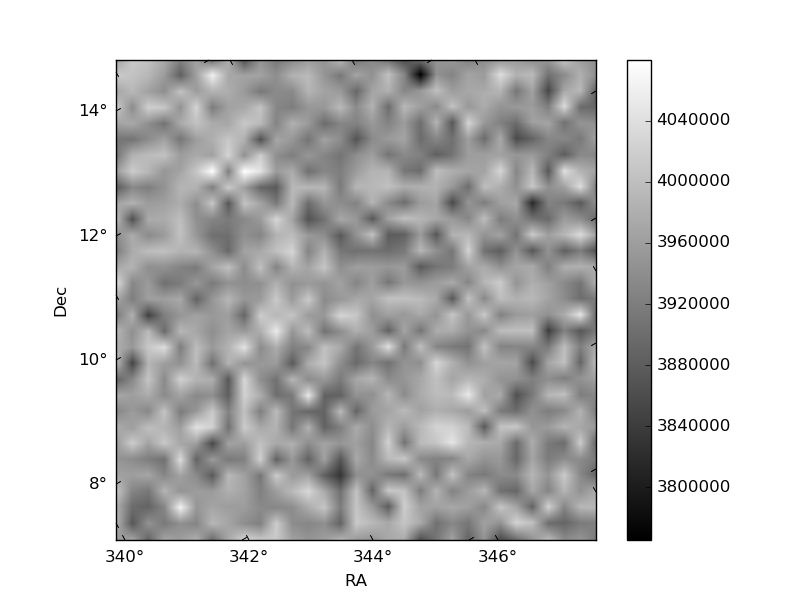
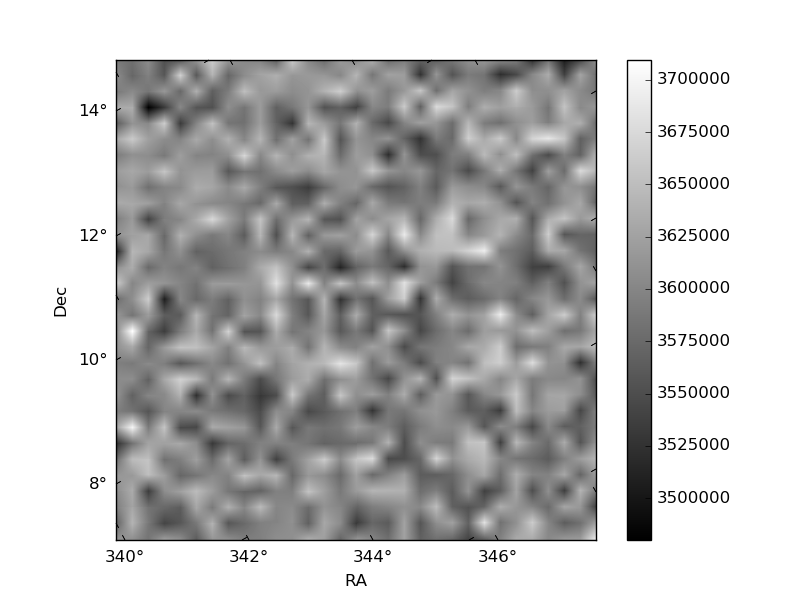
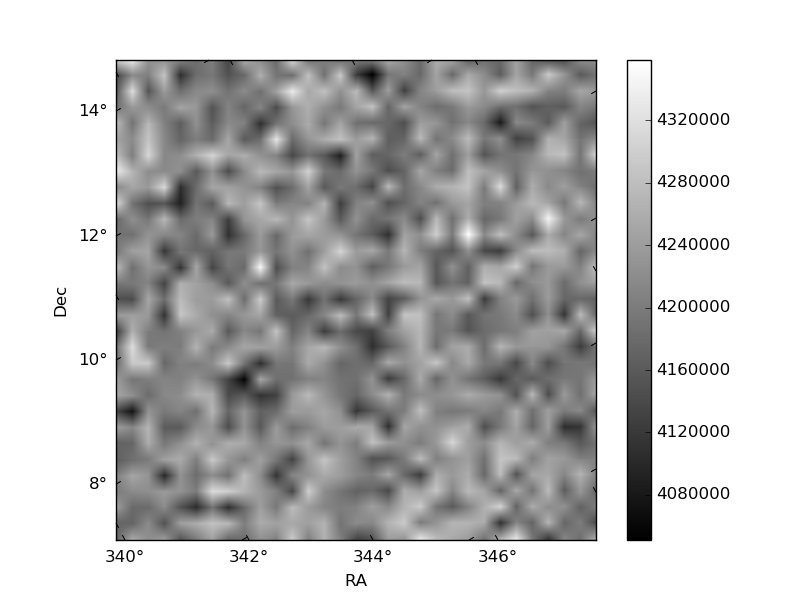
Histogram calculated using DETX and DETY for each event in the final _common_clean file
| Quadrant A | 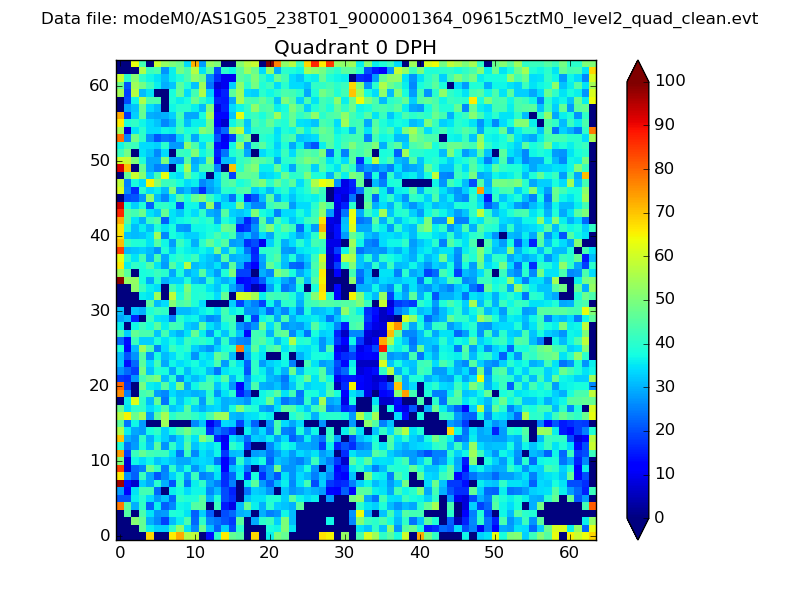 |
 |
Quadrant B |
|---|---|---|---|
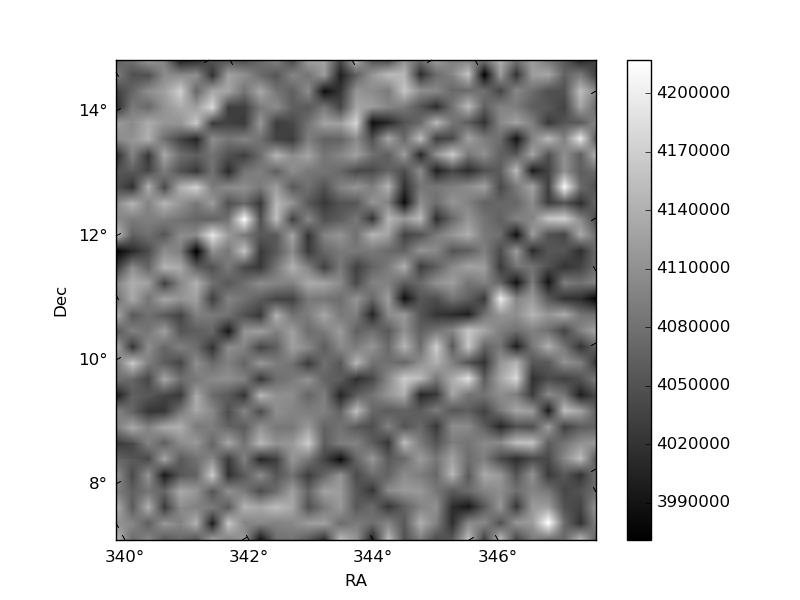
| Quadrant D | 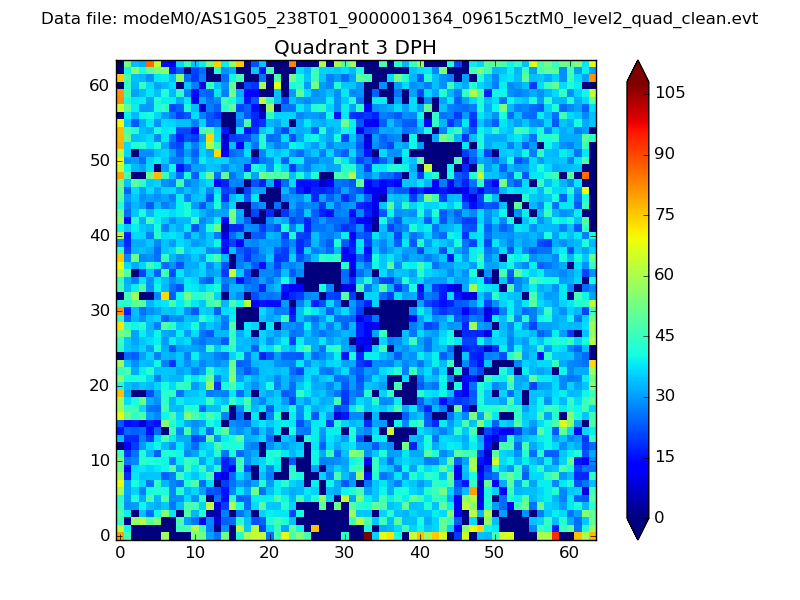 |
 |
Quadrant C |
| Plot type | Count rate plots | Images |
|---|---|---|
| Comparison with Poisson distribution Blue bars denote a histogram of data divided into 1 sec bins. Red curve is a Poisson curve with rate = median count rate of data. |
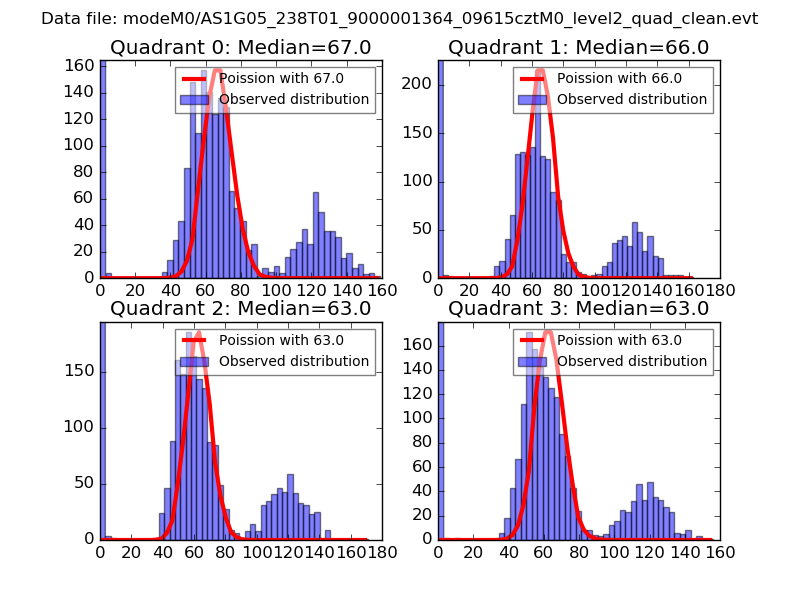 |
 |
| Quadrant-wise count rates Data is divided into 100 sec bins |
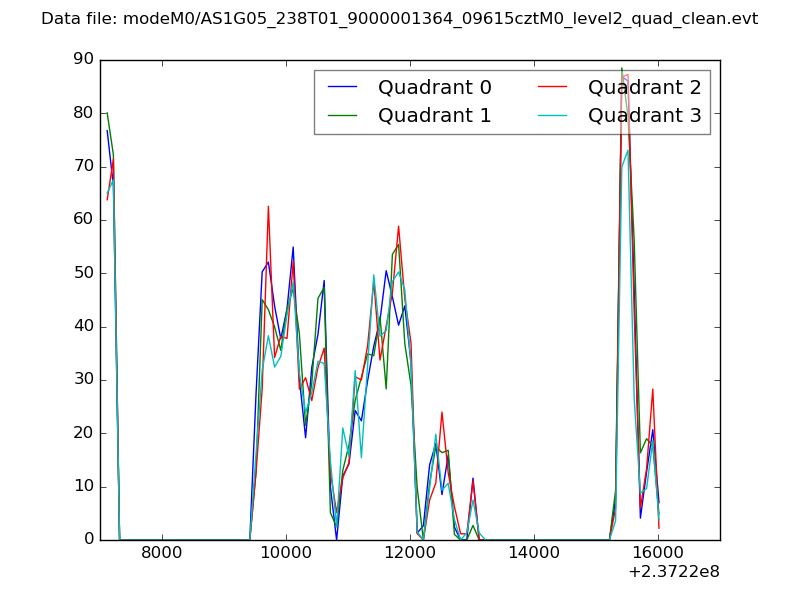 |
|
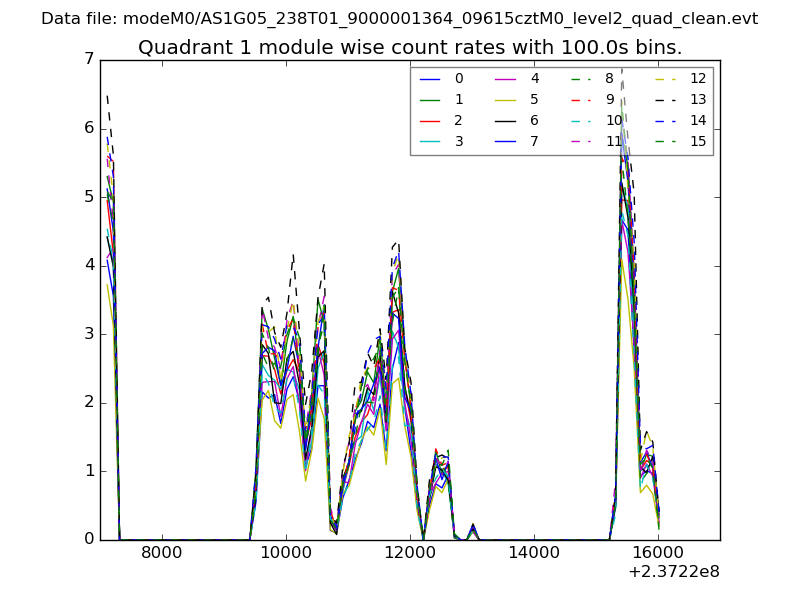
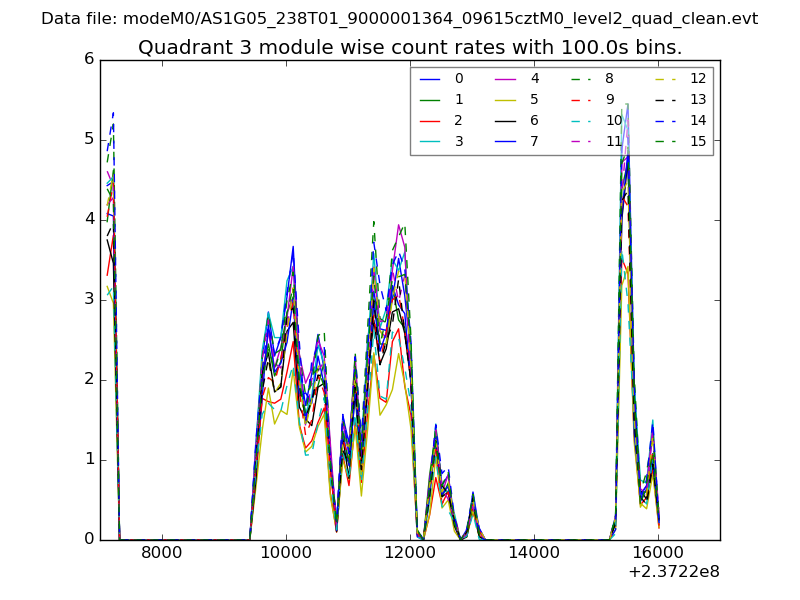
| Module-wise count rates for Quadrant A Data is divided into 100 sec bins |
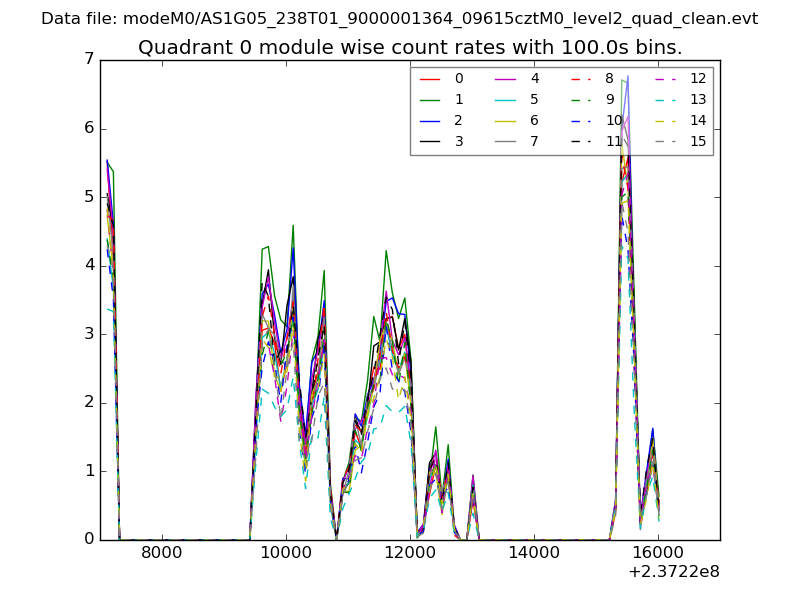 |
 |
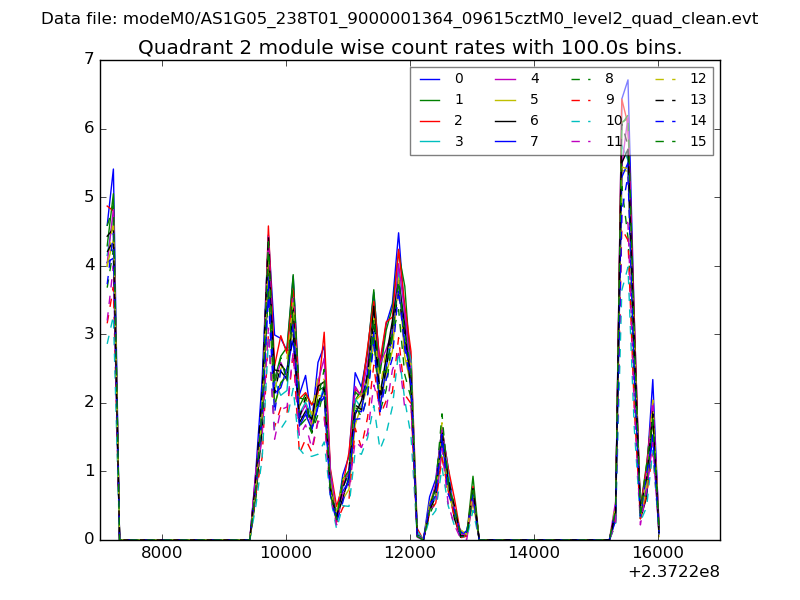
| Module-wise count rates for Quadrant B Data is divided into 100 sec bins |
 |
 |
| Module-wise count rates for Quadrant C Data is divided into 100 sec bins |
 |
 |
| Module-wise count rates for Quadrant D Data is divided into 100 sec bins |
 |
 |
| Parameter | Plot |
|---|---|
| CZT HV Monitor | 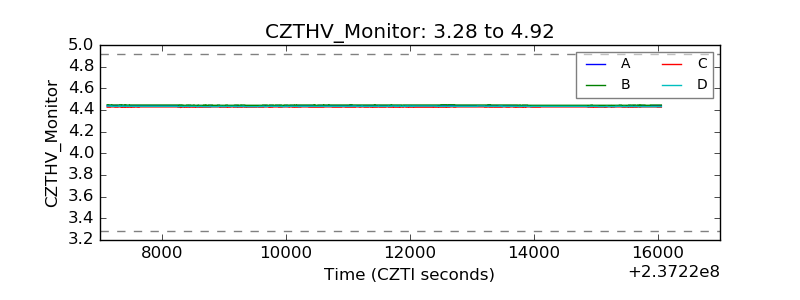 |
| D_VDD | 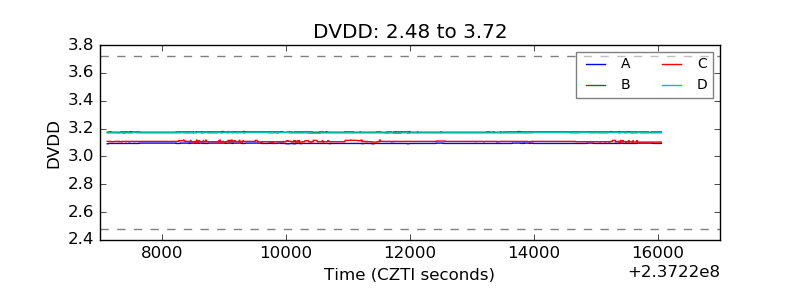 |
| Temperature 1 | 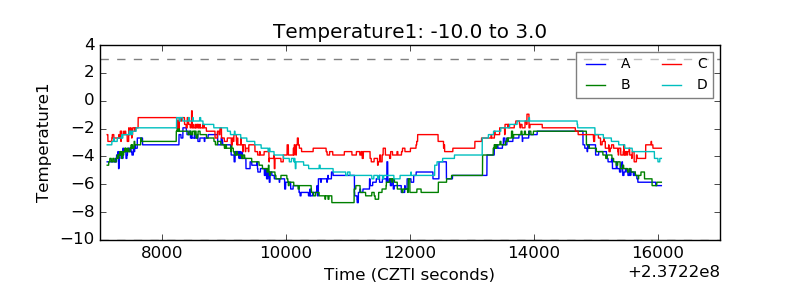 |
| Veto HV Monitor | 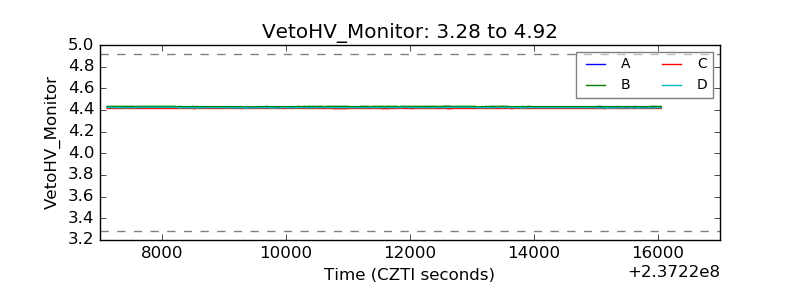 |
| Veto LLD | 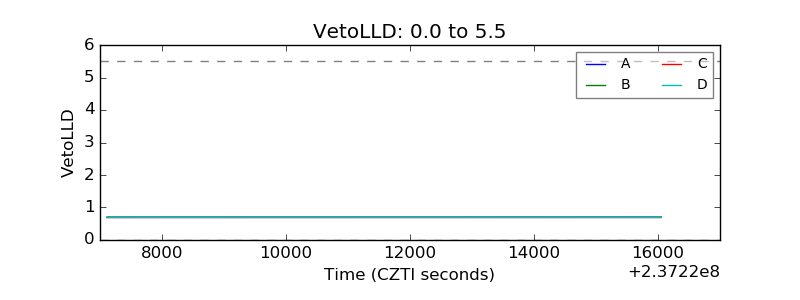 |
| Alpha Counter | 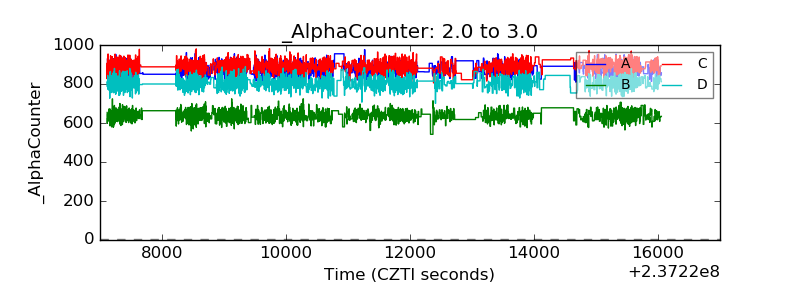 |
| _CPM_Rate | 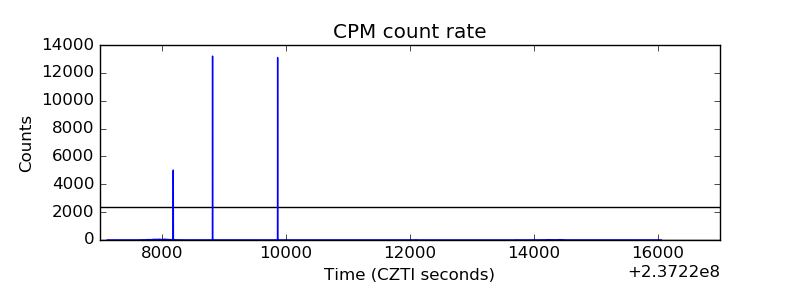 |
| CZT Counter | 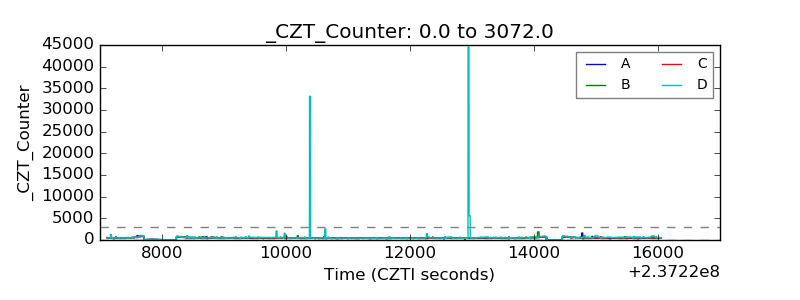 |
| +2.5 Volts monitor |  |
| +5 Volts monitor |  |
| _ROLL_ROT | 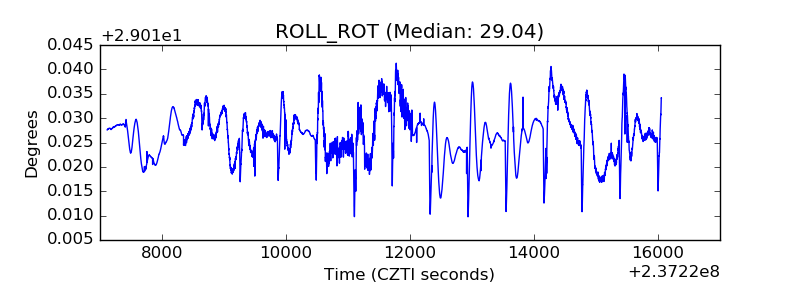 |
| _Roll_DEC | 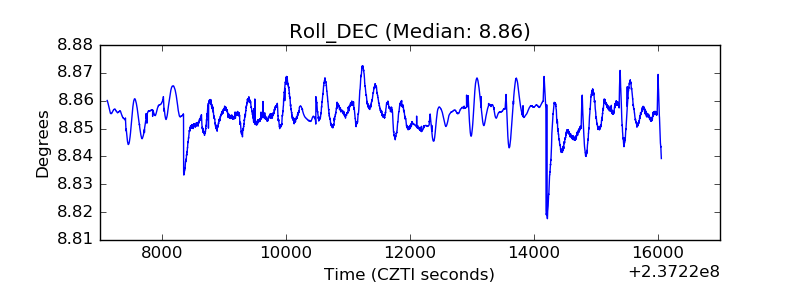 |
| _Roll_RA | 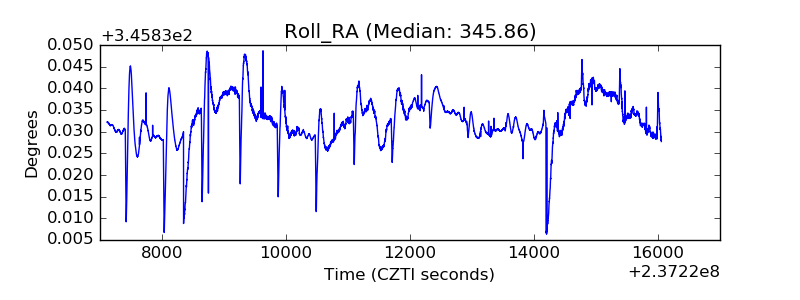 |
| Veto Counter | 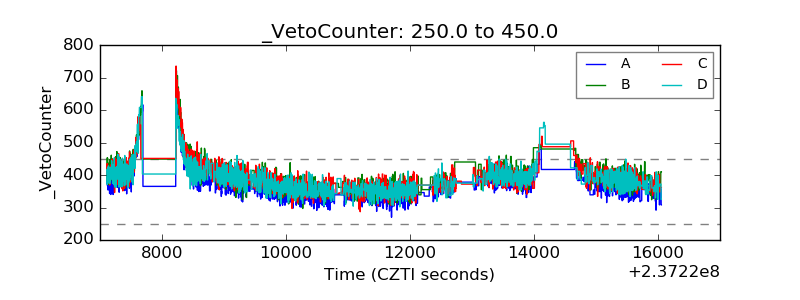 |