| Param | Original file | Final file |
|---|---|---|
| Filename | modeM0/AS1G07_052T01_9000001362cztM0_level2.fits | modeM0/AS1G07_052T01_9000001362cztM0_level2_quad_clean.evt |
| Size (bytes) | 146,381,760 | 149,281,920 |
| Size | 139.6 MB | 142.4 MB |
| Events in quadrant A | 891,700 | 924,404 |
| Events in quadrant B | 866,466 | 930,319 |
| Events in quadrant C | 885,744 | 870,236 |
| Events in quadrant D | 747,660 | 754,476 |
| Mode SS | |||
|---|---|---|---|
| Quadrant | BADHDUFLAG | Total packets | Discarded packets |
| A | 0 | 306 | 0 |
| B | 0 | 306 | 0 |
| C | 0 | 306 | 0 |
| D | 0 | 306 | 0 |
| Mode M9 | |||
|---|---|---|---|
| Quadrant | BADHDUFLAG | Total packets | Discarded packets |
| A | 0 | 28 | 0 |
| B | 0 | 28 | 0 |
| C | 0 | 28 | 0 |
| D | 0 | 28 | 0 |
| Mode M0 | |||
|---|---|---|---|
| Quadrant | BADHDUFLAG | Total packets | Discarded packets |
| A | 0 | 35675 | 0 |
| B | 0 | 31491 | 0 |
| C | 0 | 31149 | 0 |
| D | 0 | 45217 | 0 |
| Quadrant | Total seconds | Saturated seconds | Saturation percentage |
|---|---|---|---|
| A | 15092 | 413 | 2.736549% |
| B | 15099 | 262 | 1.735214% |
| C | 15100 | 188 | 1.245033% |
| D | 15072 | 1513 | 10.038482% |
Noise dominated data is calculated using 1-second bins in cleaned event files. If a bin has >2000 counts, and if more than 50% of those come from <1% of pixels, then it is considered to be noise-dominated and hence unusable.
| Quadrant | # 1 sec bins | Bins with >0 counts | Bins with >2000 counts | High rate bins dominated by noise | Noise dominated (total time) | Noise dominated (detector-on time) | Marked lightcurve |
|---|---|---|---|---|---|---|---|
| A | 17824 | 15107 | 0 | 0 | 0.00% | 0.00% |  |
| B | 17825 | 15111 | 0 | 0 | 0.00% | 0.00% |  |
| C | 17825 | 15109 | 0 | 0 | 0.00% | 0.00% |  |
| D | 17824 | 15106 | 0 | 0 | 0.00% | 0.00% |  |
Top three noisy pixels from each quadrant. If the there are fewer than three noisy pixels in the level2.evt file, extra rows are filled as -1
| Pixel properties | Quadrant properties | ||||||
|---|---|---|---|---|---|---|---|
| Quadrant | DetID | PixID | Counts | Sigma | Mean | Median | Sigma |
| A | 0 | 29 | 817 | 9.76 | 232 | 217 | 61.5 |
| A | 7 | 110 | 742 | 8.54 | 232 | 217 | 61.5 |
| A | 0 | 28 | 636 | 6.81 | 232 | 217 | 61.5 |
| B | 2 | 9 | 751 | 11.0 | 228 | 216 | 48.7 |
| B | 12 | 226 | 593 | 7.75 | 228 | 216 | 48.7 |
| B | 14 | 254 | 588 | 7.65 | 228 | 216 | 48.7 |
| C | 1 | 81 | 647 | 6.83 | 233 | 217 | 62.9 |
| C | 12 | 241 | 614 | 6.31 | 233 | 217 | 62.9 |
| C | 1 | 65 | 609 | 6.23 | 233 | 217 | 62.9 |
| D | 6 | 231 | 539 | 5.95 | 213 | 194 | 58.0 |
| D | 7 | 3 | 538 | 5.93 | 213 | 194 | 58.0 |
| D | 7 | 5 | 520 | 5.62 | 213 | 194 | 58.0 |
Histogram calculated using DETX and DETY for each event in the final _common_clean file
| Quadrant A | 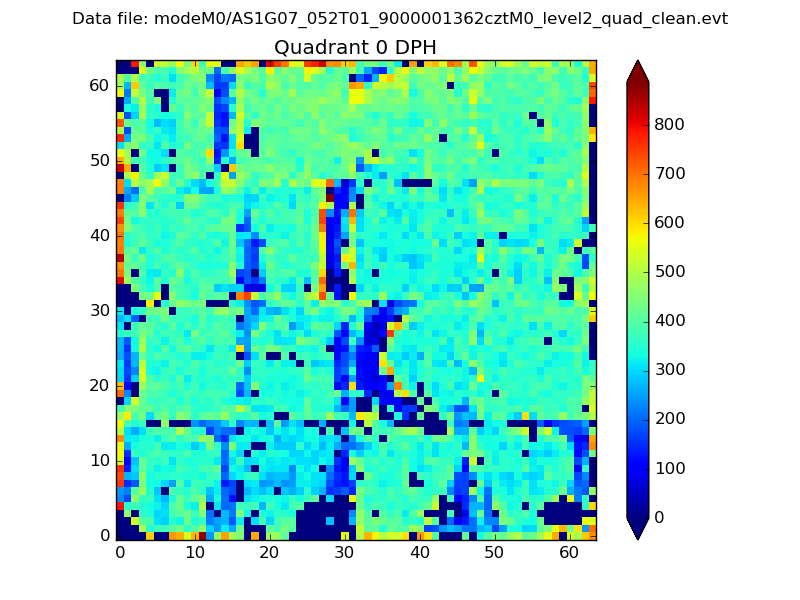 |
 |
Quadrant B |
|---|---|---|---|
| Quadrant D | 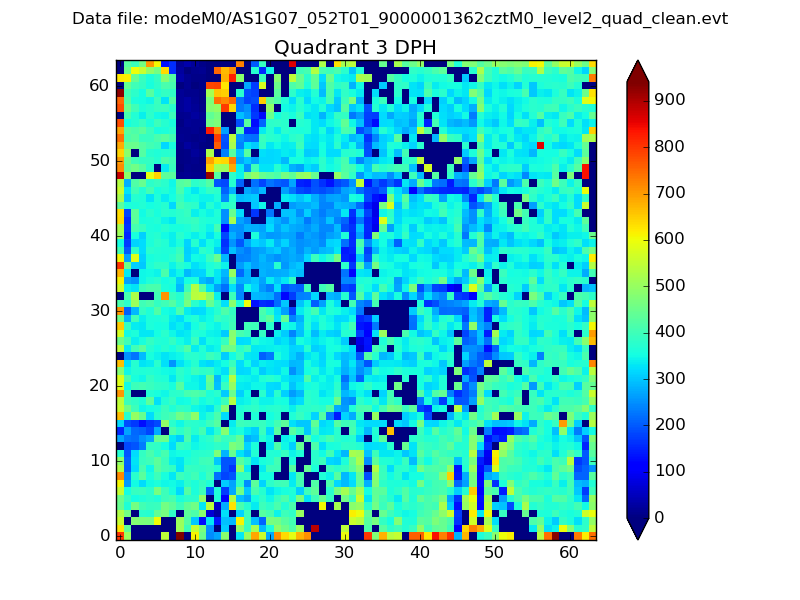 |
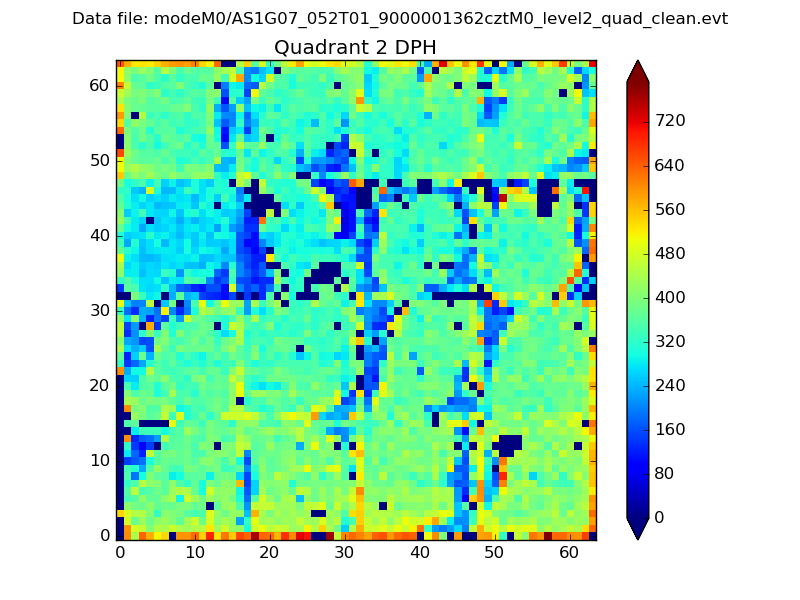 |
Quadrant C |
| Plot type | Count rate plots | Images |
|---|---|---|
| Comparison with Poisson distribution Blue bars denote a histogram of data divided into 1 sec bins. Red curve is a Poisson curve with rate = median count rate of data. |
 |
 |
| Quadrant-wise count rates Data is divided into 100 sec bins |
 |
|
| Module-wise count rates for Quadrant A Data is divided into 100 sec bins |
 |
 |
| Module-wise count rates for Quadrant B Data is divided into 100 sec bins |
 |
 |
| Module-wise count rates for Quadrant C Data is divided into 100 sec bins |
 |
 |
| Module-wise count rates for Quadrant D Data is divided into 100 sec bins |
 |
 |
| Parameter | Plot |
|---|---|
| CZT HV Monitor |  |
| D_VDD | 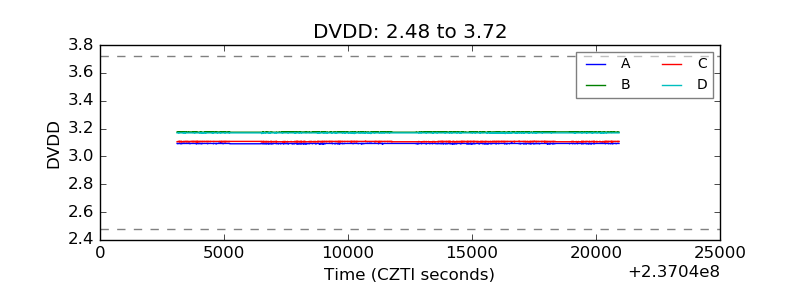 |
| Temperature 1 |  |
| Veto HV Monitor |  |
| Veto LLD |  |
| Alpha Counter |  |
| _CPM_Rate |  |
| CZT Counter |  |
| +2.5 Volts monitor |  |
| +5 Volts monitor |  |
| _ROLL_ROT |  |
| _Roll_DEC |  |
| _Roll_RA |  |
| Veto Counter |  |