| Param | Original file | Final file |
|---|---|---|
| Filename | modeM0/AS1G07_052T01_9000001362_09583cztM0_level2.evt | modeM0/AS1G07_052T01_9000001362_09583cztM0_level2_quad_clean.evt |
| Size (bytes) | 262,175,040 | 50,077,440 |
| Size | 250.0 MB | 47.8 MB |
| Events in quadrant A | 2,096,245 | 320,336 |
| Events in quadrant B | 1,796,513 | 327,720 |
| Events in quadrant C | 1,734,429 | 319,564 |
| Events in quadrant D | 2,076,970 | 304,114 |
| Mode SS | |||
|---|---|---|---|
| Quadrant | BADHDUFLAG | Total packets | Discarded packets |
| A | 0 | 72 | 0 |
| B | 0 | 72 | 0 |
| C | 0 | 72 | 0 |
| D | 0 | 72 | 0 |
| Mode M9 | |||
|---|---|---|---|
| Quadrant | BADHDUFLAG | Total packets | Discarded packets |
| A | 0 | 12 | 0 |
| B | 0 | 12 | 0 |
| C | 0 | 12 | 0 |
| D | 0 | 12 | 0 |
| Mode M0 | |||
|---|---|---|---|
| Quadrant | BADHDUFLAG | Total packets | Discarded packets |
| A | 0 | 8458 | 6 |
| B | 0 | 7424 | 1 |
| C | 0 | 7312 | 3 |
| D | 0 | 8373 | 9 |
| Quadrant | Total seconds | Saturated seconds | Saturation percentage |
|---|---|---|---|
| A | 3444 | 142 | 4.123113% |
| B | 3446 | 95 | 2.756820% |
| C | 3445 | 64 | 1.857765% |
| D | 3442 | 145 | 4.212667% |
Noise dominated data is calculated using 1-second bins in cleaned event files. If a bin has >2000 counts, and if more than 50% of those come from <1% of pixels, then it is considered to be noise-dominated and hence unusable.
| Quadrant | # 1 sec bins | Bins with >0 counts | Bins with >2000 counts | High rate bins dominated by noise | Noise dominated (total time) | Noise dominated (detector-on time) | Marked lightcurve |
|---|---|---|---|---|---|---|---|
| A | 4696 | 3446 | 1 | 1 | 0.02% | 0.03% | 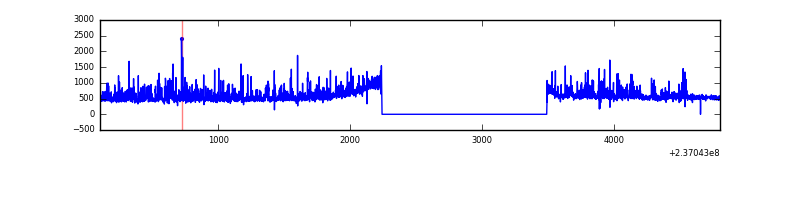 |
| B | 4696 | 3447 | 4 | 4 | 0.09% | 0.12% | 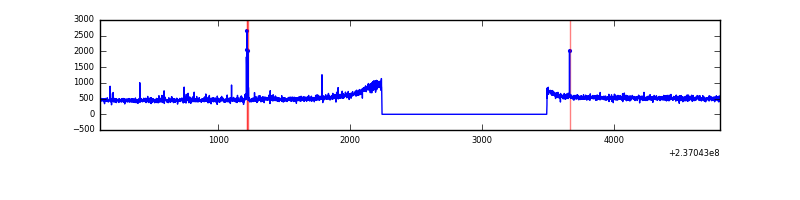 |
| C | 4696 | 3447 | 0 | 0 | 0.00% | 0.00% | 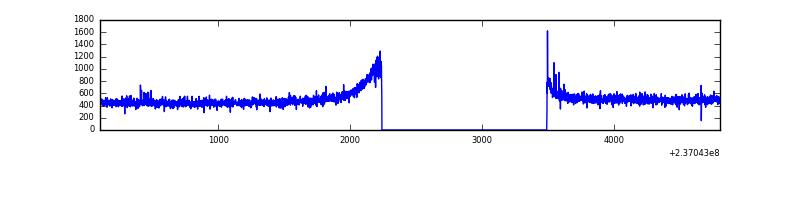 |
| D | 4696 | 3447 | 56 | 56 | 1.19% | 1.62% | 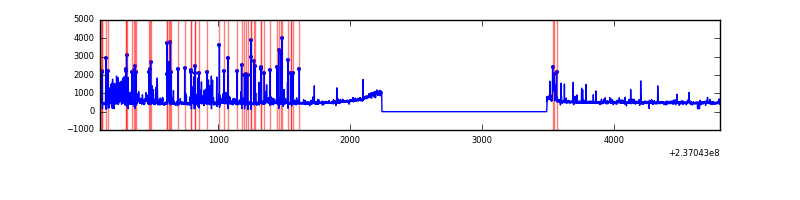 |
Top three noisy pixels from each quadrant. If the there are fewer than three noisy pixels in the level2.evt file, extra rows are filled as -1
| Pixel properties | Quadrant properties | ||||||
|---|---|---|---|---|---|---|---|
| Quadrant | DetID | PixID | Counts | Sigma | Mean | Median | Sigma |
| A | 1 | 162 | 130806 | 1415.22 | 452 | 444 | 92.1 |
| A | 1 | 178 | 74030 | 798.85 | 452 | 444 | 92.1 |
| A | 1 | 161 | 68696 | 740.95 | 452 | 444 | 92.1 |
| B | 10 | 245 | 29318 | 324.15 | 453 | 444 | 89.1 |
| B | 12 | 111 | 10168 | 109.17 | 453 | 444 | 89.1 |
| B | 11 | 111 | 8215 | 87.24 | 453 | 444 | 89.1 |
| C | 9 | 68 | 4448 | 38.27 | 442 | 446 | 104.6 |
| C | 12 | 4 | 4396 | 37.77 | 442 | 446 | 104.6 |
| C | 13 | 61 | 3137 | 25.73 | 442 | 446 | 104.6 |
| D | 1 | 52 | 366936 | 3243.68 | 434 | 424 | 113.0 |
| D | 13 | 104 | 38466 | 336.68 | 434 | 424 | 113.0 |
| D | 2 | 234 | 19837 | 171.81 | 434 | 424 | 113.0 |
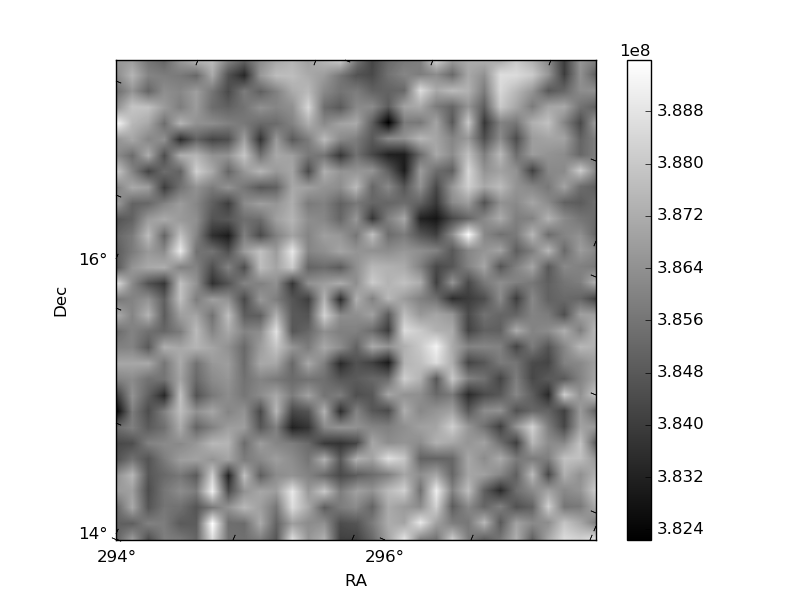
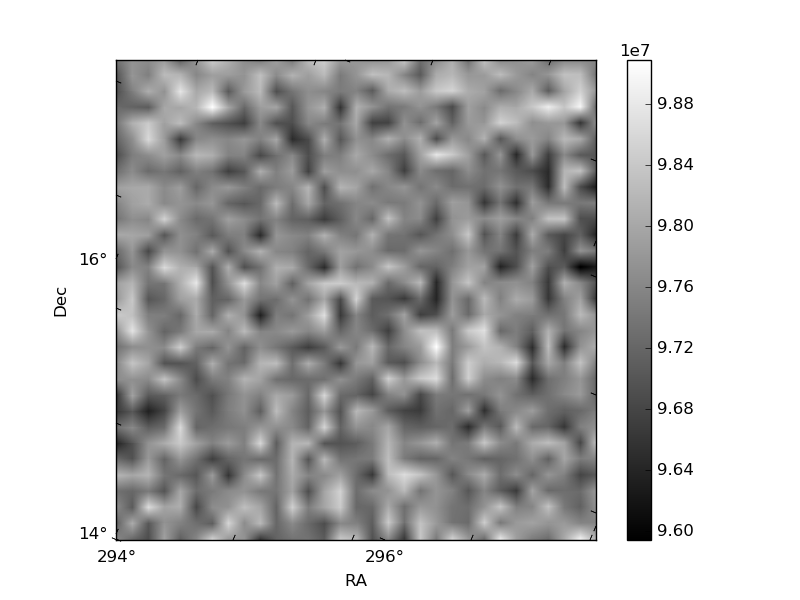
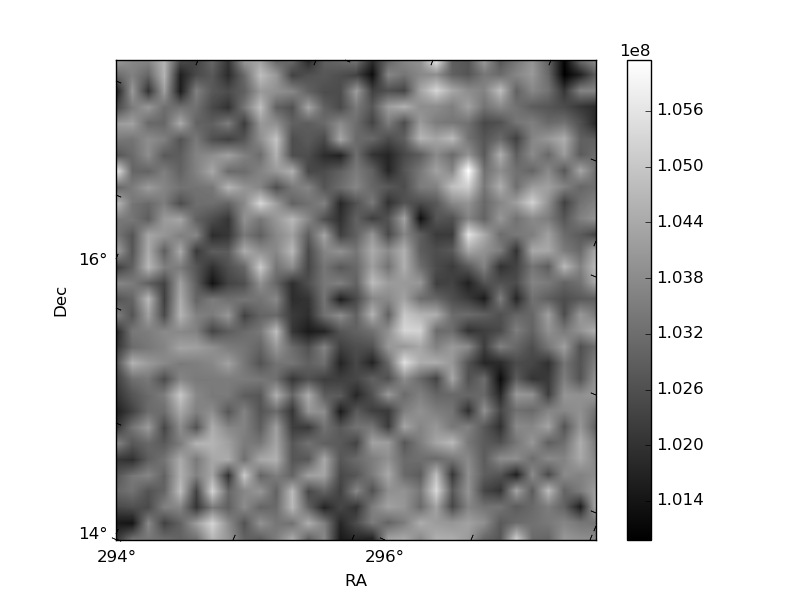
Histogram calculated using DETX and DETY for each event in the final _common_clean file
| Quadrant A | 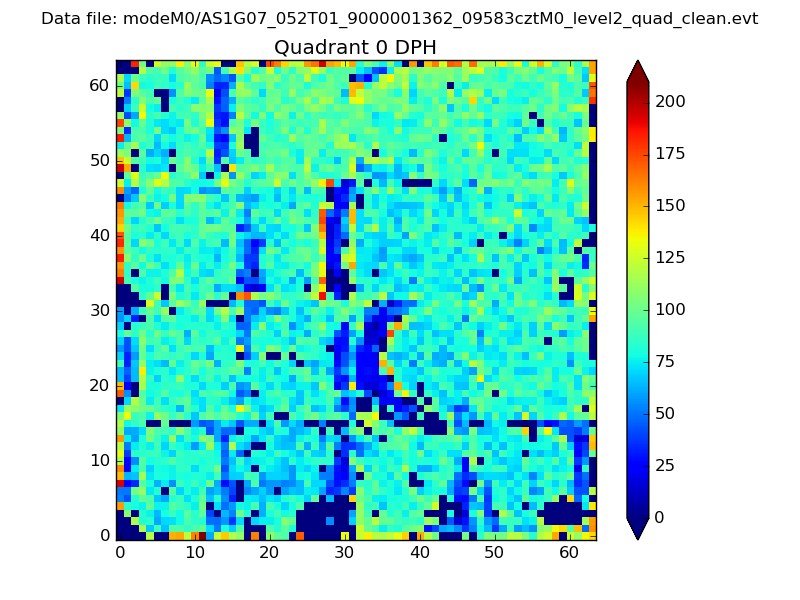 |
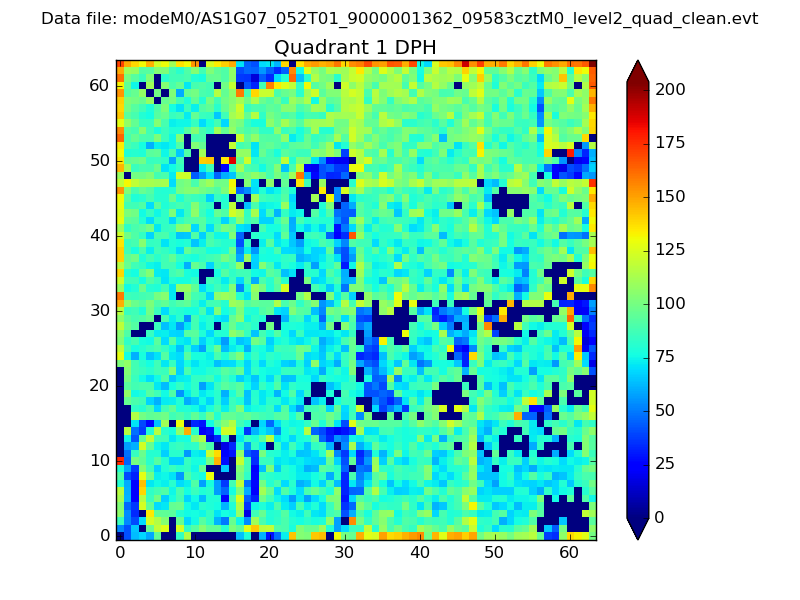 |
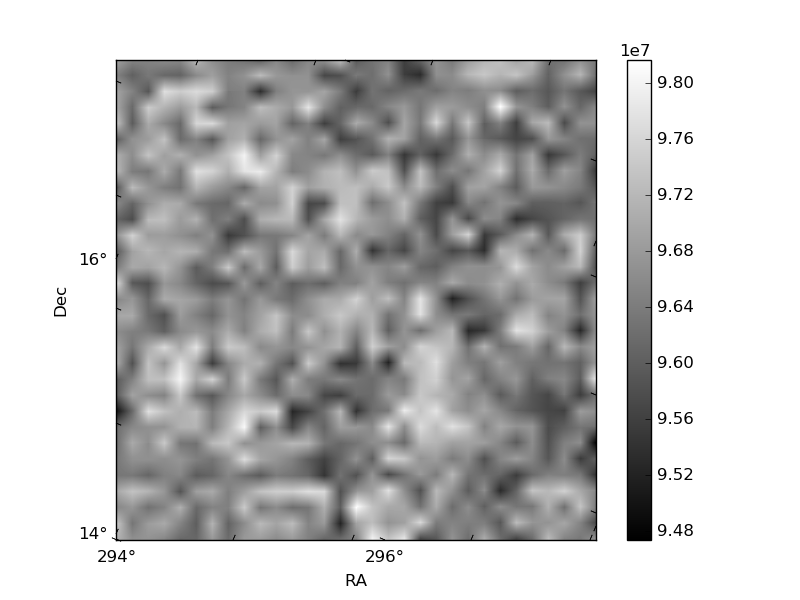
Quadrant B |
|---|---|---|---|
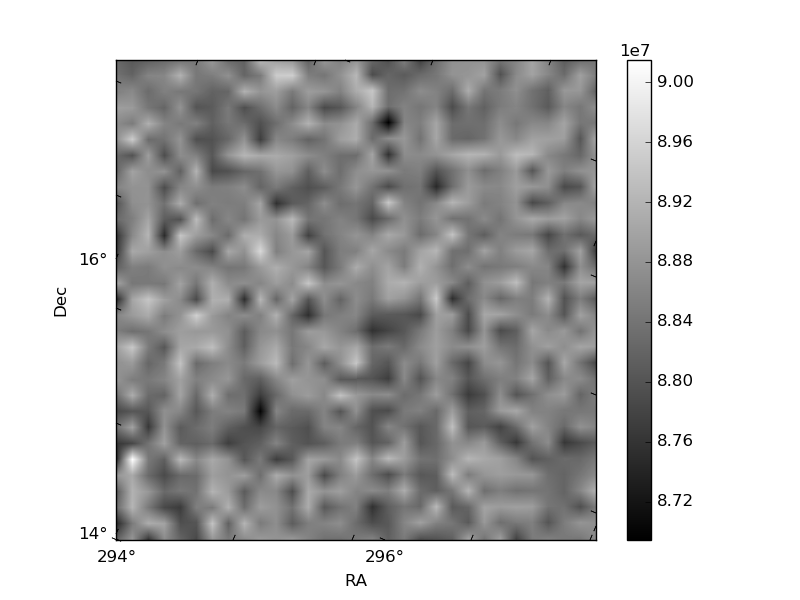
| Quadrant D | 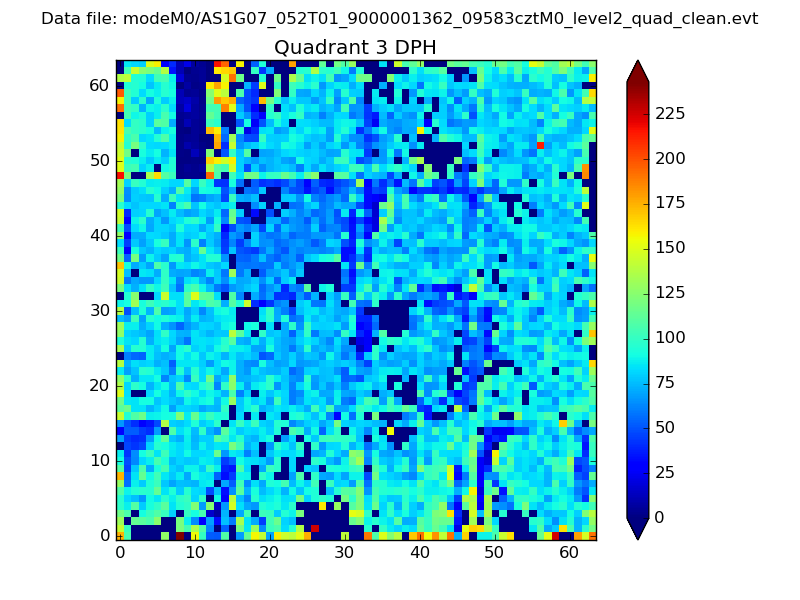 |
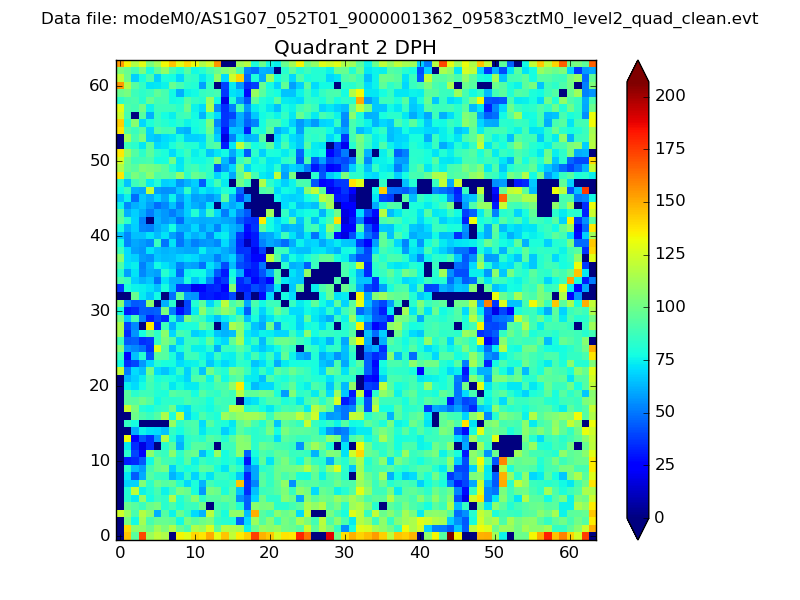 |
Quadrant C |
| Plot type | Count rate plots | Images |
|---|---|---|
| Comparison with Poisson distribution Blue bars denote a histogram of data divided into 1 sec bins. Red curve is a Poisson curve with rate = median count rate of data. |
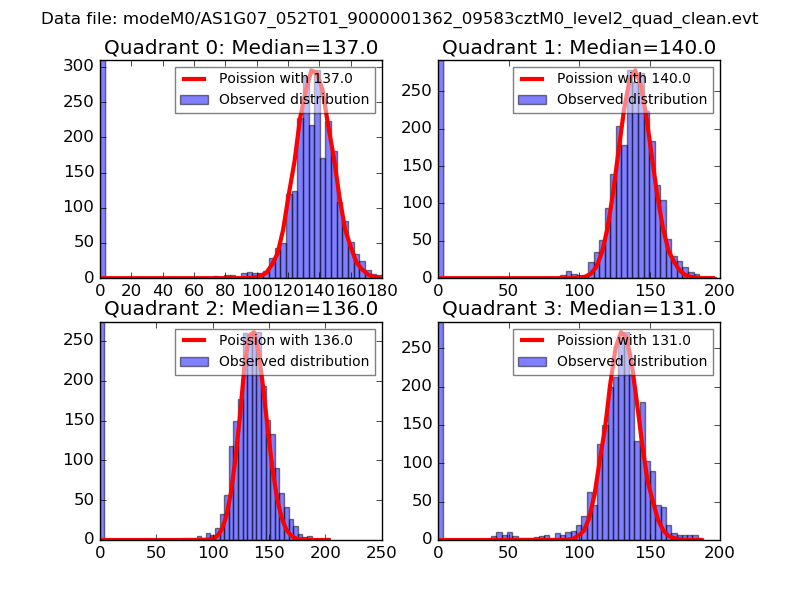 |
 |
| Quadrant-wise count rates Data is divided into 100 sec bins |
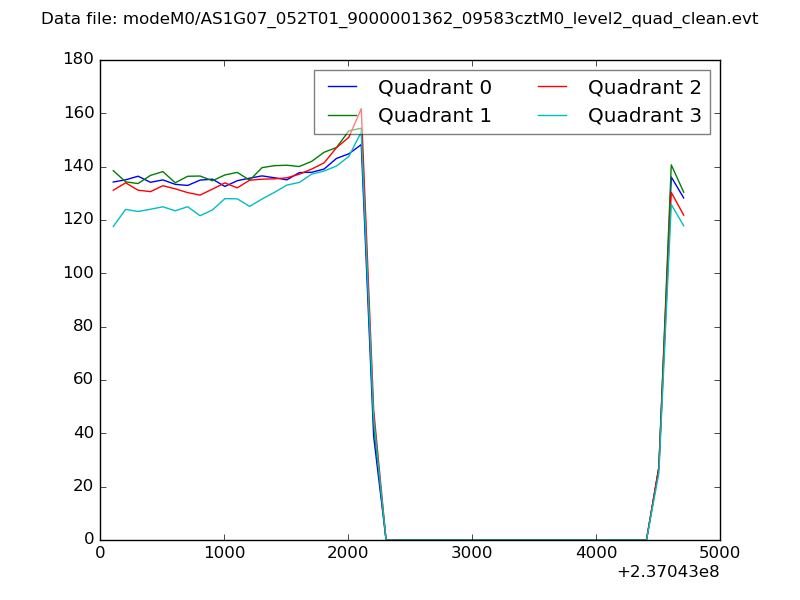 |
|
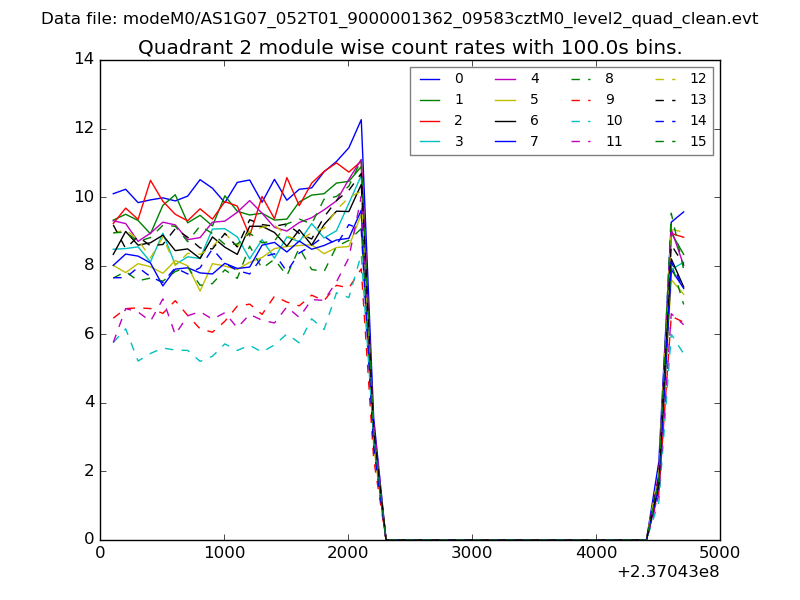
| Module-wise count rates for Quadrant A Data is divided into 100 sec bins |
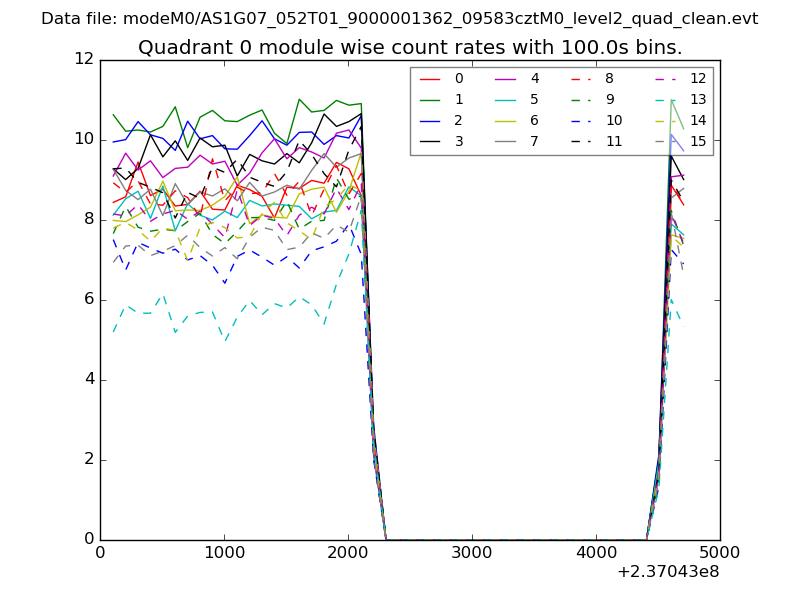 |
 |
| Module-wise count rates for Quadrant B Data is divided into 100 sec bins |
 |
 |
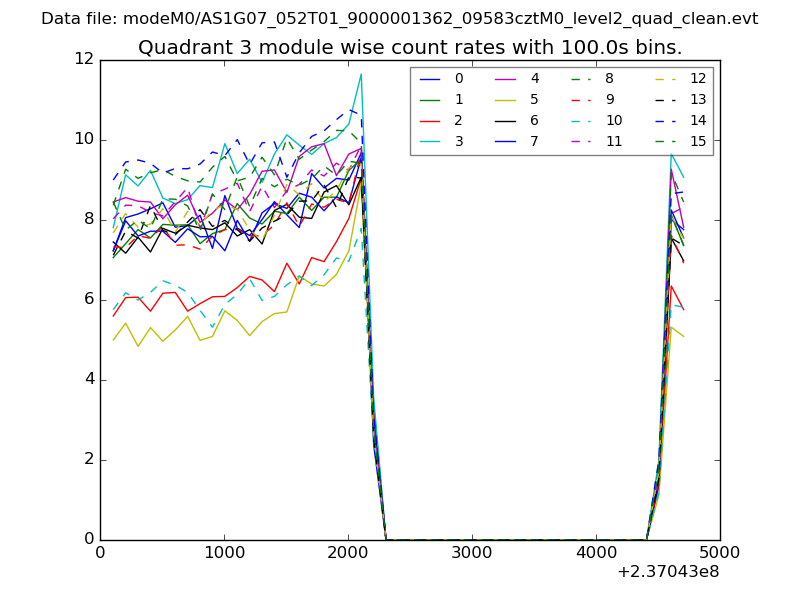
| Module-wise count rates for Quadrant C Data is divided into 100 sec bins |
 |
 |
| Module-wise count rates for Quadrant D Data is divided into 100 sec bins |
 |
 |
| Parameter | Plot |
|---|---|
| CZT HV Monitor | 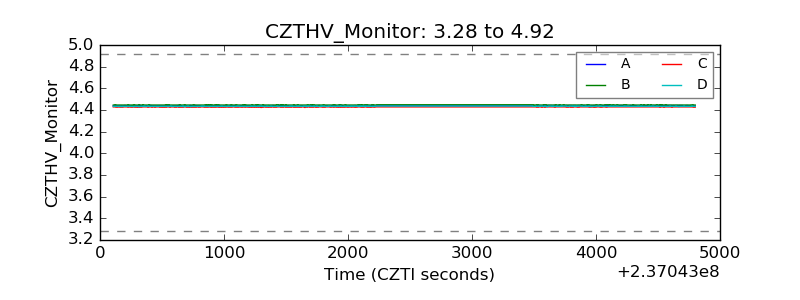 |
| D_VDD |  |
| Temperature 1 | 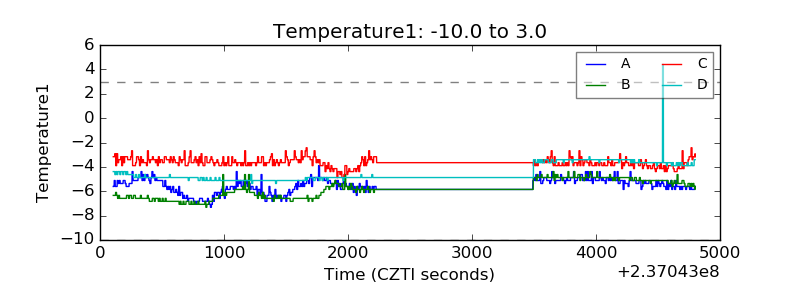 |
| Veto HV Monitor | 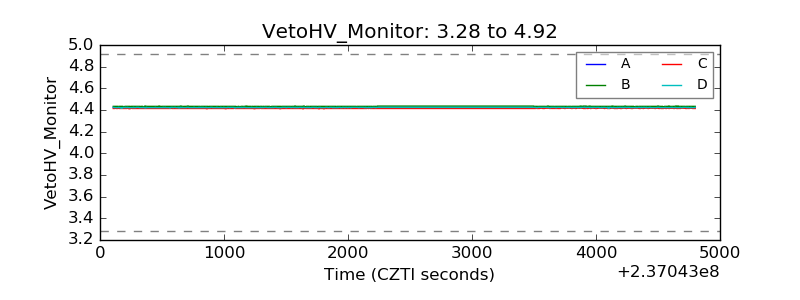 |
| Veto LLD | 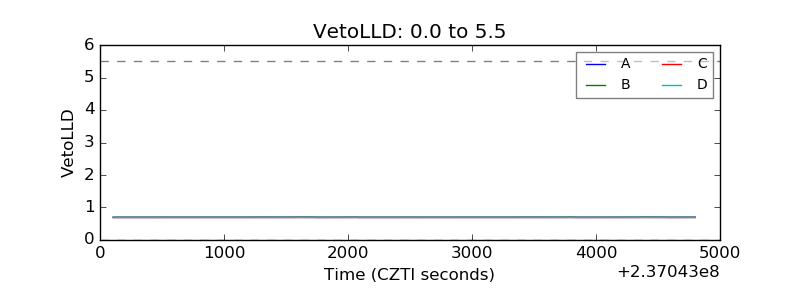 |
| Alpha Counter | 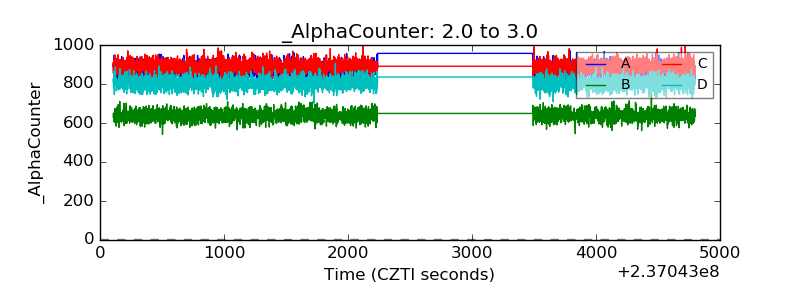 |
| _CPM_Rate | 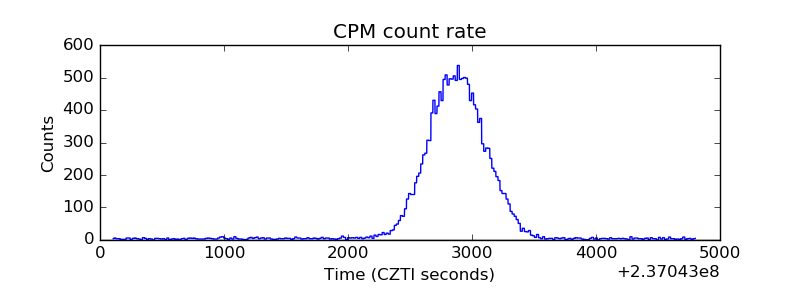 |
| CZT Counter | 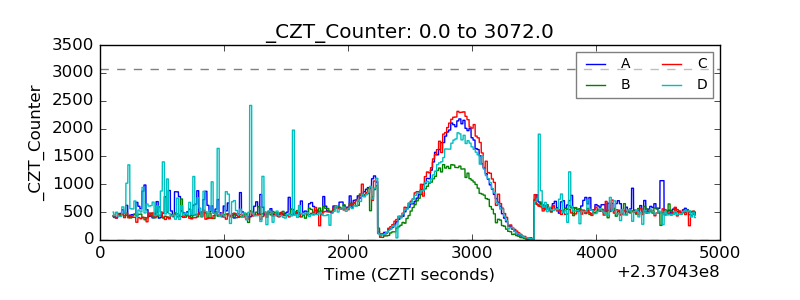 |
| +2.5 Volts monitor |  |
| +5 Volts monitor |  |
| _ROLL_ROT | 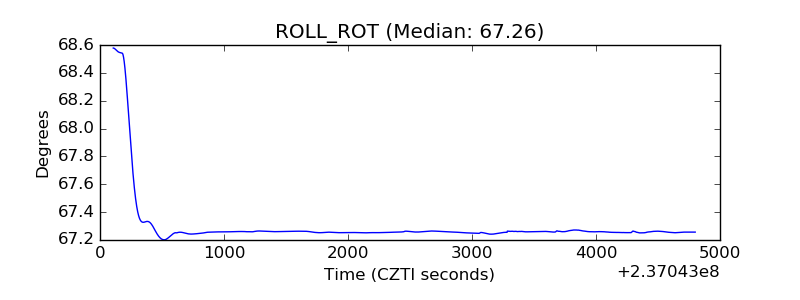 |
| _Roll_DEC | 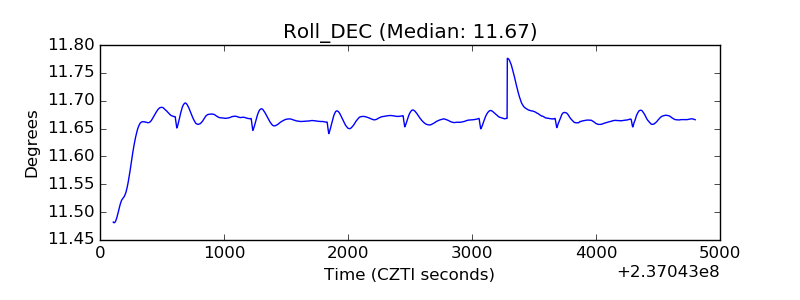 |
| _Roll_RA | 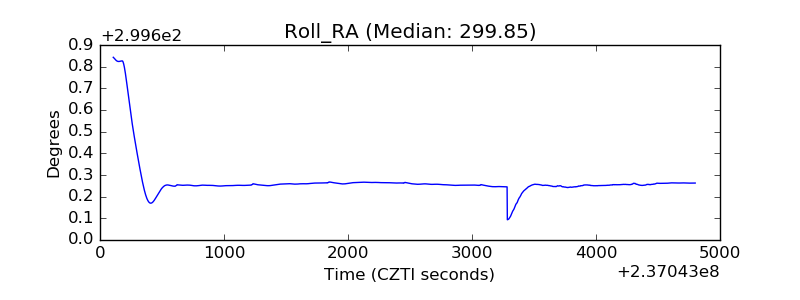 |
| Veto Counter | 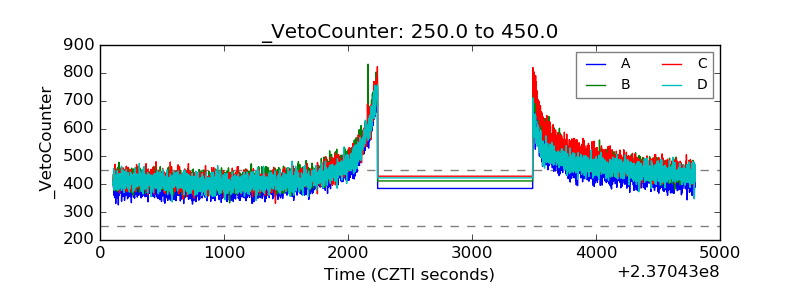 |