| Param | Original file | Final file |
|---|---|---|
| Filename | modeM0/AS1G07_052T01_9000001362_09585cztM0_level2.evt | modeM0/AS1G07_052T01_9000001362_09585cztM0_level2_quad_clean.evt |
| Size (bytes) | 642,942,720 | 93,971,520 |
| Size | 613.2 MB | 89.6 MB |
| Events in quadrant A | 4,494,241 | 588,149 |
| Events in quadrant B | 3,810,505 | 596,792 |
| Events in quadrant C | 3,676,634 | 579,072 |
| Events in quadrant D | 6,963,709 | 541,498 |
| Mode SS | |||
|---|---|---|---|
| Quadrant | BADHDUFLAG | Total packets | Discarded packets |
| A | 0 | 156 | 0 |
| B | 0 | 156 | 0 |
| C | 0 | 156 | 0 |
| D | 0 | 156 | 0 |
| Mode M9 | |||
|---|---|---|---|
| Quadrant | BADHDUFLAG | Total packets | Discarded packets |
| A | 0 | 16 | 0 |
| B | 0 | 16 | 0 |
| C | 0 | 16 | 0 |
| D | 0 | 16 | 0 |
| Mode M0 | |||
|---|---|---|---|
| Quadrant | BADHDUFLAG | Total packets | Discarded packets |
| A | 0 | 18588 | 3 |
| B | 0 | 16274 | 2 |
| C | 0 | 16071 | 2 |
| D | 0 | 26055 | 2 |
| Quadrant | Total seconds | Saturated seconds | Saturation percentage |
|---|---|---|---|
| A | 7775 | 236 | 3.035370% |
| B | 7775 | 166 | 2.135048% |
| C | 7775 | 124 | 1.594855% |
| D | 7775 | 1273 | 16.372990% |
Noise dominated data is calculated using 1-second bins in cleaned event files. If a bin has >2000 counts, and if more than 50% of those come from <1% of pixels, then it is considered to be noise-dominated and hence unusable.
| Quadrant | # 1 sec bins | Bins with >0 counts | Bins with >2000 counts | High rate bins dominated by noise | Noise dominated (total time) | Noise dominated (detector-on time) | Marked lightcurve |
|---|---|---|---|---|---|---|---|
| A | 9240 | 7777 | 1 | 1 | 0.01% | 0.01% | 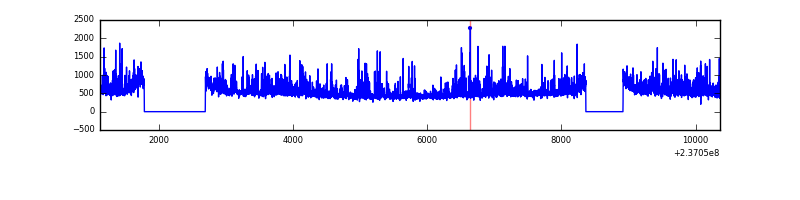 |
| B | 9240 | 7777 | 0 | 0 | 0.00% | 0.00% | 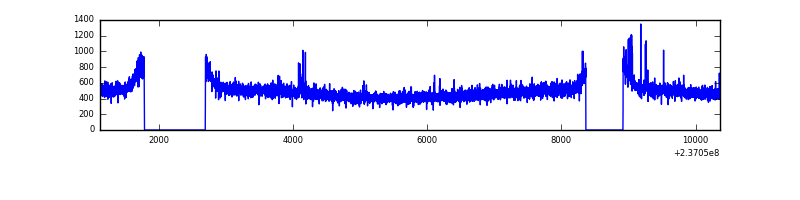 |
| C | 9240 | 7777 | 0 | 0 | 0.00% | 0.00% | 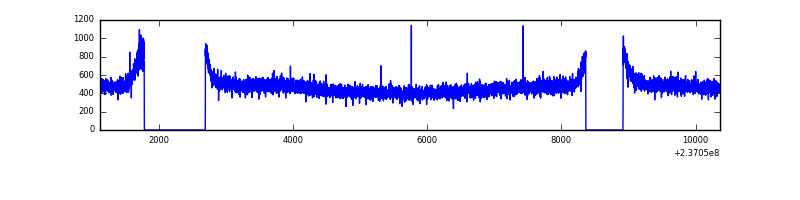 |
| D | 9240 | 7777 | 803 | 803 | 8.69% | 10.33% | 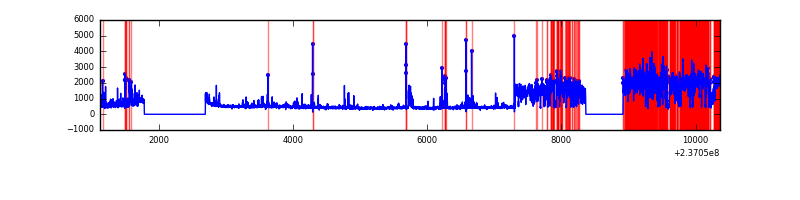 |
Top three noisy pixels from each quadrant. If the there are fewer than three noisy pixels in the level2.evt file, extra rows are filled as -1
| Pixel properties | Quadrant properties | ||||||
|---|---|---|---|---|---|---|---|
| Quadrant | DetID | PixID | Counts | Sigma | Mean | Median | Sigma |
| A | 1 | 162 | 318081 | 1604.73 | 965 | 943 | 197.6 |
| A | 1 | 178 | 166123 | 835.82 | 965 | 943 | 197.6 |
| A | 1 | 161 | 155685 | 783.0 | 965 | 943 | 197.6 |
| B | 12 | 111 | 22338 | 114.95 | 967 | 943 | 186.1 |
| B | 11 | 111 | 18234 | 92.9 | 967 | 943 | 186.1 |
| B | 0 | 189 | 17610 | 89.55 | 967 | 943 | 186.1 |
| C | 13 | 61 | 6853 | 26.92 | 941 | 946 | 219.4 |
| C | 8 | 222 | 2909 | 8.95 | 941 | 946 | 219.4 |
| C | 9 | 68 | 2823 | 8.55 | 941 | 946 | 219.4 |
| D | 1 | 52 | 3445719 | 14917.69 | 897 | 880 | 230.9 |
| D | 8 | 195 | 34777 | 146.79 | 897 | 880 | 230.9 |
| D | 2 | 234 | 27534 | 115.42 | 897 | 880 | 230.9 |
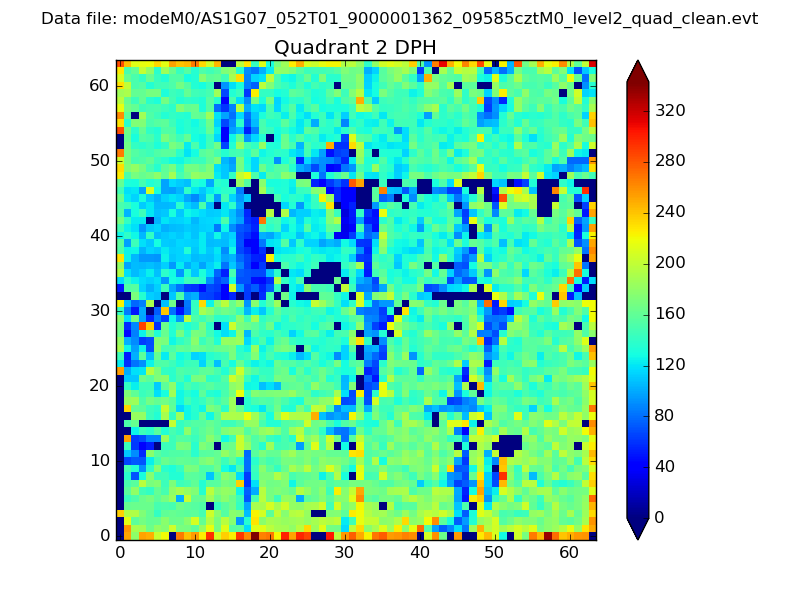
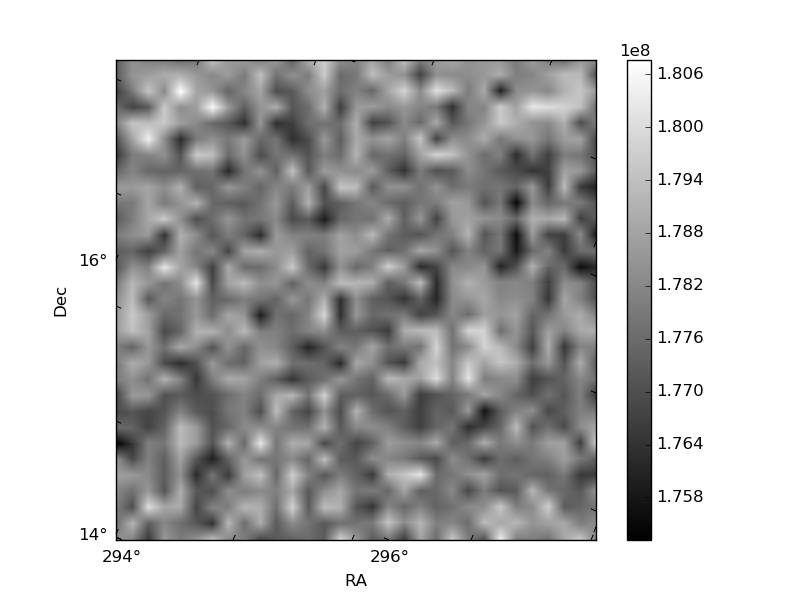
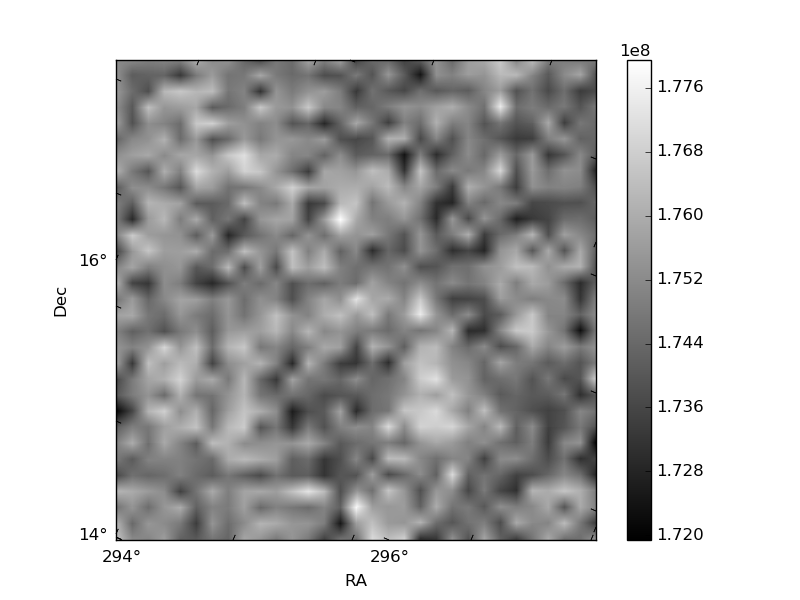
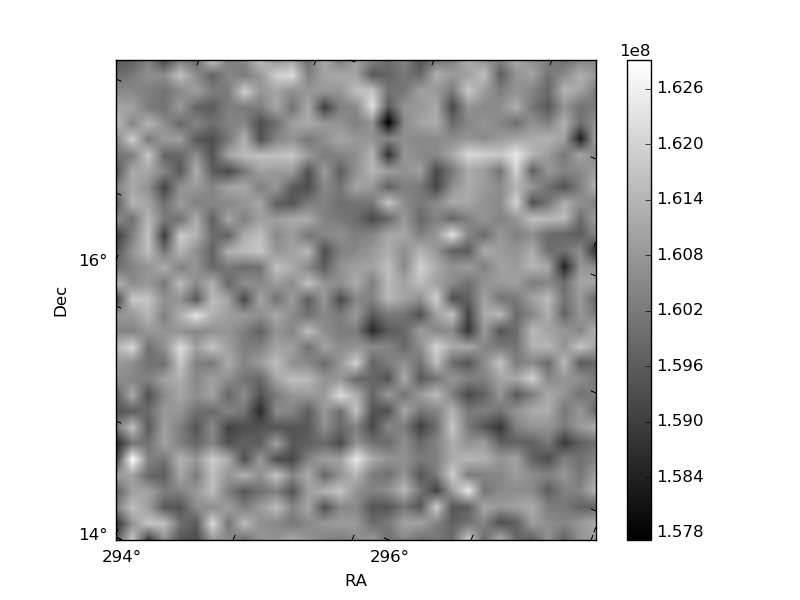
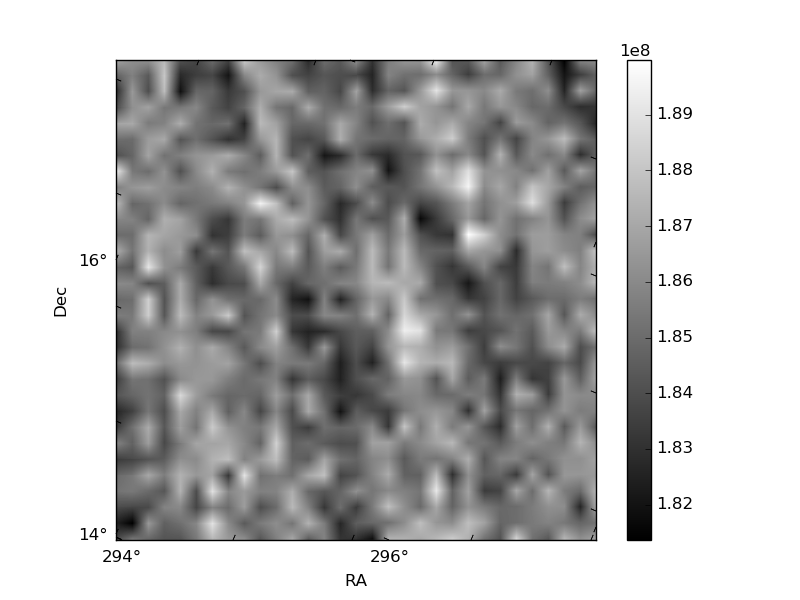
Histogram calculated using DETX and DETY for each event in the final _common_clean file
| Quadrant A | 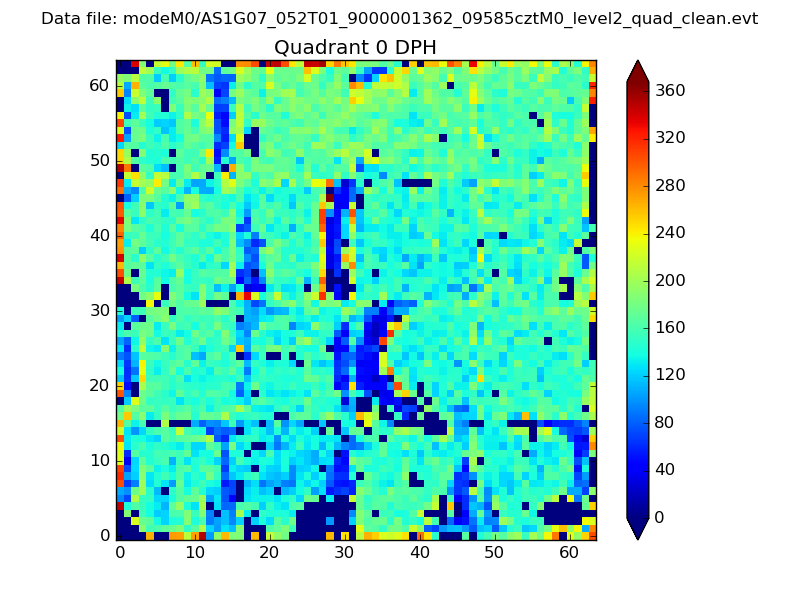 |
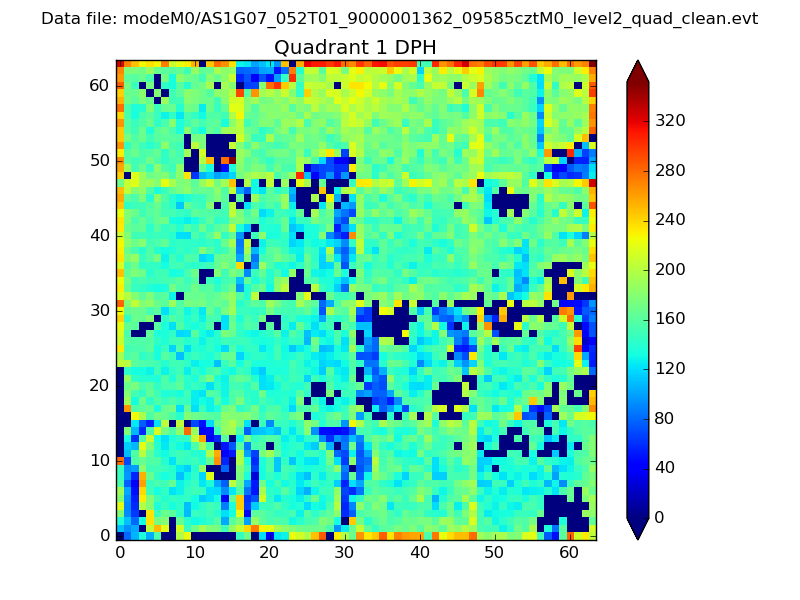 |
Quadrant B |
|---|---|---|---|
| Quadrant D | 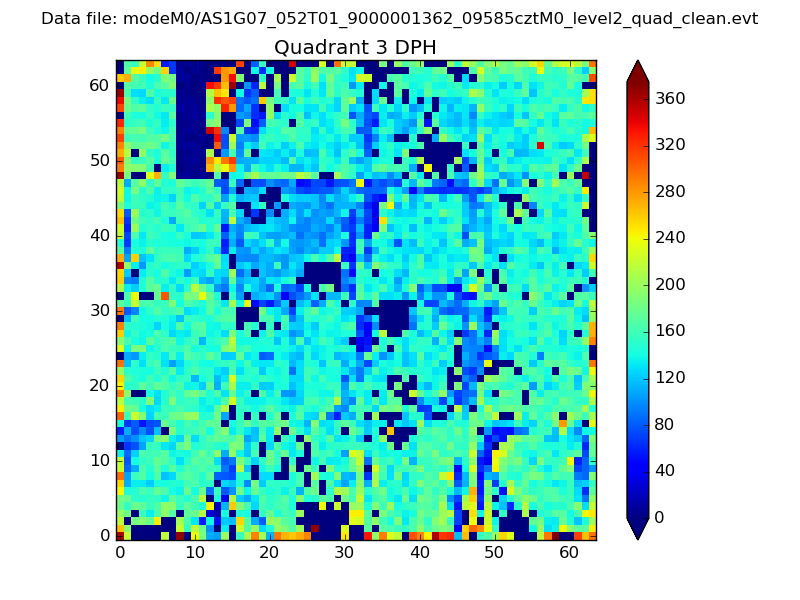 |
 |
Quadrant C |
| Plot type | Count rate plots | Images |
|---|---|---|
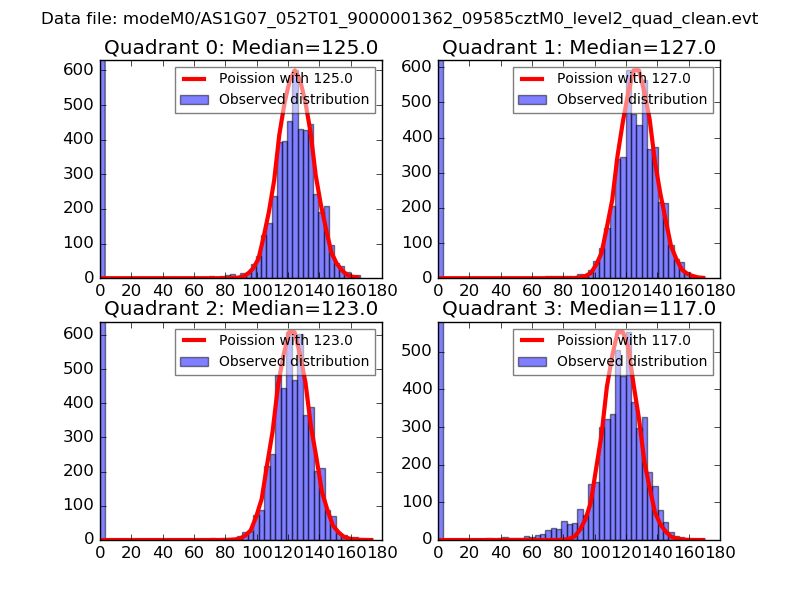
| Comparison with Poisson distribution Blue bars denote a histogram of data divided into 1 sec bins. Red curve is a Poisson curve with rate = median count rate of data. |
 |
 |
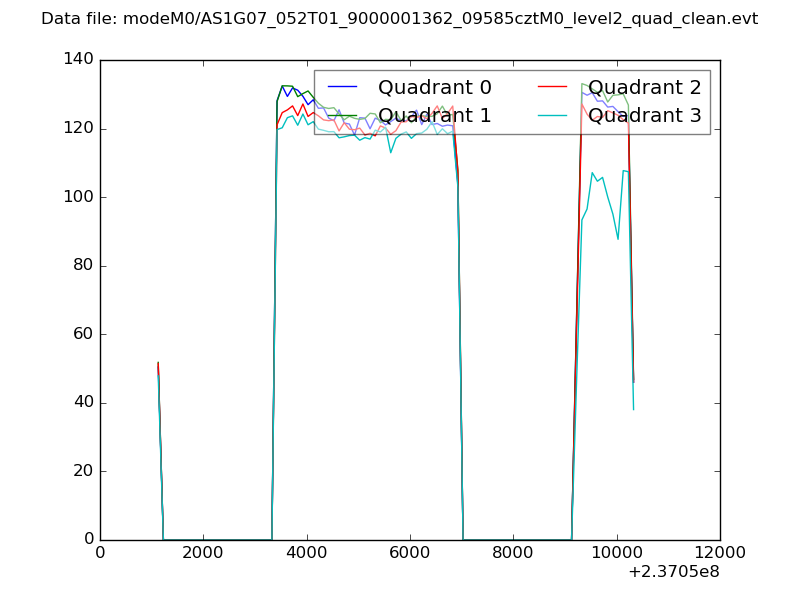
| Quadrant-wise count rates Data is divided into 100 sec bins |
 |
|
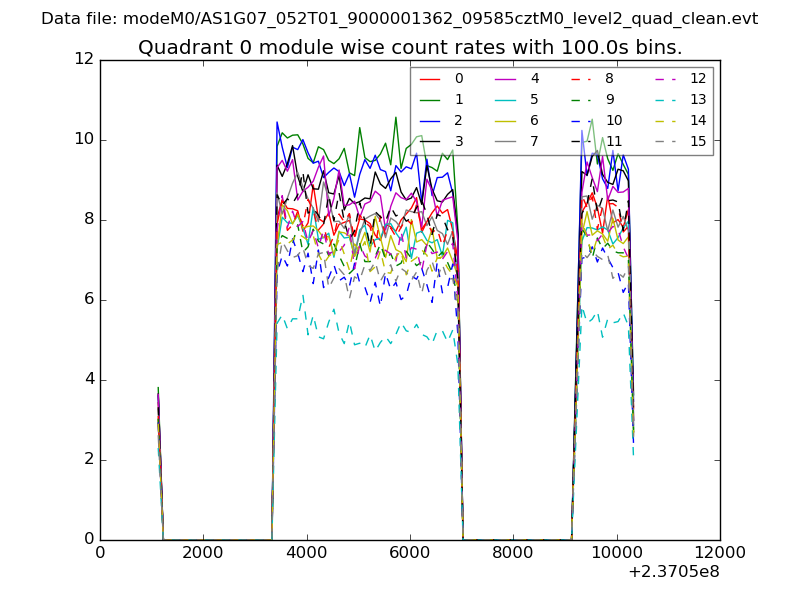
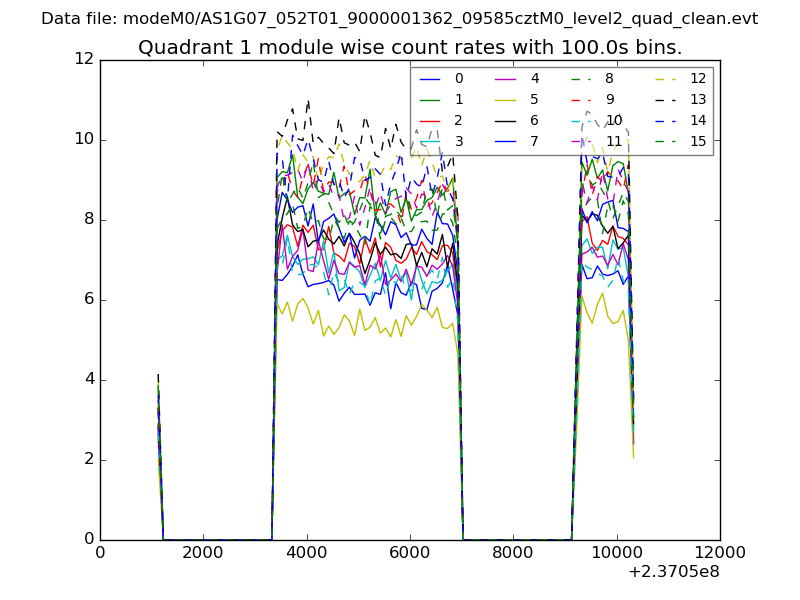
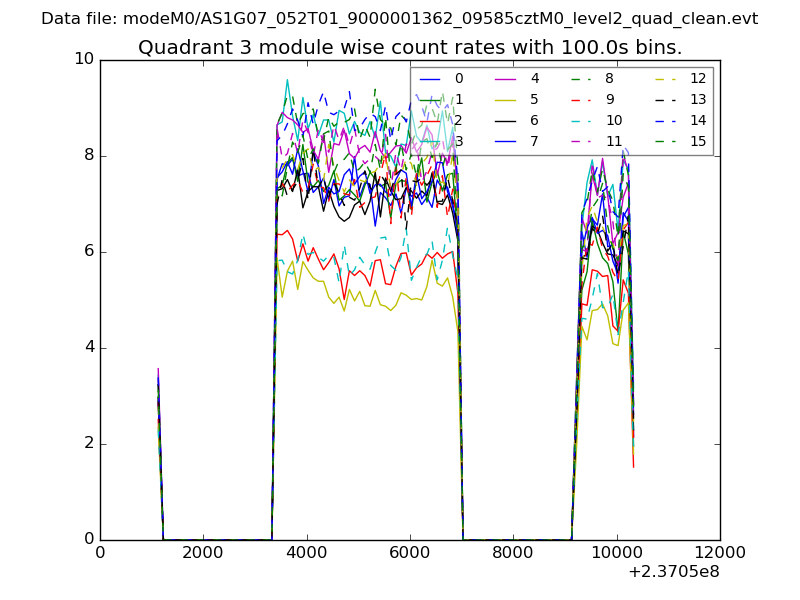
| Module-wise count rates for Quadrant A Data is divided into 100 sec bins |
 |
 |
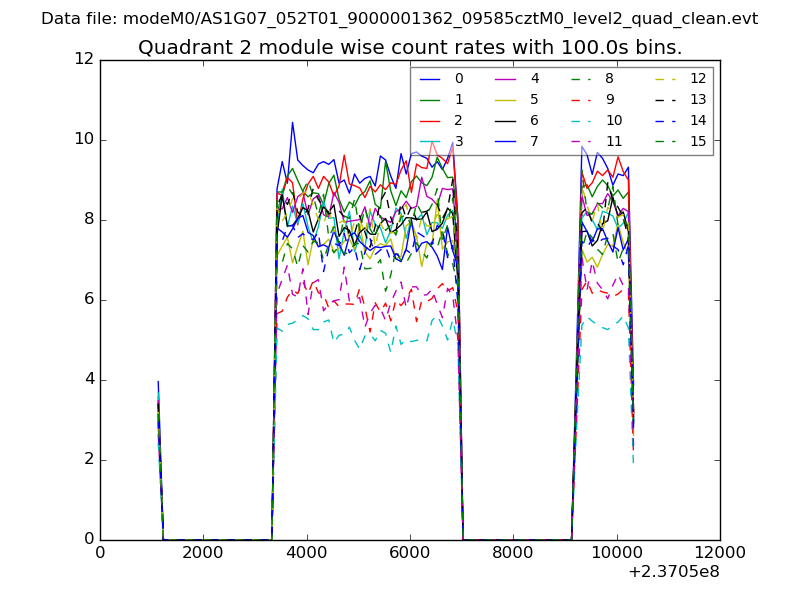
| Module-wise count rates for Quadrant B Data is divided into 100 sec bins |
 |
 |
| Module-wise count rates for Quadrant C Data is divided into 100 sec bins |
 |
 |
| Module-wise count rates for Quadrant D Data is divided into 100 sec bins |
 |
 |
| Parameter | Plot |
|---|---|
| CZT HV Monitor | 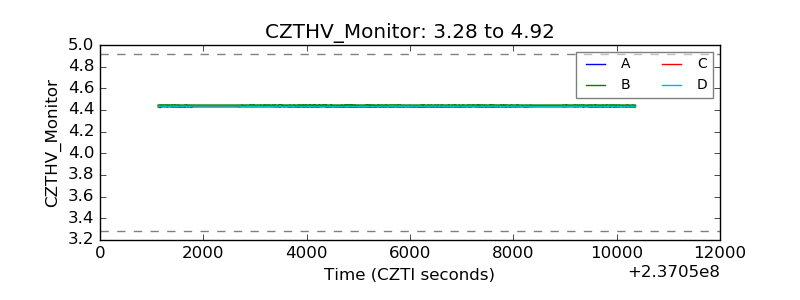 |
| D_VDD | 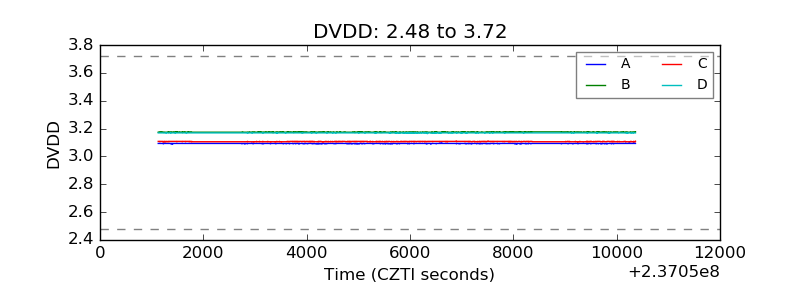 |
| Temperature 1 |  |
| Veto HV Monitor | 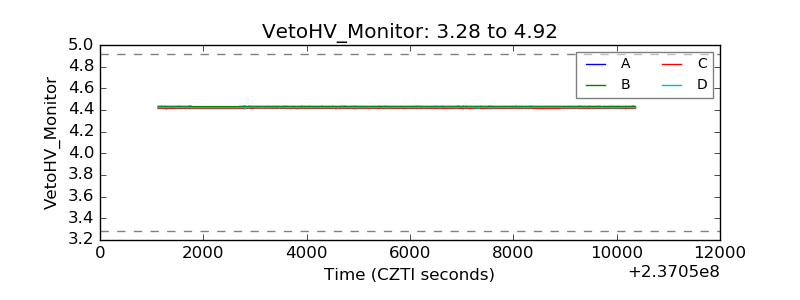 |
| Veto LLD | 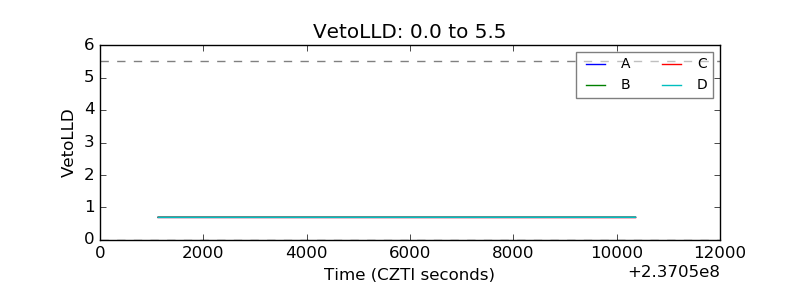 |
| Alpha Counter | 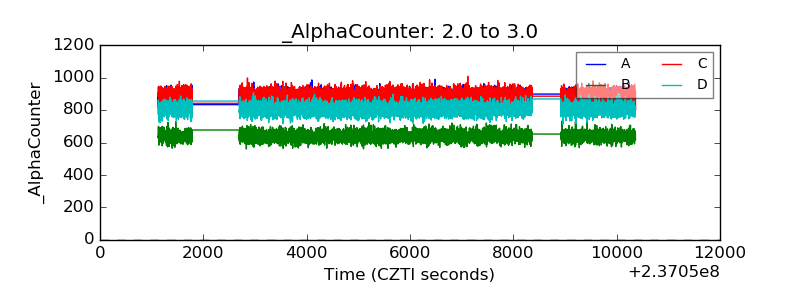 |
| _CPM_Rate | 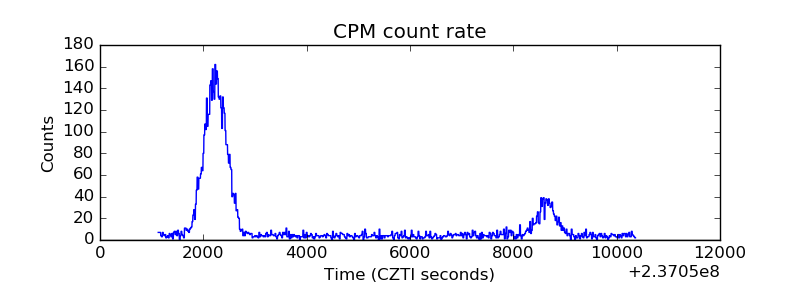 |
| CZT Counter | 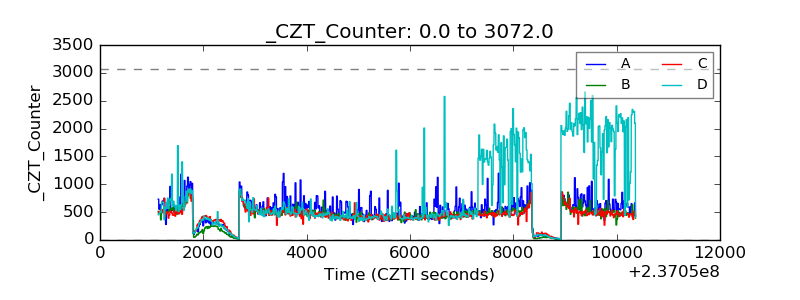 |
| +2.5 Volts monitor |  |
| +5 Volts monitor |  |
| _ROLL_ROT | 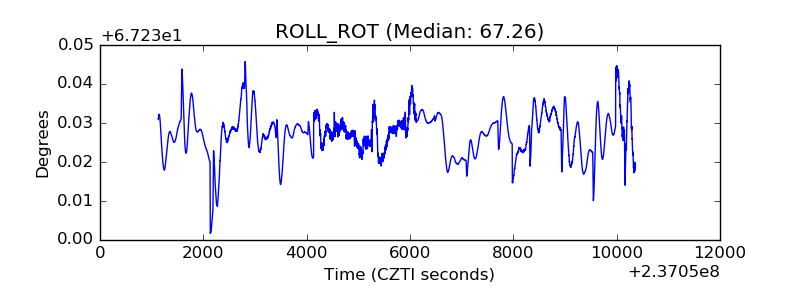 |
| _Roll_DEC | 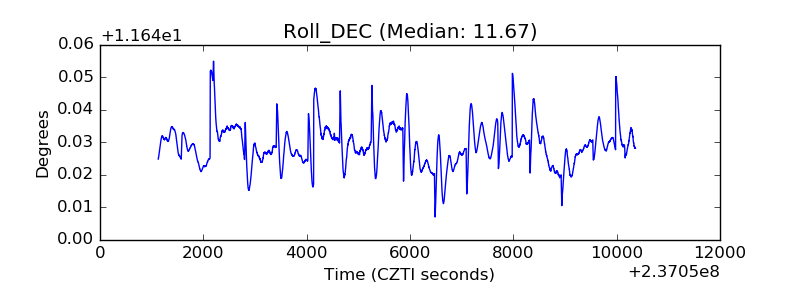 |
| _Roll_RA | 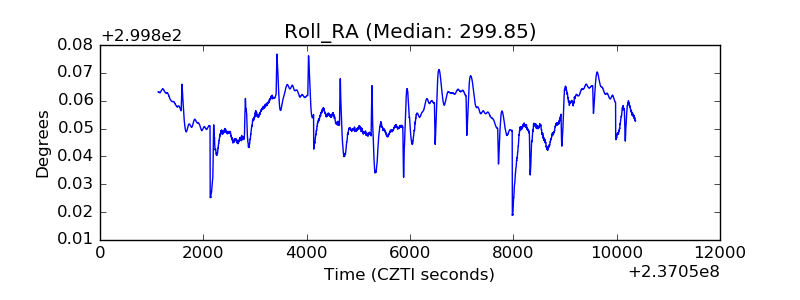 |
| Veto Counter | 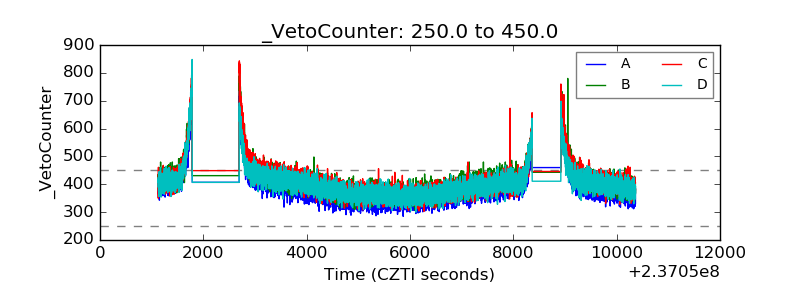 |