| Param | Original file | Final file |
|---|---|---|
| Filename | modeM0/AS1G07_052T01_9000001362_09586cztM0_level2.evt | modeM0/AS1G07_052T01_9000001362_09586cztM0_level2_quad_clean.evt |
| Size (bytes) | 169,320,960 | 27,751,680 |
| Size | 161.5 MB | 26.5 MB |
| Events in quadrant A | 923,829 | 188,248 |
| Events in quadrant B | 781,764 | 197,080 |
| Events in quadrant C | 775,646 | 190,710 |
| Events in quadrant D | 2,534,849 | 144,867 |
| Mode SS | |||
|---|---|---|---|
| Quadrant | BADHDUFLAG | Total packets | Discarded packets |
| A | 0 | 36 | 0 |
| B | 0 | 36 | 6 |
| C | 0 | 36 | 4 |
| D | 0 | 36 | 2 |
| Mode M0 | |||
|---|---|---|---|
| Quadrant | BADHDUFLAG | Total packets | Discarded packets |
| A | 0 | 4313 | 475 |
| B | 0 | 3658 | 282 |
| C | 0 | 3617 | 247 |
| D | 0 | 10747 | 2217 |
| Quadrant | Total seconds | Saturated seconds | Saturation percentage |
|---|---|---|---|
| A | 1621 | 22 | 1.357187% |
| B | 1666 | 2 | 0.120048% |
| C | 1681 | 2 | 0.118977% |
| D | 1465 | 617 | 42.116041% |
Noise dominated data is calculated using 1-second bins in cleaned event files. If a bin has >2000 counts, and if more than 50% of those come from <1% of pixels, then it is considered to be noise-dominated and hence unusable.
| Quadrant | # 1 sec bins | Bins with >0 counts | Bins with >2000 counts | High rate bins dominated by noise | Noise dominated (total time) | Noise dominated (detector-on time) | Marked lightcurve |
|---|---|---|---|---|---|---|---|
| A | 1803 | 1756 | 0 | 0 | 0.00% | 0.00% | 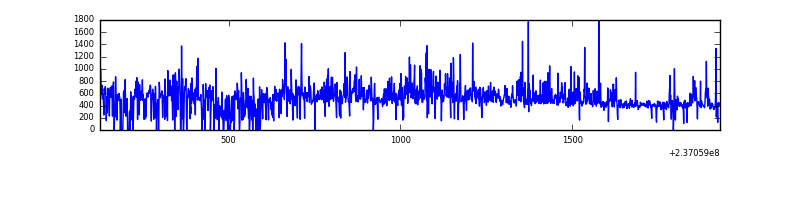 |
| B | 1804 | 1780 | 0 | 0 | 0.00% | 0.00% | 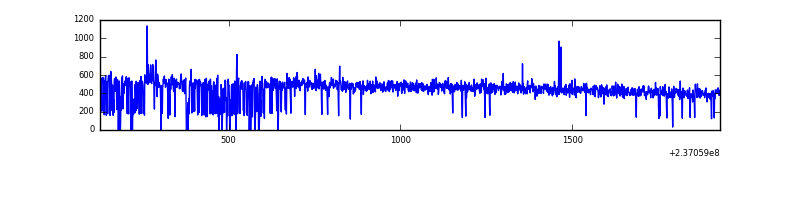 |
| C | 1804 | 1776 | 0 | 0 | 0.00% | 0.00% | 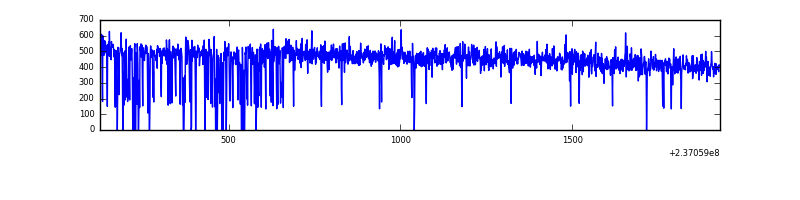 |
| D | 1803 | 1662 | 498 | 498 | 27.62% | 29.96% | 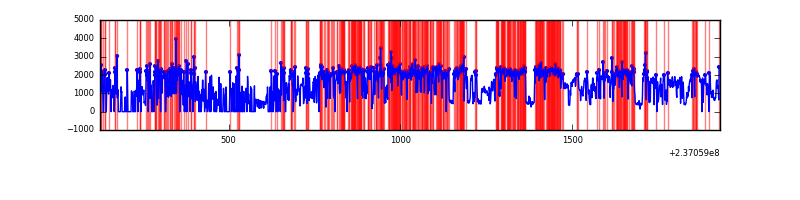 |
Top three noisy pixels from each quadrant. If the there are fewer than three noisy pixels in the level2.evt file, extra rows are filled as -1
| Pixel properties | Quadrant properties | ||||||
|---|---|---|---|---|---|---|---|
| Quadrant | DetID | PixID | Counts | Sigma | Mean | Median | Sigma |
| A | 1 | 162 | 74939 | 1817.61 | 191 | 187 | 41.1 |
| A | 1 | 178 | 40261 | 974.41 | 191 | 187 | 41.1 |
| A | 1 | 161 | 37388 | 904.55 | 191 | 187 | 41.1 |
| B | 12 | 111 | 4468 | 105.25 | 199 | 194 | 40.6 |
| B | 0 | 189 | 4108 | 96.38 | 199 | 194 | 40.6 |
| B | 11 | 111 | 3671 | 85.62 | 199 | 194 | 40.6 |
| C | 13 | 61 | 1448 | 25.58 | 198 | 199 | 48.8 |
| C | 7 | 235 | 536 | 6.9 | 198 | 199 | 48.8 |
| C | 12 | 4 | 510 | 6.37 | 198 | 199 | 48.8 |
| D | 1 | 52 | 1936023 | 46360.24 | 153 | 150 | 41.8 |
| D | 2 | 234 | 4993 | 115.98 | 153 | 150 | 41.8 |
| D | 8 | 195 | 4418 | 102.21 | 153 | 150 | 41.8 |
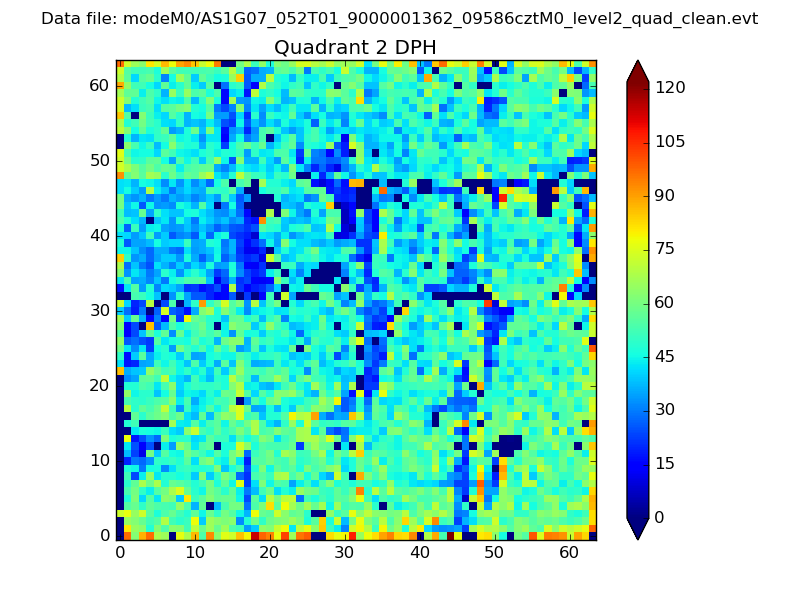
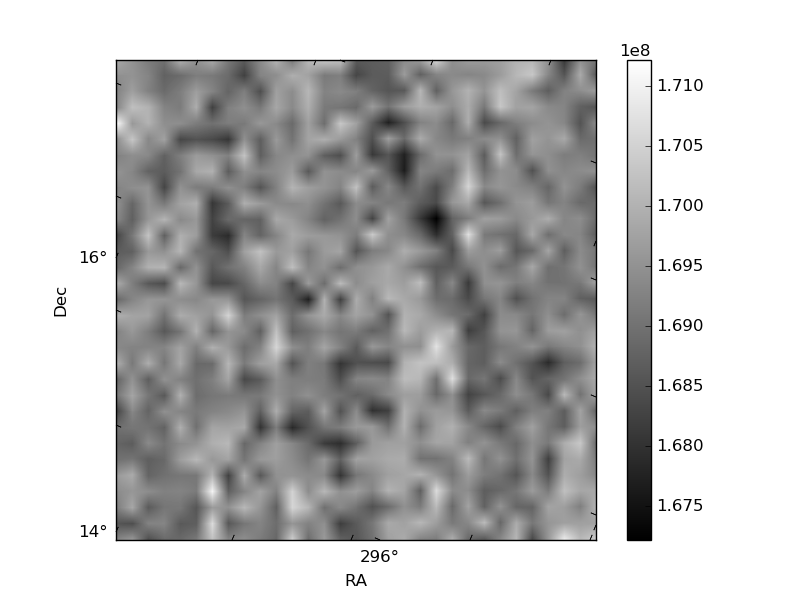
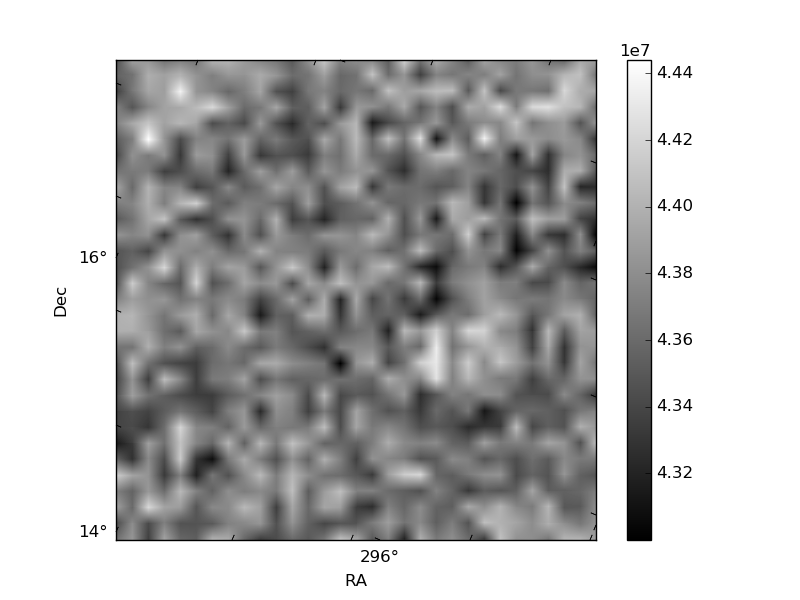
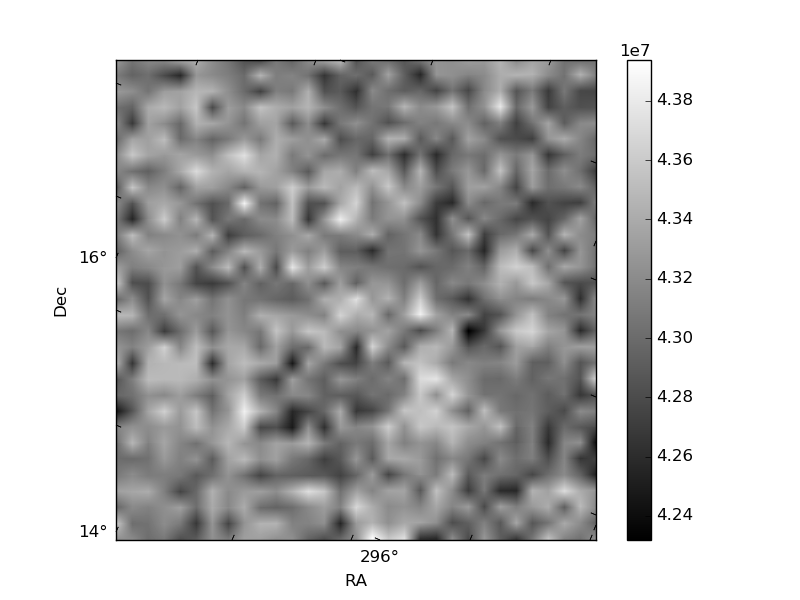
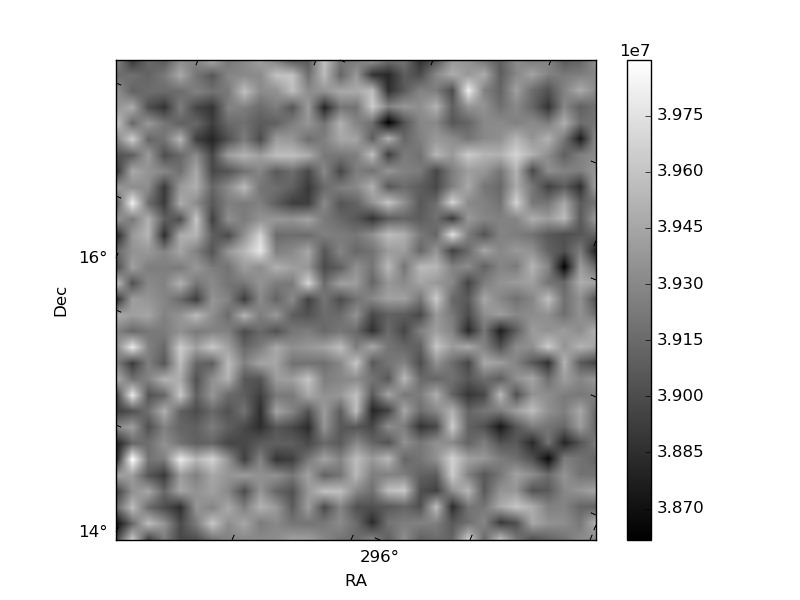
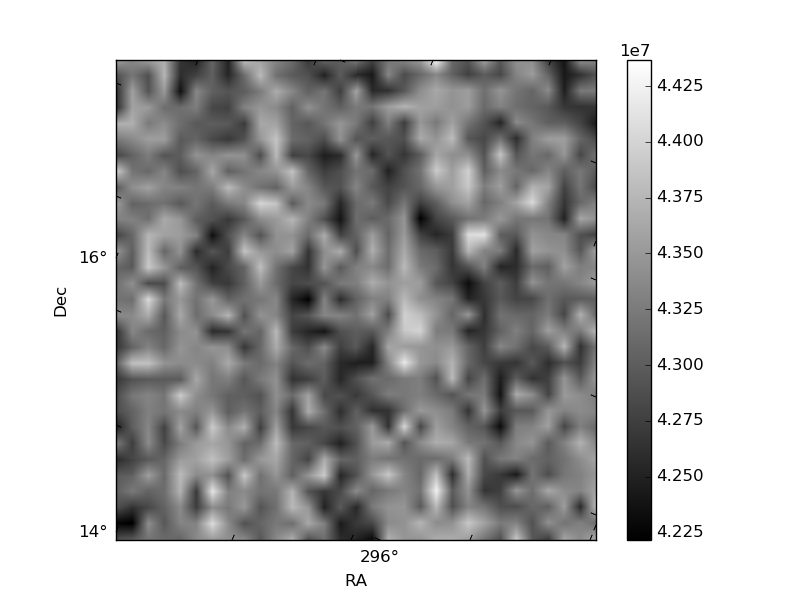
Histogram calculated using DETX and DETY for each event in the final _common_clean file
| Quadrant A | 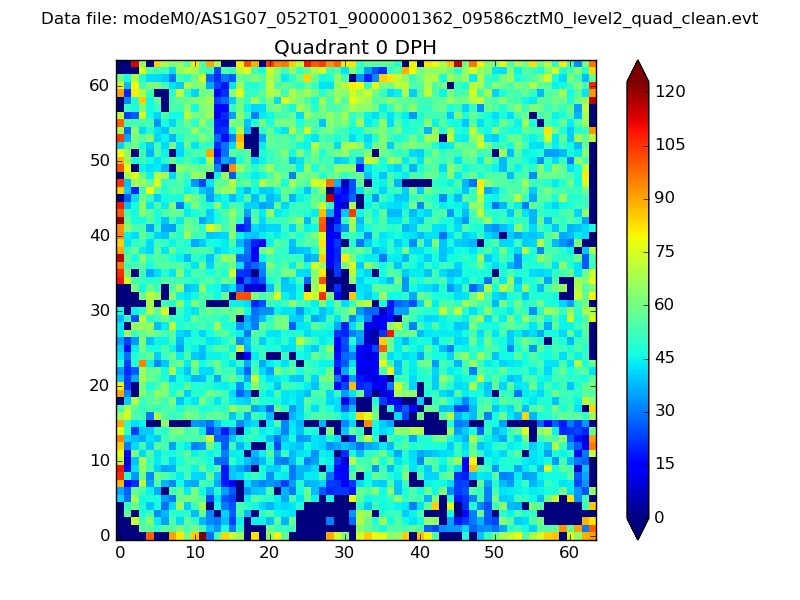 |
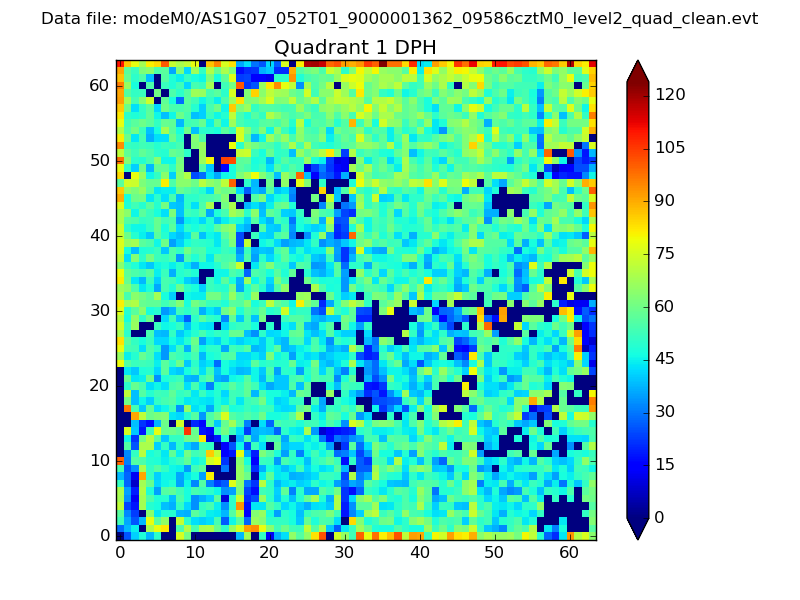 |
Quadrant B |
|---|---|---|---|
| Quadrant D | 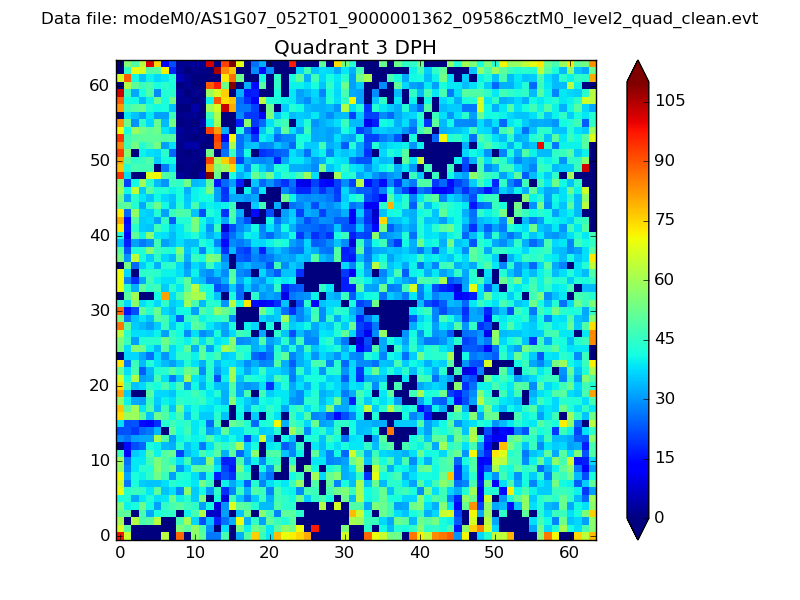 |
 |
Quadrant C |
| Plot type | Count rate plots | Images |
|---|---|---|
| Comparison with Poisson distribution Blue bars denote a histogram of data divided into 1 sec bins. Red curve is a Poisson curve with rate = median count rate of data. |
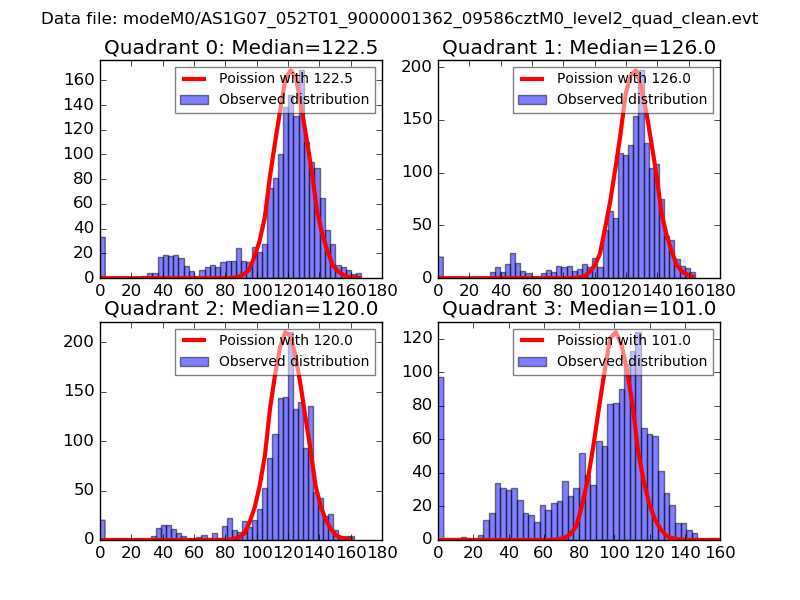 |
 |
| Quadrant-wise count rates Data is divided into 100 sec bins |
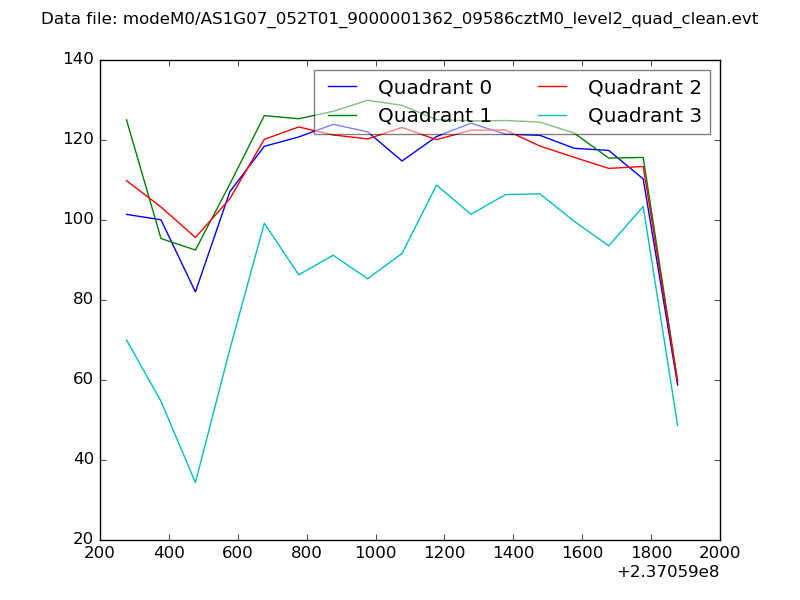 |
|
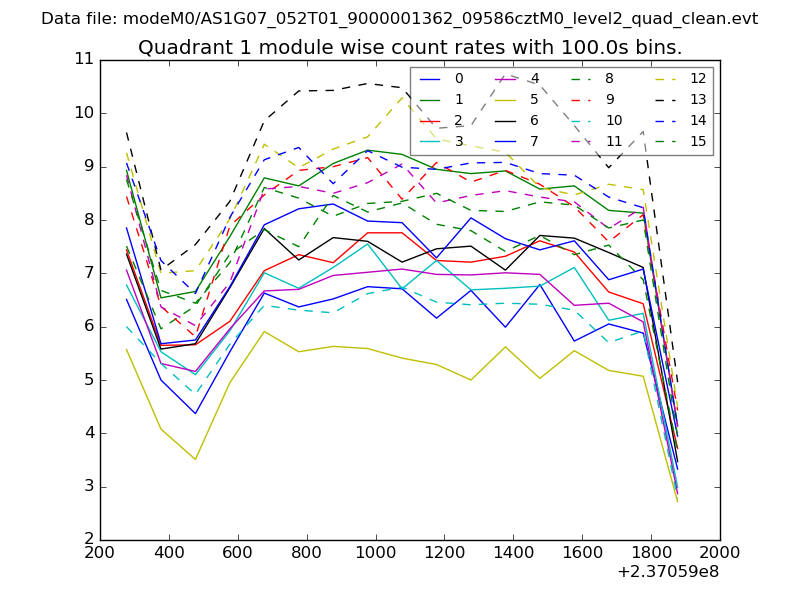
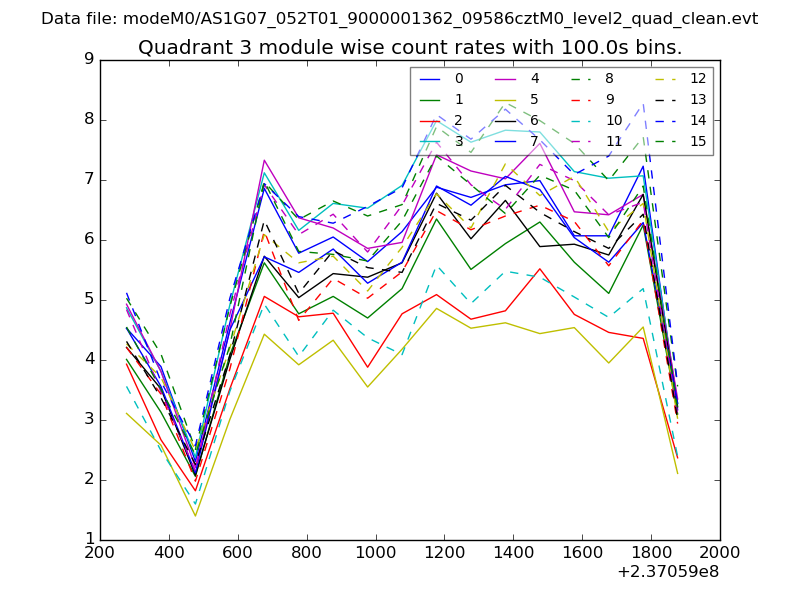
| Module-wise count rates for Quadrant A Data is divided into 100 sec bins |
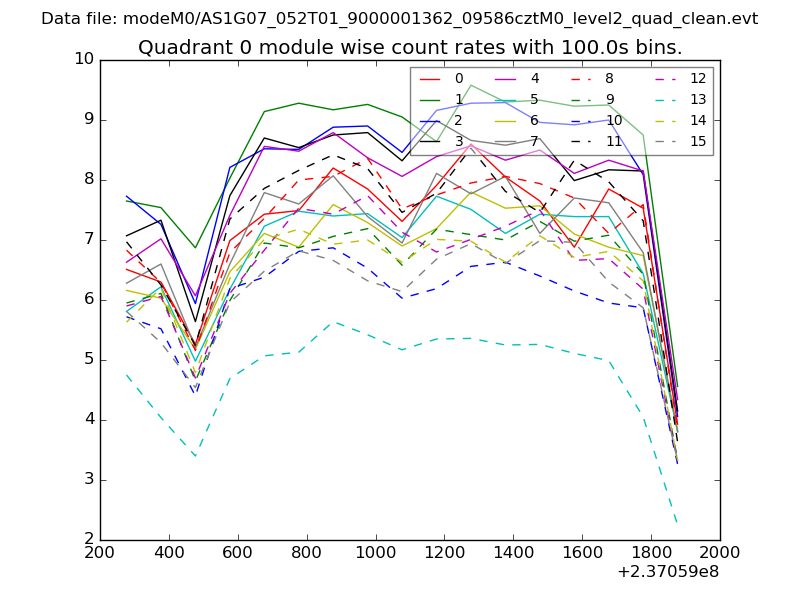 |
 |
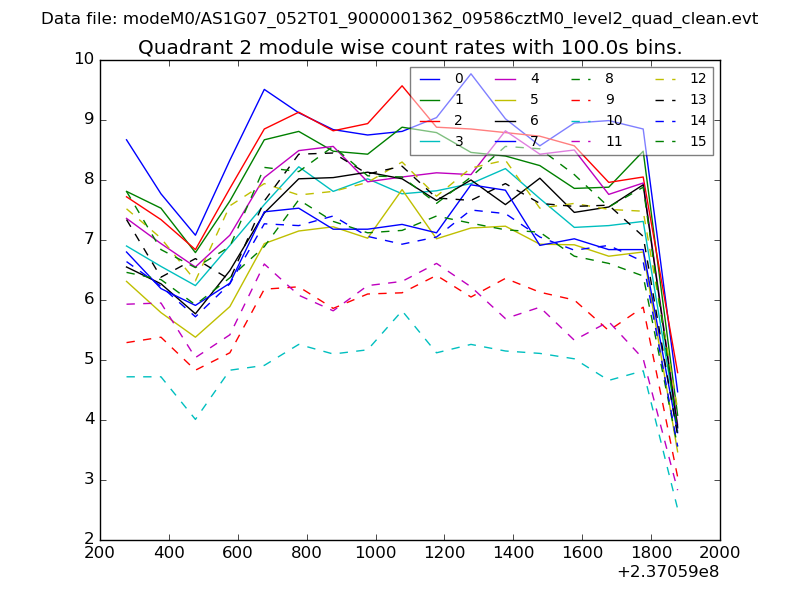
| Module-wise count rates for Quadrant B Data is divided into 100 sec bins |
 |
 |
| Module-wise count rates for Quadrant C Data is divided into 100 sec bins |
 |
 |
| Module-wise count rates for Quadrant D Data is divided into 100 sec bins |
 |
 |
| Parameter | Plot |
|---|---|
| CZT HV Monitor | 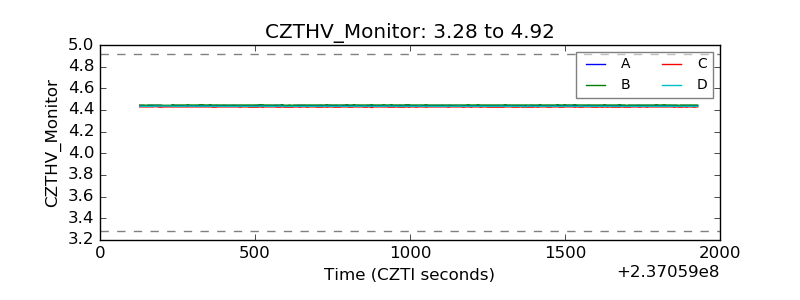 |
| D_VDD | 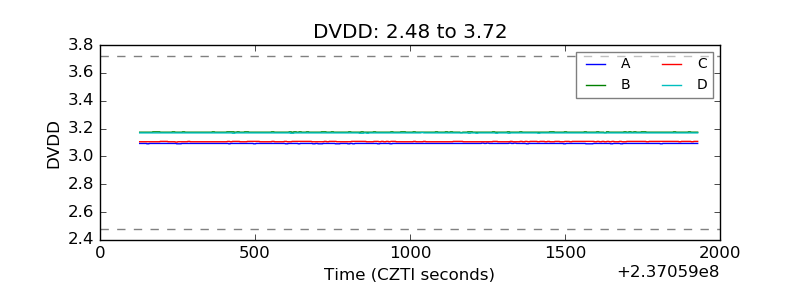 |
| Temperature 1 |  |
| Veto HV Monitor | 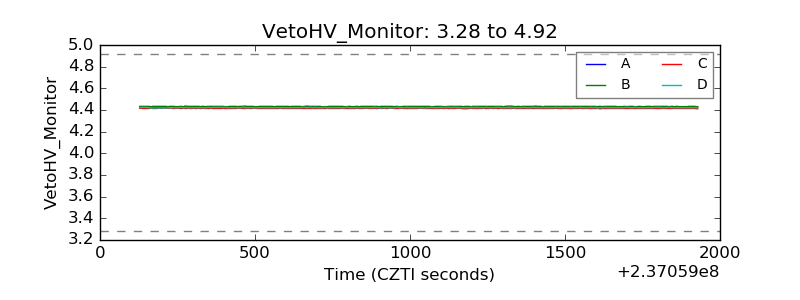 |
| Veto LLD | 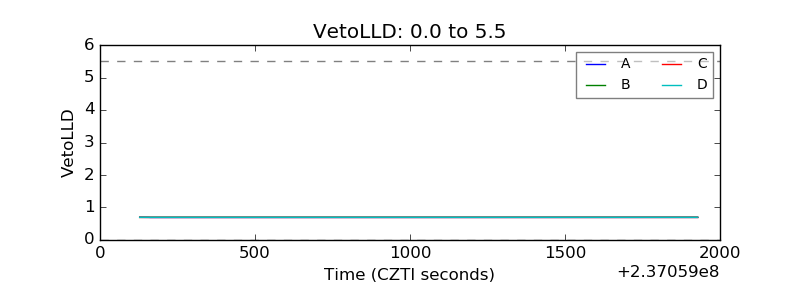 |
| Alpha Counter | 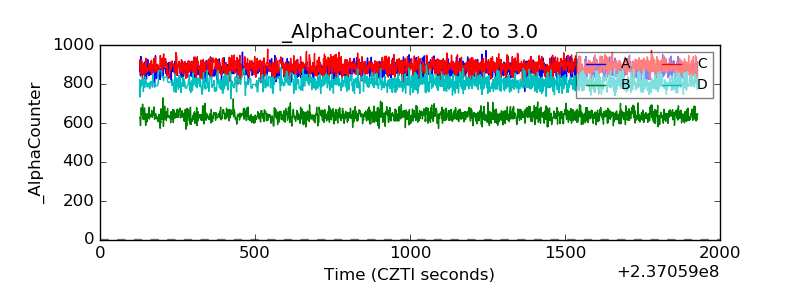 |
| _CPM_Rate | 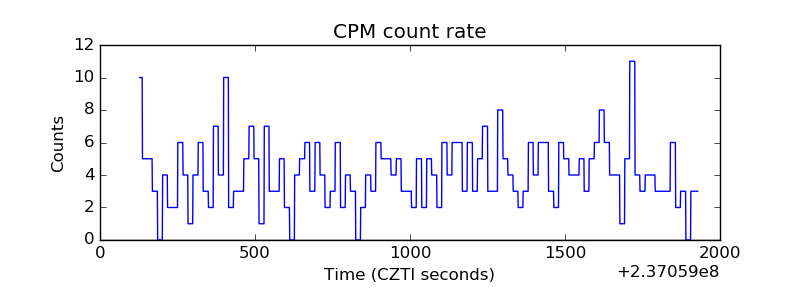 |
| CZT Counter |  |
| +2.5 Volts monitor |  |
| +5 Volts monitor |  |
| _ROLL_ROT | 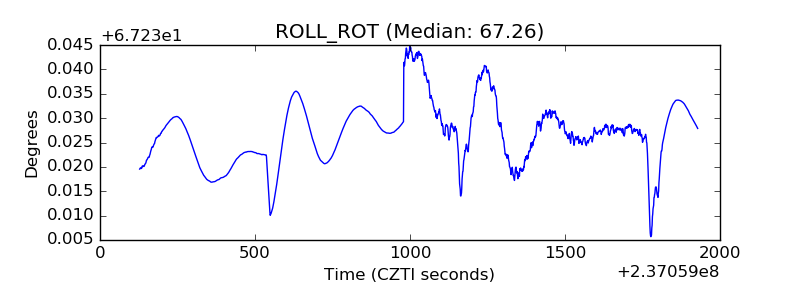 |
| _Roll_DEC | 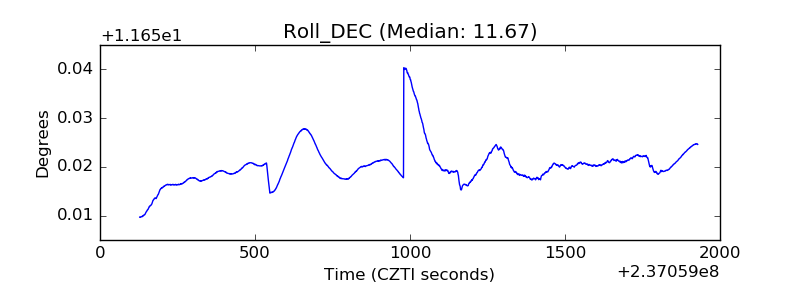 |
| _Roll_RA | 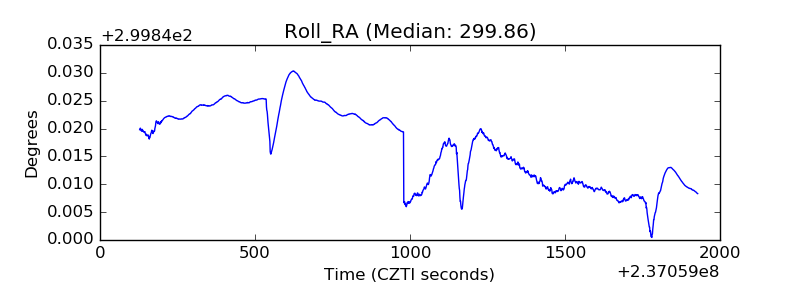 |
| Veto Counter | 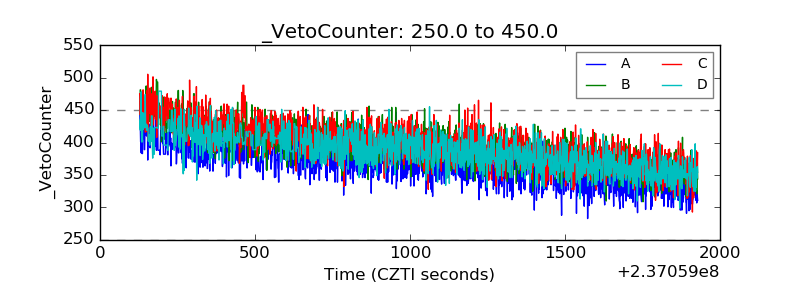 |