| Param | Original file | Final file |
|---|---|---|
| Filename | modeM0/AS1A03_009T01_9000001366_09622cztM0_level2.evt | modeM0/AS1A03_009T01_9000001366_09622cztM0_level2_quad_clean.evt |
| Size (bytes) | 468,619,200 | 87,266,880 |
| Size | 446.9 MB | 83.2 MB |
| Events in quadrant A | 3,171,814 | 546,990 |
| Events in quadrant B | 3,255,319 | 549,617 |
| Events in quadrant C | 3,131,845 | 549,815 |
| Events in quadrant D | 4,171,283 | 522,390 |
| Mode M9 | |||
|---|---|---|---|
| Quadrant | BADHDUFLAG | Total packets | Discarded packets |
| A | 0 | 22 | 0 |
| B | 0 | 22 | 0 |
| C | 0 | 22 | 0 |
| D | 0 | 22 | 0 |
| Mode SS | |||
|---|---|---|---|
| Quadrant | BADHDUFLAG | Total packets | Discarded packets |
| A | 0 | 138 | 0 |
| B | 0 | 138 | 0 |
| C | 0 | 138 | 0 |
| D | 0 | 138 | 0 |
| Mode M0 | |||
|---|---|---|---|
| Quadrant | BADHDUFLAG | Total packets | Discarded packets |
| A | 0 | 13939 | 3 |
| B | 0 | 14044 | 7 |
| C | 0 | 13920 | 6 |
| D | 0 | 16906 | 11 |
| Quadrant | Total seconds | Saturated seconds | Saturation percentage |
|---|---|---|---|
| A | 6808 | 32 | 0.470035% |
| B | 6806 | 39 | 0.573024% |
| C | 6806 | 32 | 0.470173% |
| D | 6806 | 252 | 3.702615% |
Noise dominated data is calculated using 1-second bins in cleaned event files. If a bin has >2000 counts, and if more than 50% of those come from <1% of pixels, then it is considered to be noise-dominated and hence unusable.
| Quadrant | # 1 sec bins | Bins with >0 counts | Bins with >2000 counts | High rate bins dominated by noise | Noise dominated (total time) | Noise dominated (detector-on time) | Marked lightcurve |
|---|---|---|---|---|---|---|---|
| A | 8948 | 6810 | 1 | 1 | 0.01% | 0.01% | 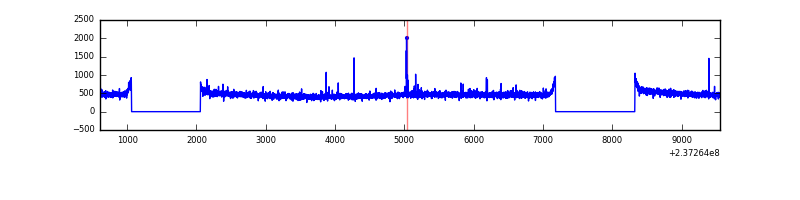 |
| B | 8948 | 6810 | 1 | 1 | 0.01% | 0.01% | 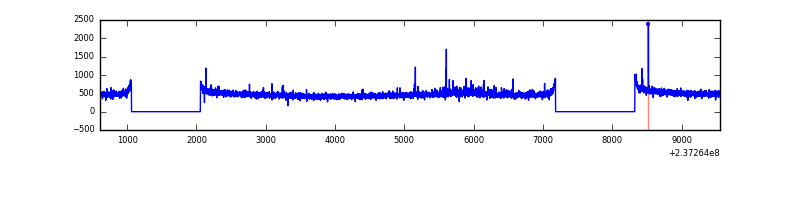 |
| C | 8948 | 6810 | 0 | 0 | 0.00% | 0.00% | 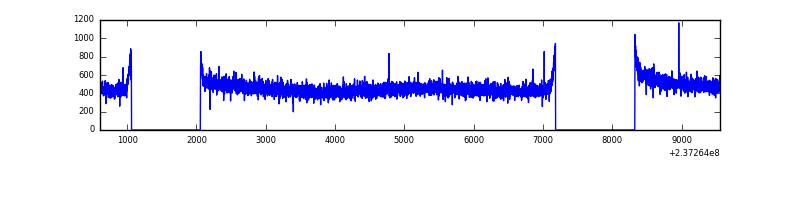 |
| D | 8948 | 6810 | 204 | 204 | 2.28% | 3.00% | 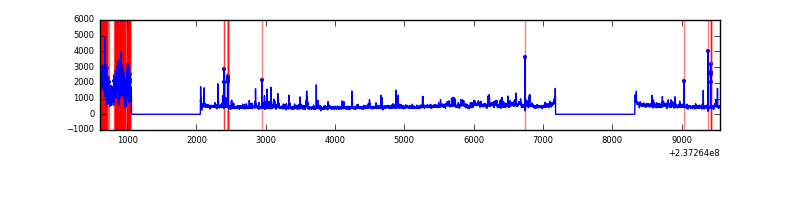 |
Top three noisy pixels from each quadrant. If the there are fewer than three noisy pixels in the level2.evt file, extra rows are filled as -1
| Pixel properties | Quadrant properties | ||||||
|---|---|---|---|---|---|---|---|
| Quadrant | DetID | PixID | Counts | Sigma | Mean | Median | Sigma |
| A | 13 | 248 | 22417 | 131.07 | 818 | 801 | 164.9 |
| A | 0 | 226 | 7523 | 40.76 | 818 | 801 | 164.9 |
| A | 12 | 194 | 6867 | 36.78 | 818 | 801 | 164.9 |
| B | 0 | 214 | 36513 | 230.63 | 823 | 806 | 154.8 |
| B | 12 | 111 | 17148 | 105.55 | 823 | 806 | 154.8 |
| B | 11 | 111 | 13858 | 84.3 | 823 | 806 | 154.8 |
| C | 13 | 61 | 6190 | 29.14 | 802 | 806 | 184.8 |
| C | 14 | 67 | 2795 | 10.76 | 802 | 806 | 184.8 |
| C | 14 | 234 | 2199 | 7.54 | 802 | 806 | 184.8 |
| D | 12 | 233 | 691917 | 3499.04 | 782 | 762 | 197.5 |
| D | 1 | 239 | 180629 | 910.59 | 782 | 762 | 197.5 |
| D | 1 | 52 | 157108 | 791.52 | 782 | 762 | 197.5 |
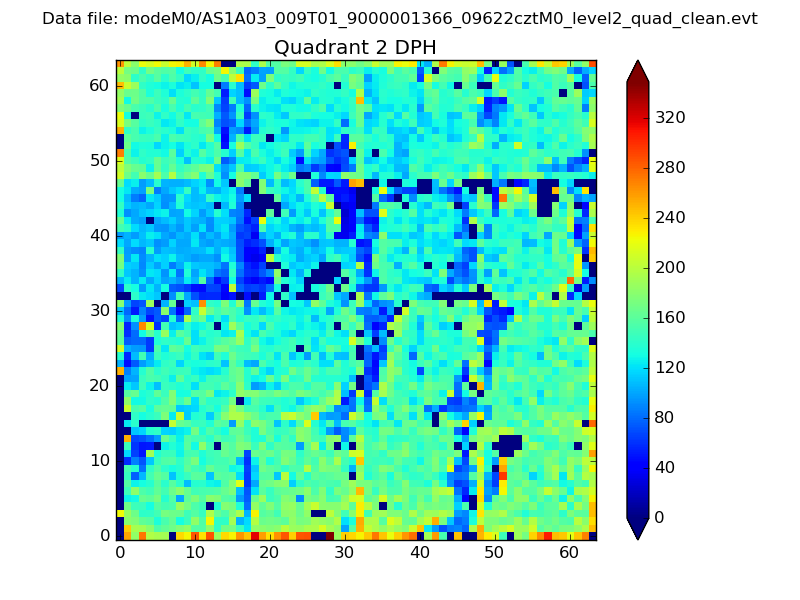
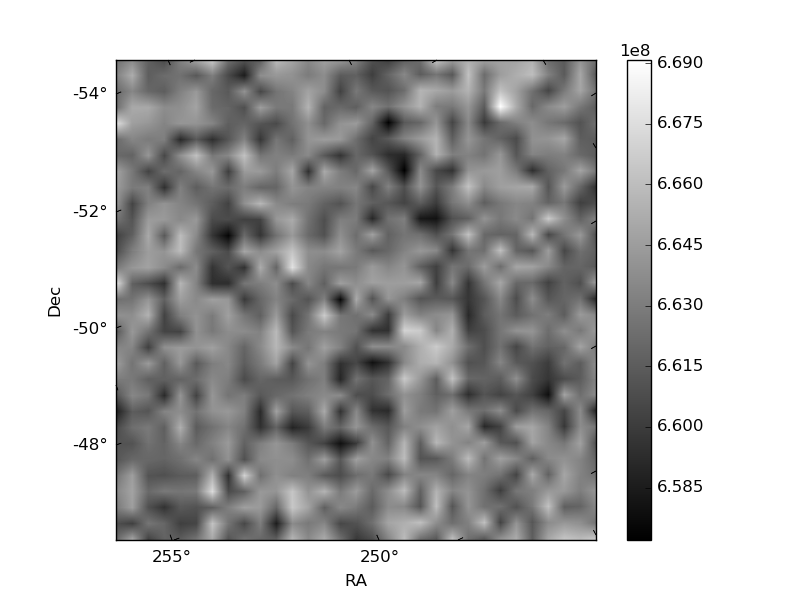
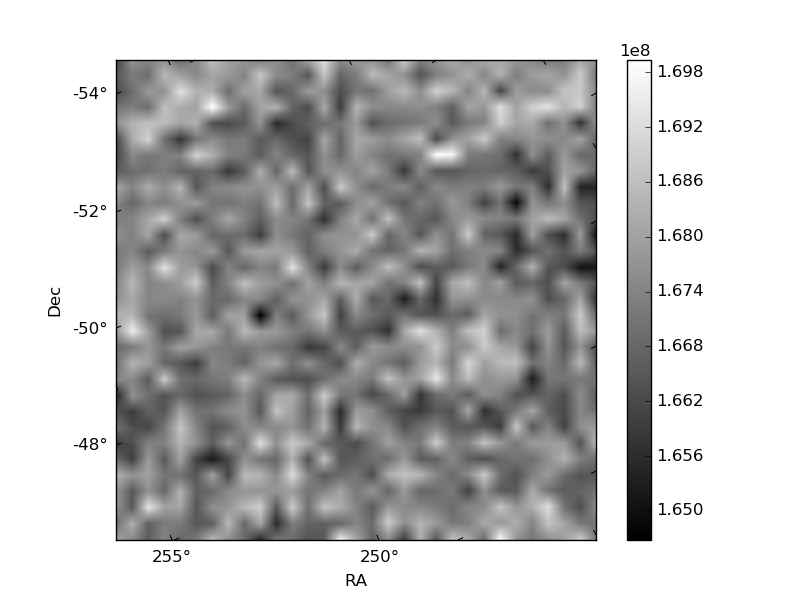
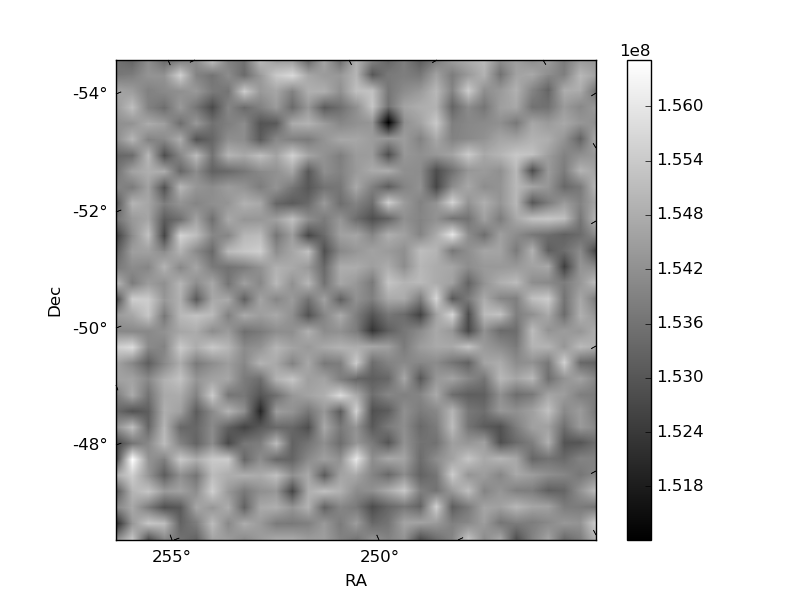
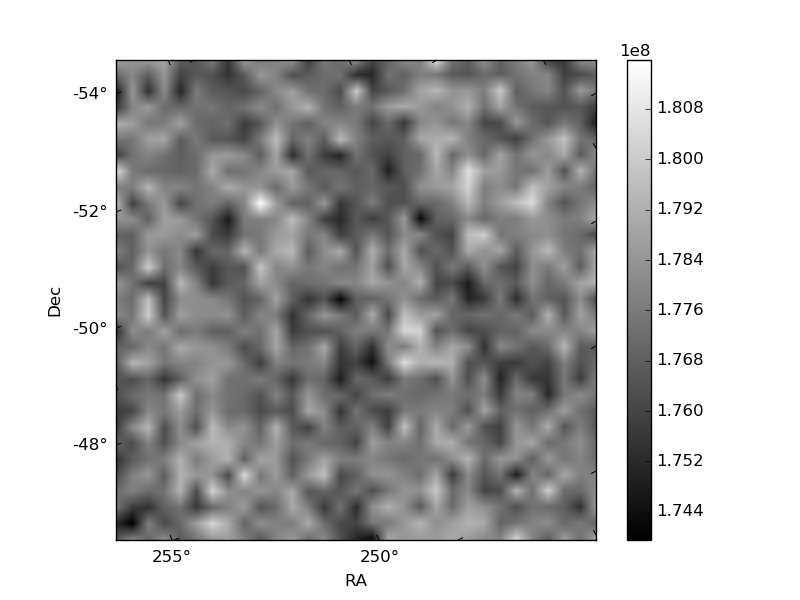
Histogram calculated using DETX and DETY for each event in the final _common_clean file
| Quadrant A | 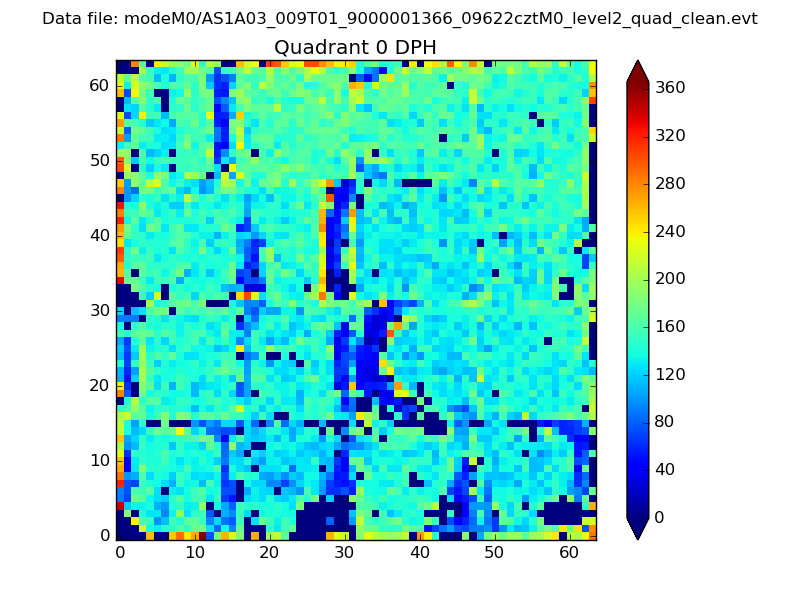 |
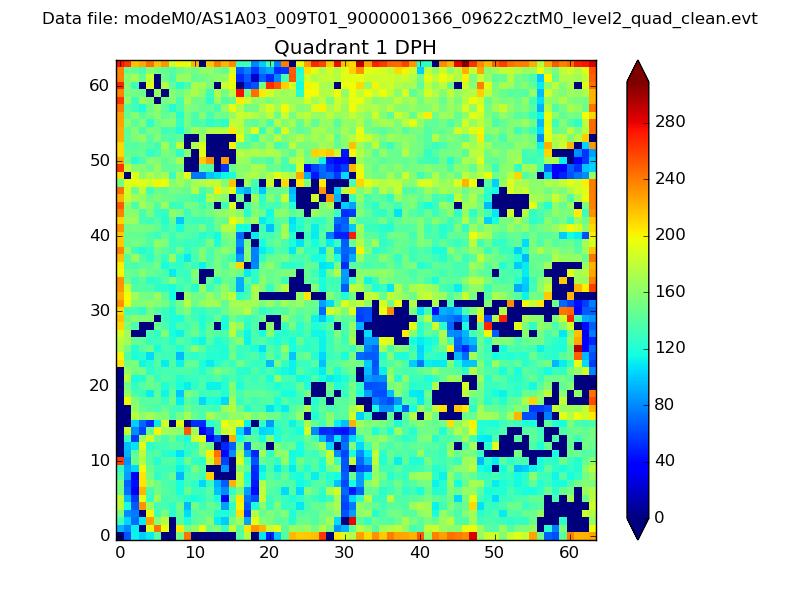 |
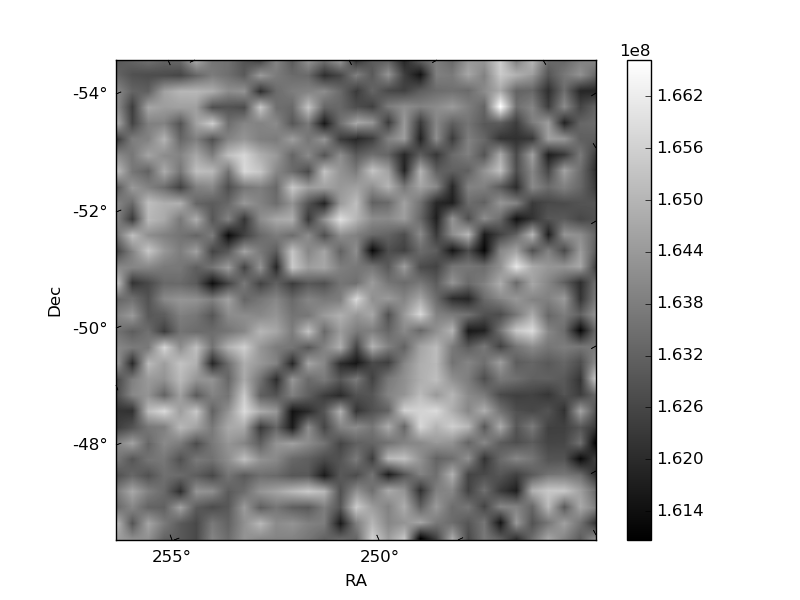
Quadrant B |
|---|---|---|---|
| Quadrant D | 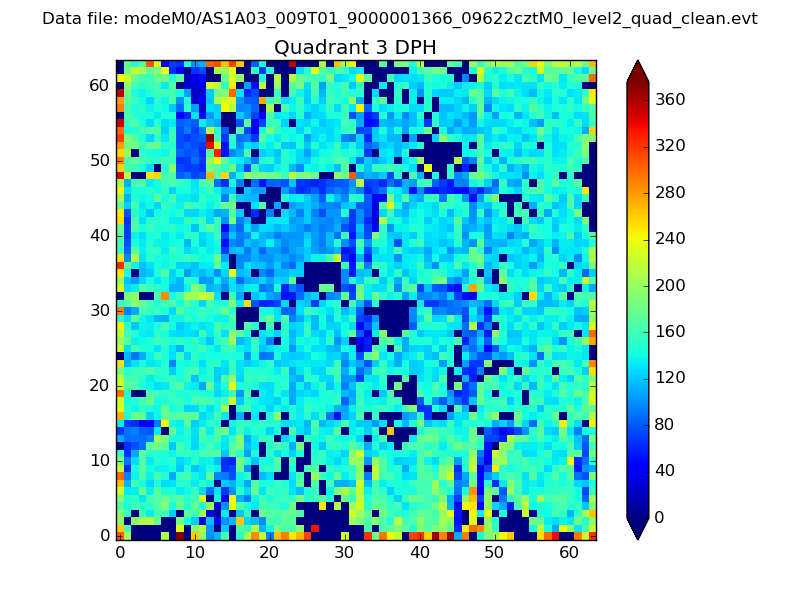 |
 |
Quadrant C |
| Plot type | Count rate plots | Images |
|---|---|---|
| Comparison with Poisson distribution Blue bars denote a histogram of data divided into 1 sec bins. Red curve is a Poisson curve with rate = median count rate of data. |
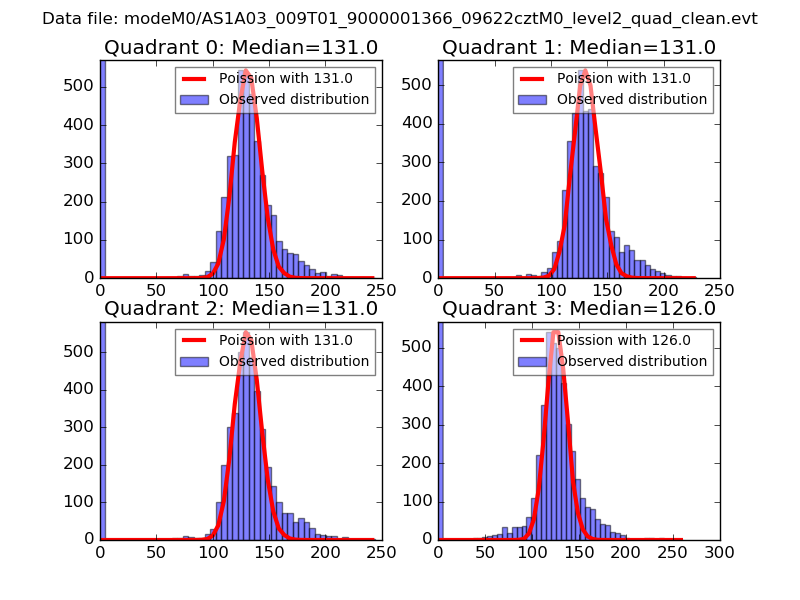 |
 |
| Quadrant-wise count rates Data is divided into 100 sec bins |
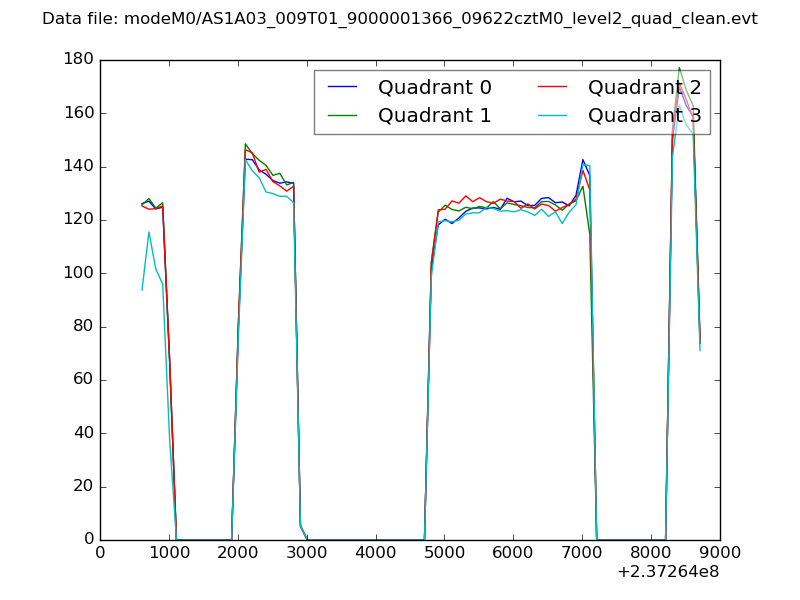 |
|
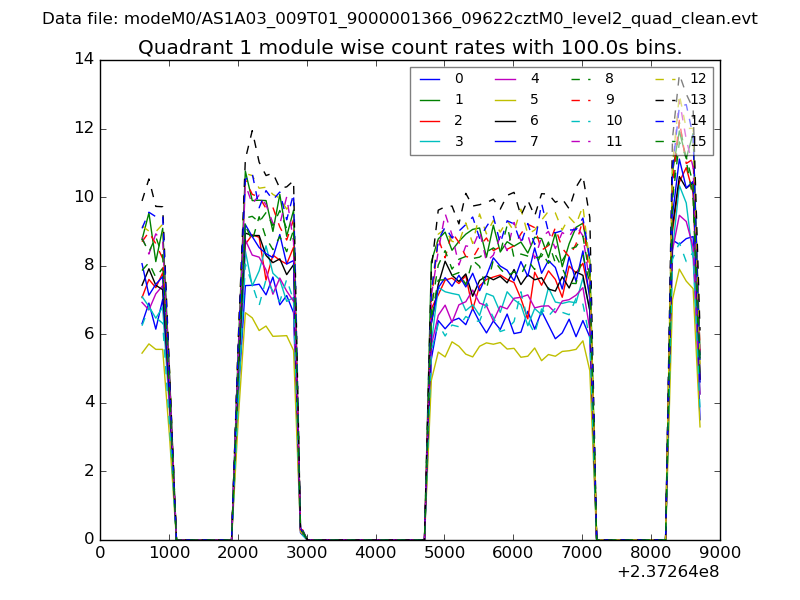
| Module-wise count rates for Quadrant A Data is divided into 100 sec bins |
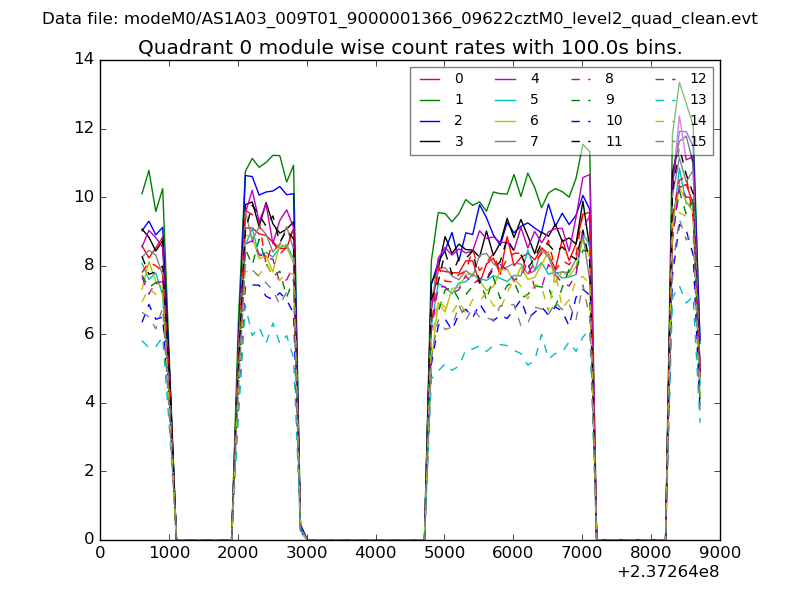 |
 |
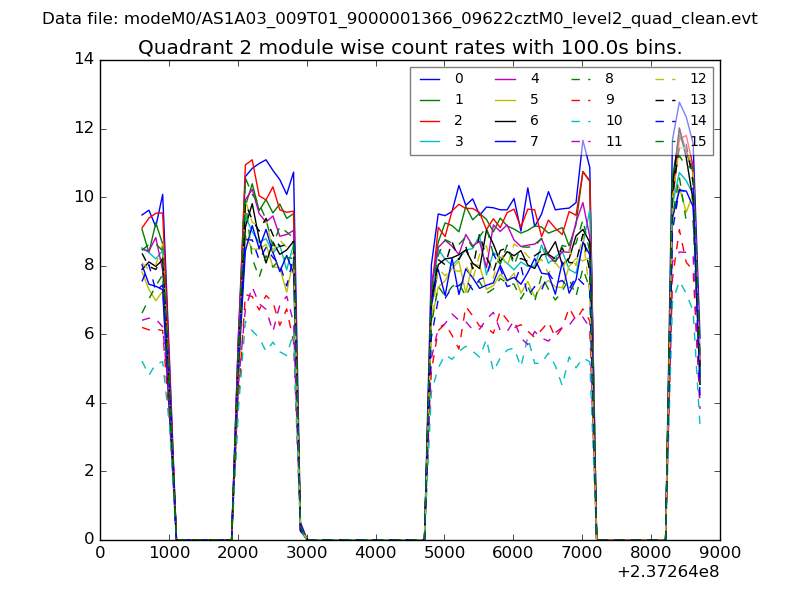
| Module-wise count rates for Quadrant B Data is divided into 100 sec bins |
 |
 |
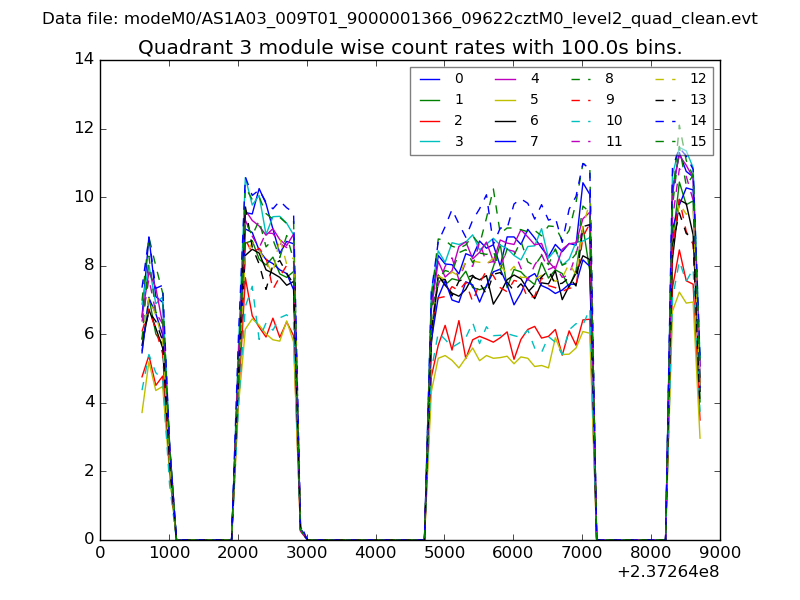
| Module-wise count rates for Quadrant C Data is divided into 100 sec bins |
 |
 |
| Module-wise count rates for Quadrant D Data is divided into 100 sec bins |
 |
 |
| Parameter | Plot |
|---|---|
| CZT HV Monitor | 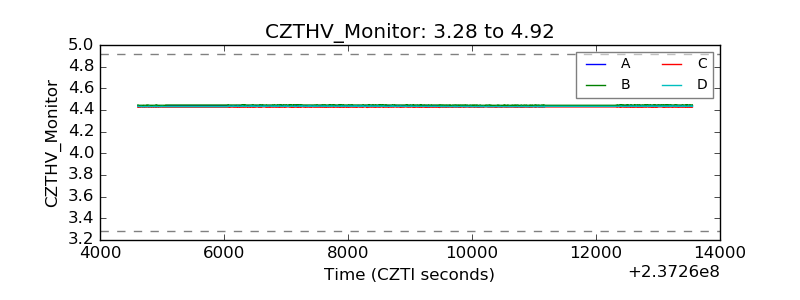 |
| D_VDD | 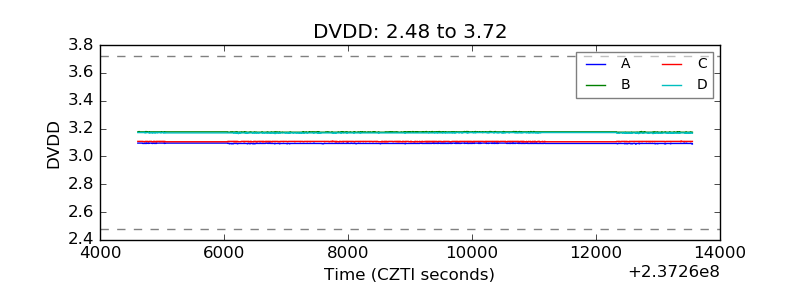 |
| Temperature 1 | 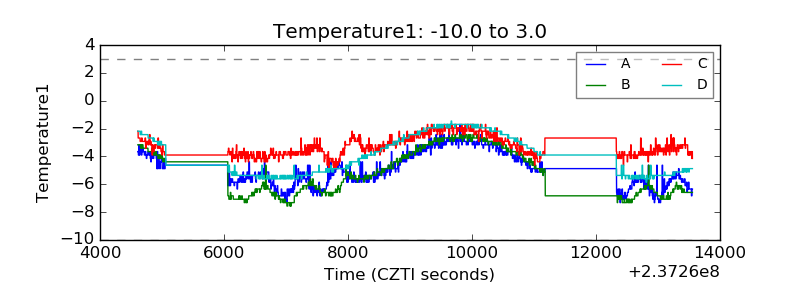 |
| Veto HV Monitor | 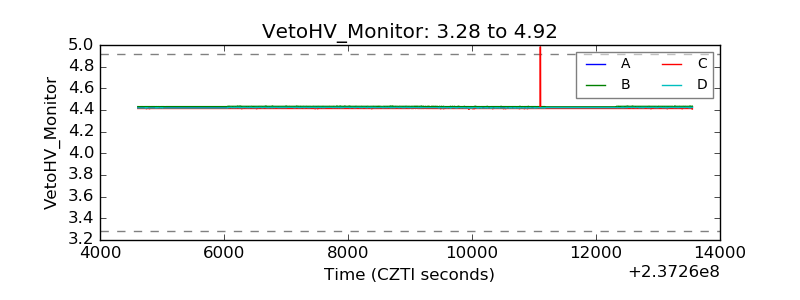 |
| Veto LLD | 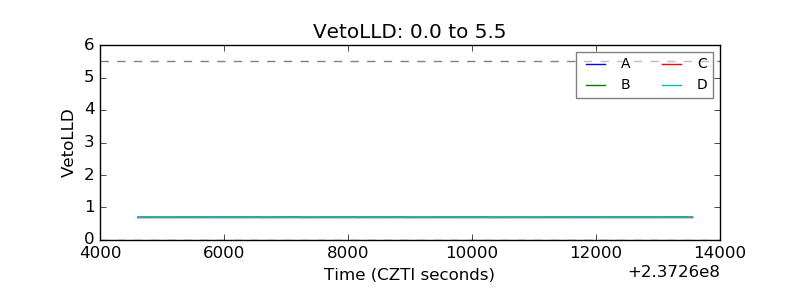 |
| Alpha Counter | 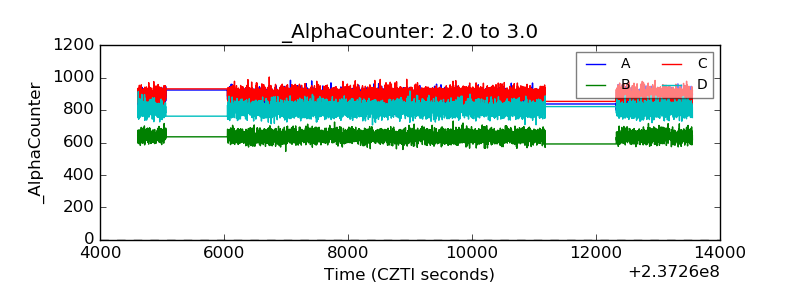 |
| _CPM_Rate | 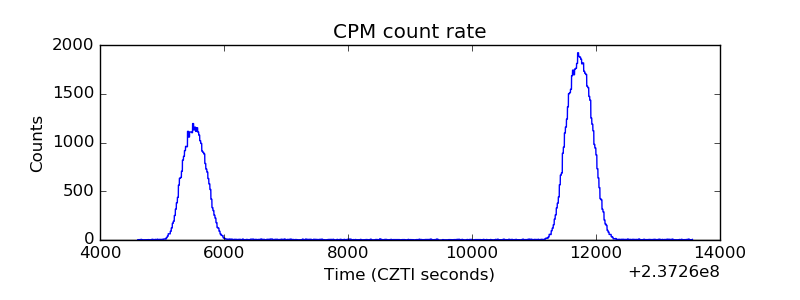 |
| CZT Counter | 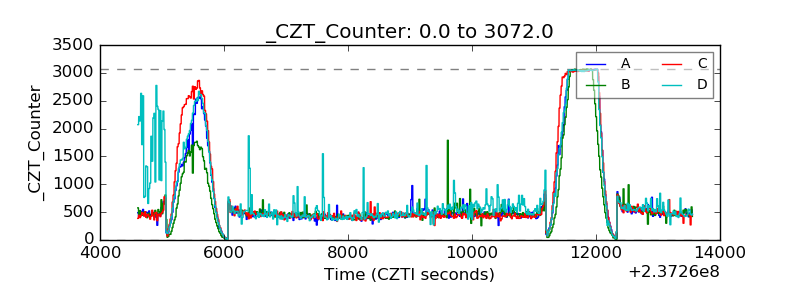 |
| +2.5 Volts monitor |  |
| +5 Volts monitor |  |
| _ROLL_ROT | 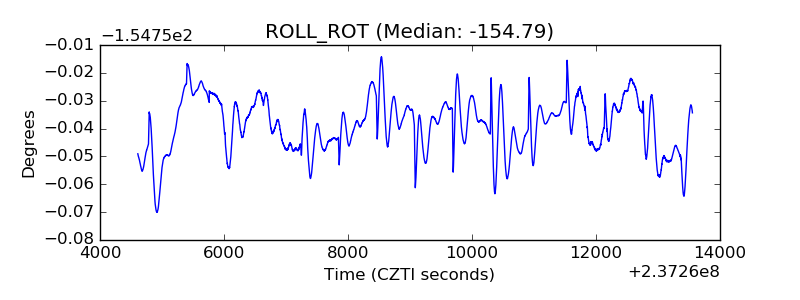 |
| _Roll_DEC | 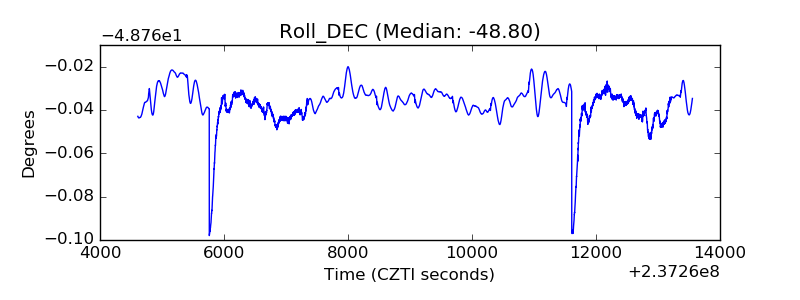 |
| _Roll_RA | 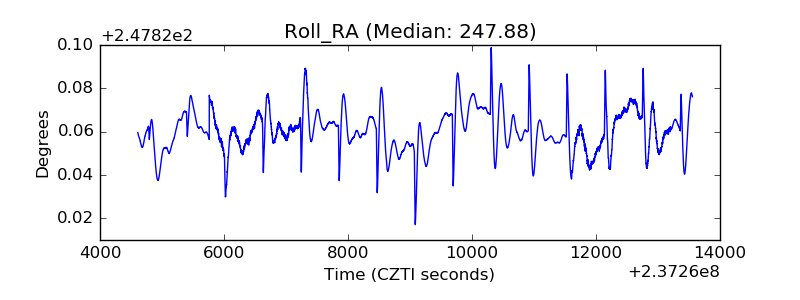 |
| Veto Counter | 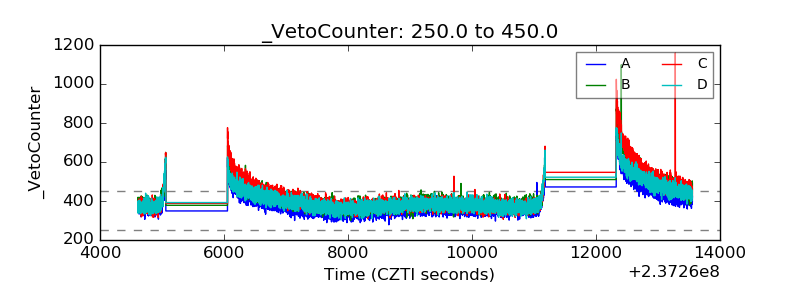 |