| Param | Original file | Final file |
|---|---|---|
| Filename | modeM0/AS1A03_009T01_9000001366_09623cztM0_level2.evt | modeM0/AS1A03_009T01_9000001366_09623cztM0_level2_quad_clean.evt |
| Size (bytes) | 417,389,760 | 64,261,440 |
| Size | 398.1 MB | 61.3 MB |
| Events in quadrant A | 2,874,654 | 391,355 |
| Events in quadrant B | 2,961,941 | 394,464 |
| Events in quadrant C | 2,842,607 | 393,074 |
| Events in quadrant D | 3,568,505 | 363,187 |
| Mode M9 | |||
|---|---|---|---|
| Quadrant | BADHDUFLAG | Total packets | Discarded packets |
| A | 0 | 18 | 0 |
| B | 0 | 18 | 0 |
| C | 0 | 18 | 0 |
| D | 0 | 19 | 0 |
| Mode SS | |||
|---|---|---|---|
| Quadrant | BADHDUFLAG | Total packets | Discarded packets |
| A | 0 | 128 | 14 |
| B | 0 | 128 | 10 |
| C | 0 | 128 | 10 |
| D | 0 | 128 | 10 |
| Mode M0 | |||
|---|---|---|---|
| Quadrant | BADHDUFLAG | Total packets | Discarded packets |
| A | 0 | 13195 | 988 |
| B | 0 | 13398 | 1017 |
| C | 0 | 13208 | 1061 |
| D | 0 | 15699 | 1446 |
| Quadrant | Total seconds | Saturated seconds | Saturation percentage |
|---|---|---|---|
| A | 5797 | 52 | 0.897016% |
| B | 5793 | 65 | 1.122044% |
| C | 5767 | 51 | 0.884342% |
| D | 5720 | 184 | 3.216783% |
Noise dominated data is calculated using 1-second bins in cleaned event files. If a bin has >2000 counts, and if more than 50% of those come from <1% of pixels, then it is considered to be noise-dominated and hence unusable.
| Quadrant | # 1 sec bins | Bins with >0 counts | Bins with >2000 counts | High rate bins dominated by noise | Noise dominated (total time) | Noise dominated (detector-on time) | Marked lightcurve |
|---|---|---|---|---|---|---|---|
| A | 7506 | 6054 | 0 | 0 | 0.00% | 0.00% | 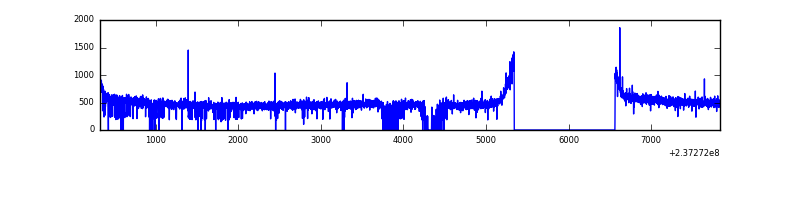 |
| B | 7506 | 6065 | 6 | 6 | 0.08% | 0.10% | 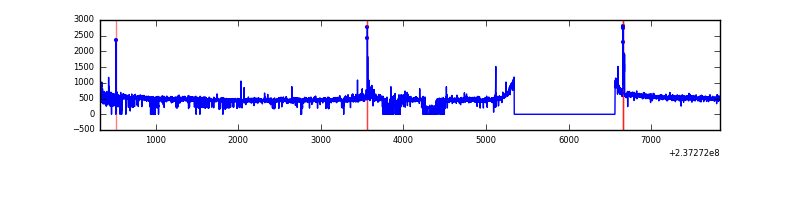 |
| C | 7506 | 6064 | 0 | 0 | 0.00% | 0.00% | 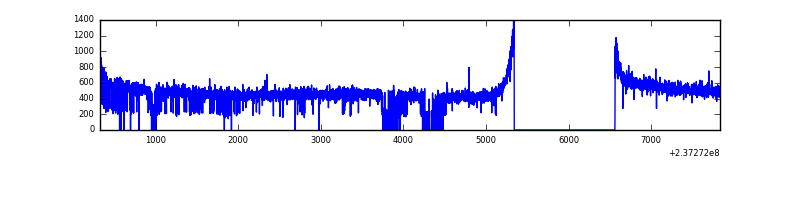 |
| D | 7506 | 6018 | 98 | 98 | 1.31% | 1.63% | 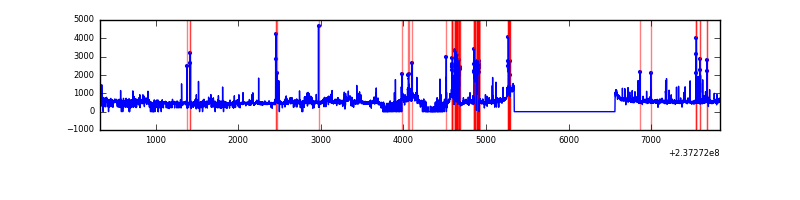 |
Top three noisy pixels from each quadrant. If the there are fewer than three noisy pixels in the level2.evt file, extra rows are filled as -1
| Pixel properties | Quadrant properties | ||||||
|---|---|---|---|---|---|---|---|
| Quadrant | DetID | PixID | Counts | Sigma | Mean | Median | Sigma |
| A | 3 | 1 | 6911 | 41.15 | 745 | 731 | 150.2 |
| A | 0 | 226 | 6905 | 41.11 | 745 | 731 | 150.2 |
| A | 12 | 194 | 6210 | 36.49 | 745 | 731 | 150.2 |
| B | 0 | 214 | 47552 | 338.47 | 742 | 726 | 138.3 |
| B | 10 | 252 | 25186 | 176.8 | 742 | 726 | 138.3 |
| B | 12 | 111 | 14871 | 102.24 | 742 | 726 | 138.3 |
| C | 13 | 61 | 5374 | 27.8 | 728 | 733 | 166.9 |
| C | 3 | 202 | 1829 | 6.57 | 728 | 733 | 166.9 |
| C | 14 | 67 | 1760 | 6.15 | 728 | 733 | 166.9 |
| D | 1 | 52 | 375002 | 2089.43 | 708 | 694 | 179.1 |
| D | 8 | 195 | 213659 | 1188.79 | 708 | 694 | 179.1 |
| D | 7 | 71 | 174962 | 972.78 | 708 | 694 | 179.1 |
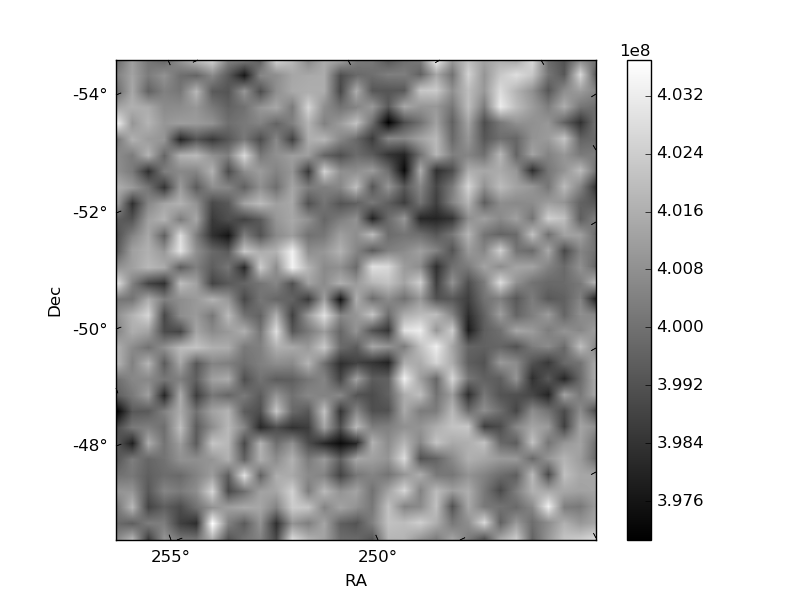
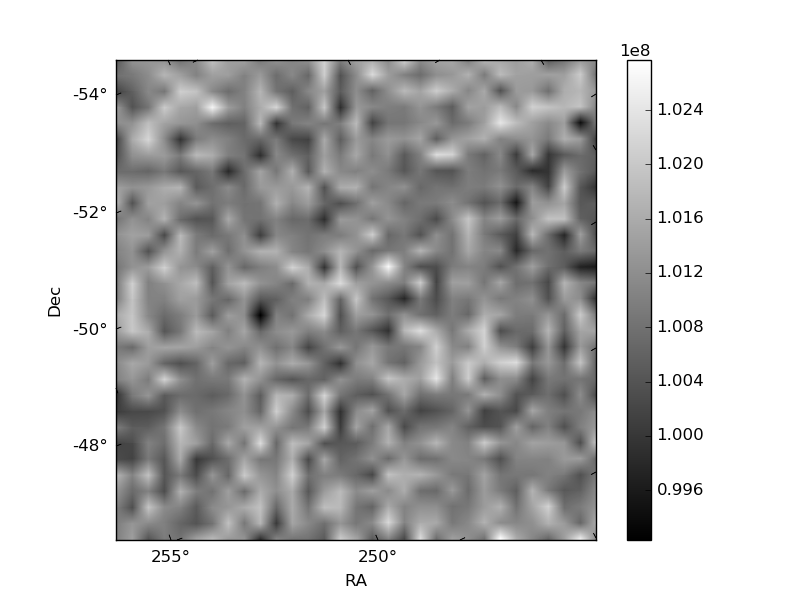
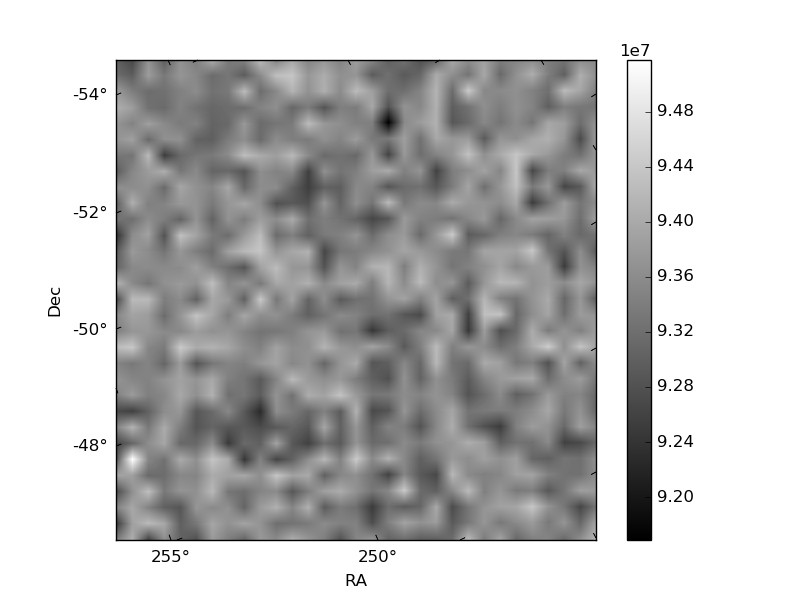
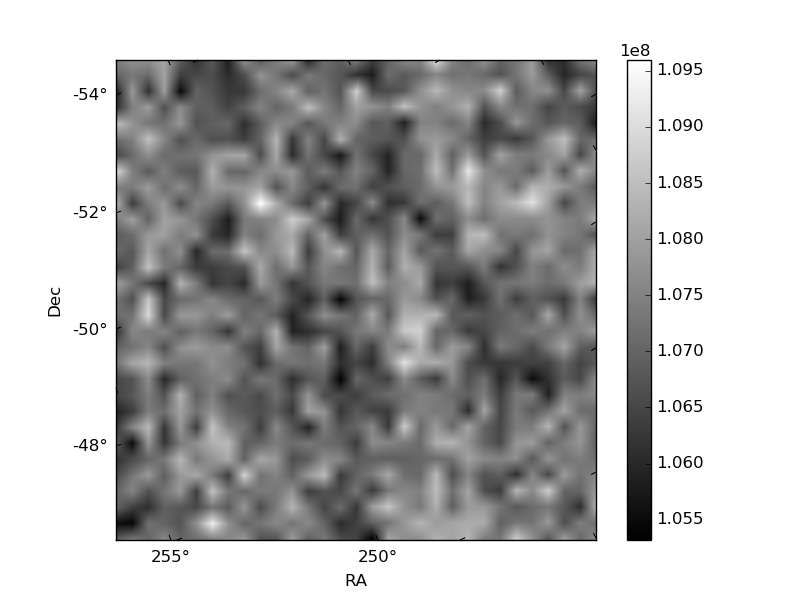
Histogram calculated using DETX and DETY for each event in the final _common_clean file
| Quadrant A | 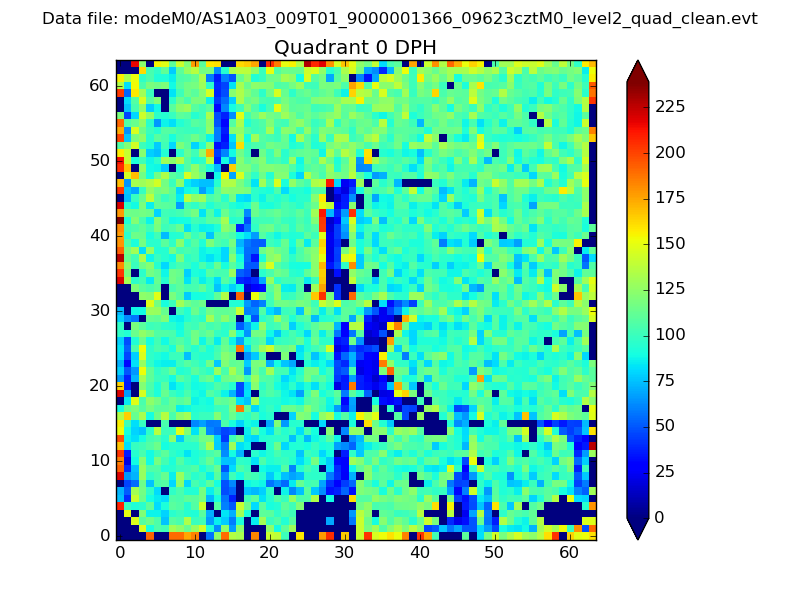 |
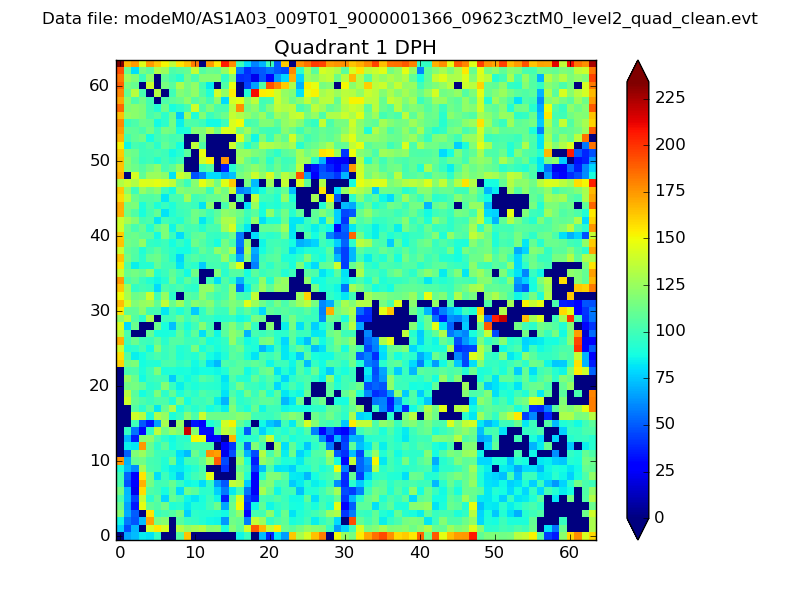 |
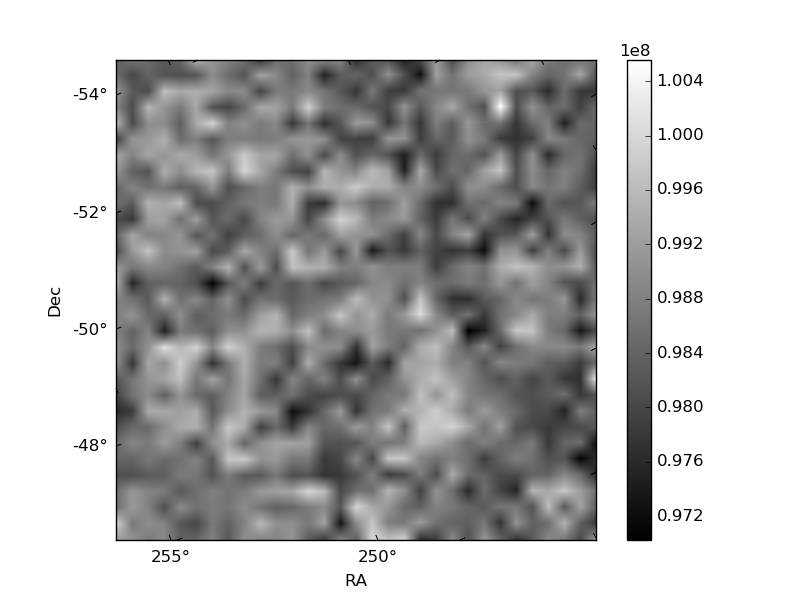
Quadrant B |
|---|---|---|---|
| Quadrant D | 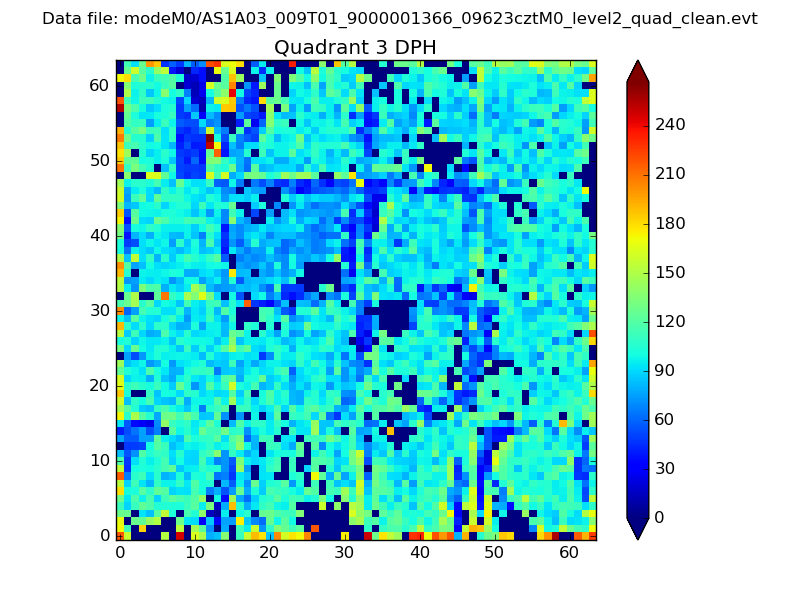 |
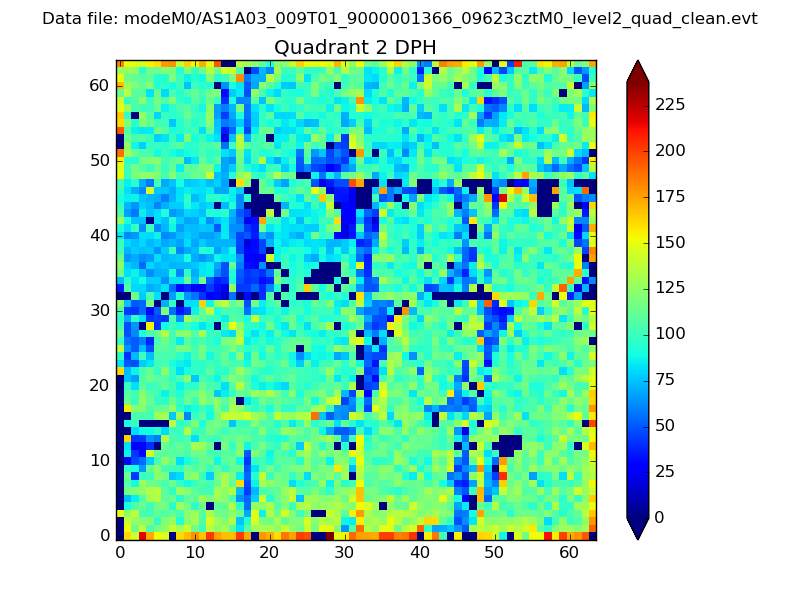 |
Quadrant C |
| Plot type | Count rate plots | Images |
|---|---|---|
| Comparison with Poisson distribution Blue bars denote a histogram of data divided into 1 sec bins. Red curve is a Poisson curve with rate = median count rate of data. |
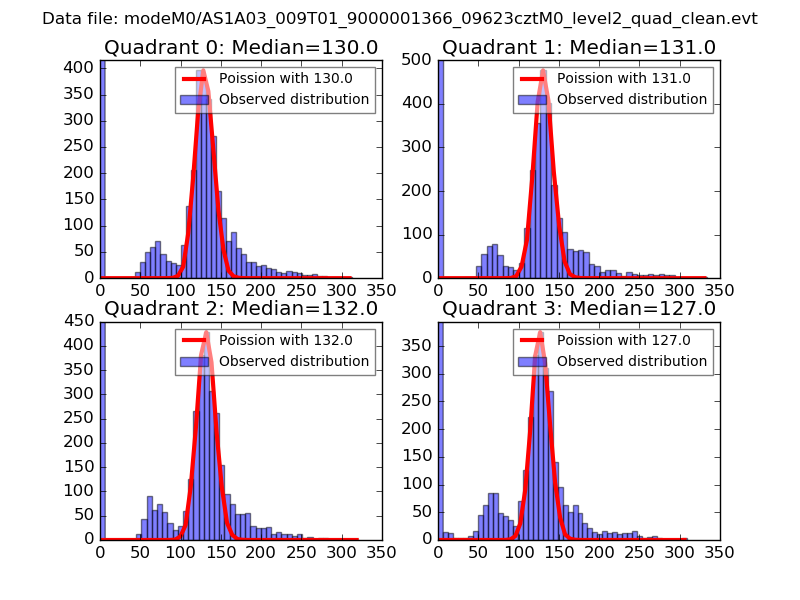 |
 |
| Quadrant-wise count rates Data is divided into 100 sec bins |
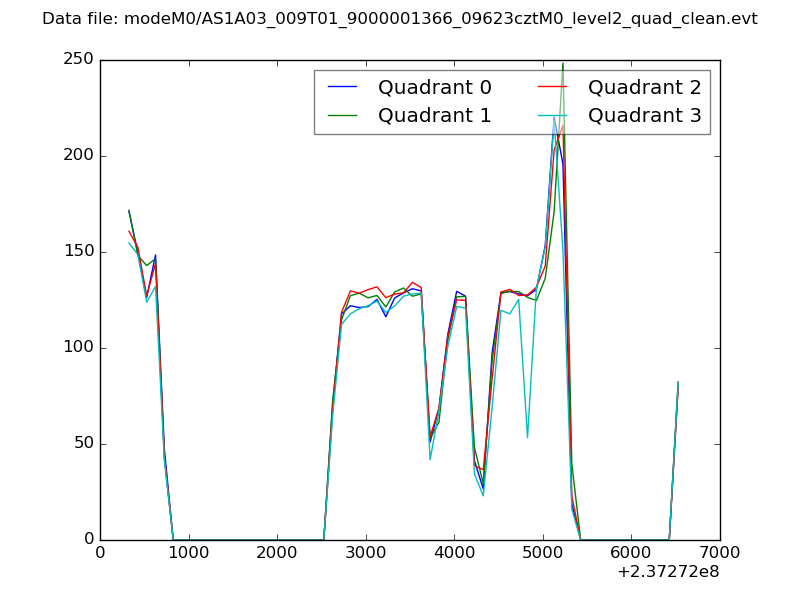 |
|
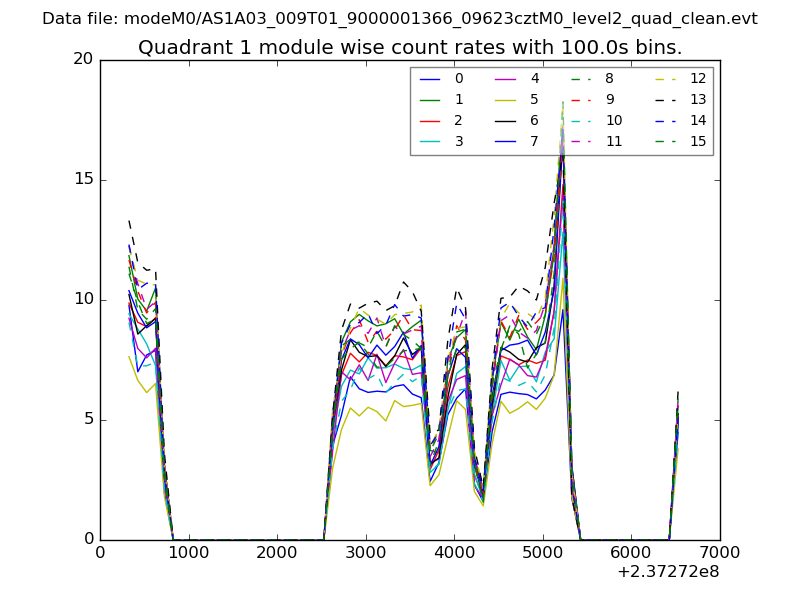
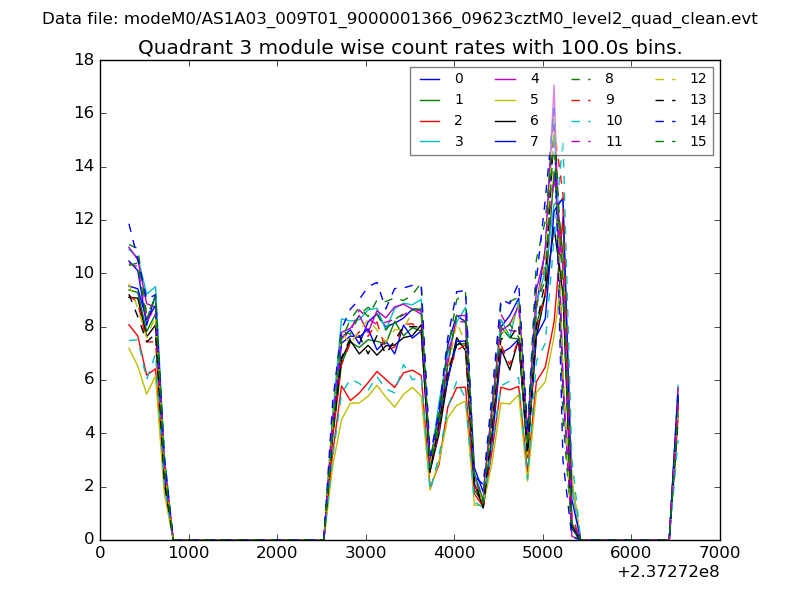
| Module-wise count rates for Quadrant A Data is divided into 100 sec bins |
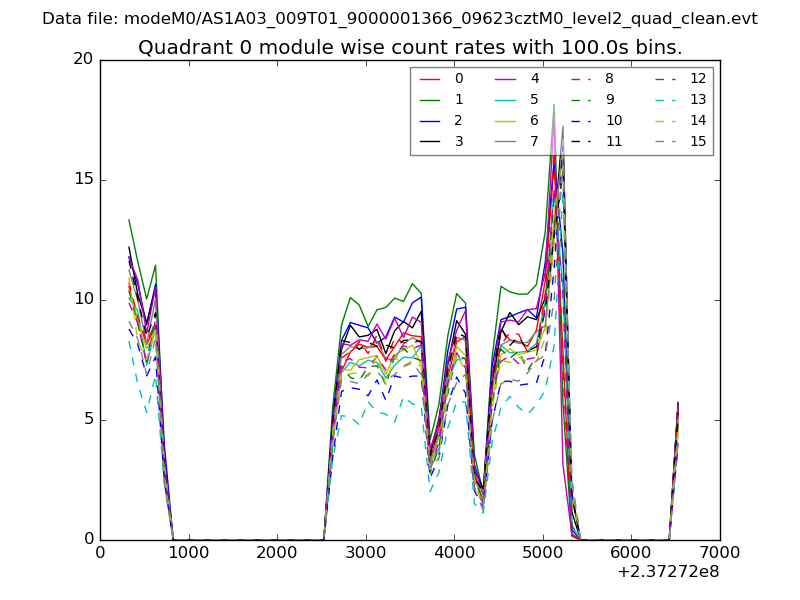 |
 |
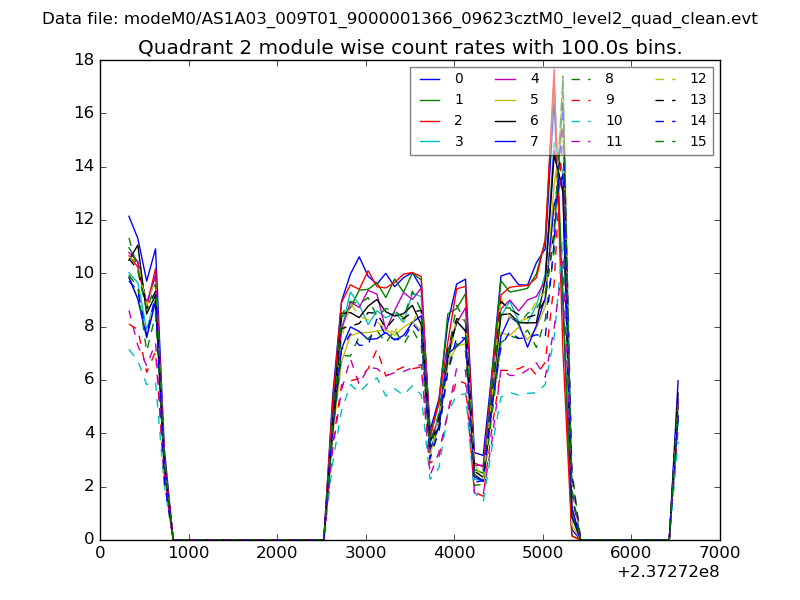
| Module-wise count rates for Quadrant B Data is divided into 100 sec bins |
 |
 |
| Module-wise count rates for Quadrant C Data is divided into 100 sec bins |
 |
 |
| Module-wise count rates for Quadrant D Data is divided into 100 sec bins |
 |
 |
| Parameter | Plot |
|---|---|
| CZT HV Monitor | 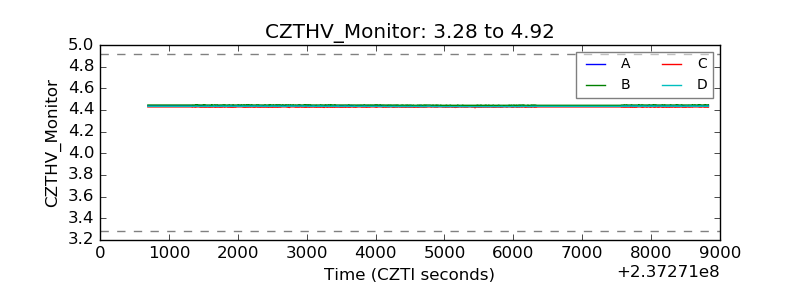 |
| D_VDD | 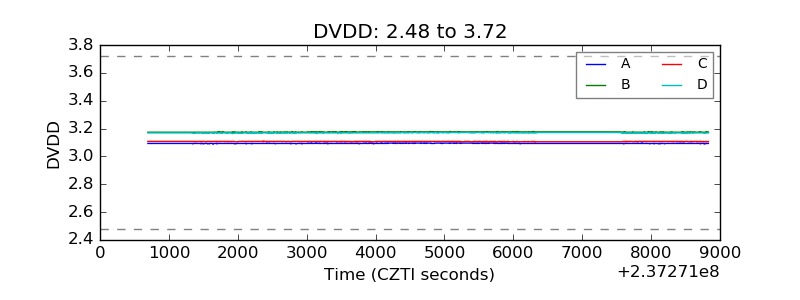 |
| Temperature 1 | 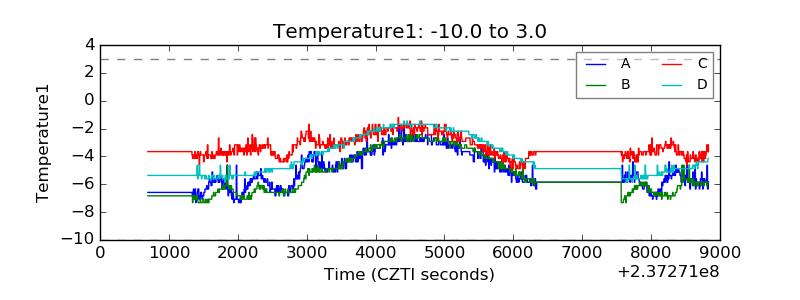 |
| Veto HV Monitor | 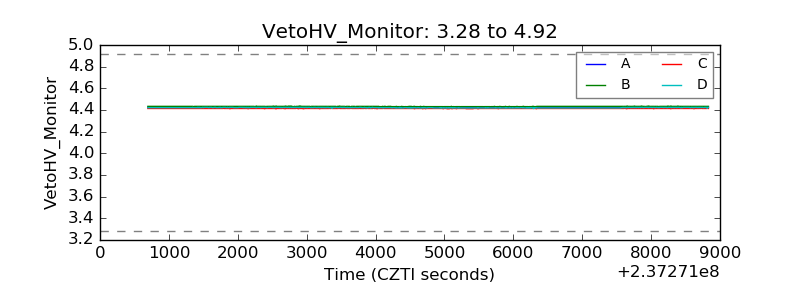 |
| Veto LLD | 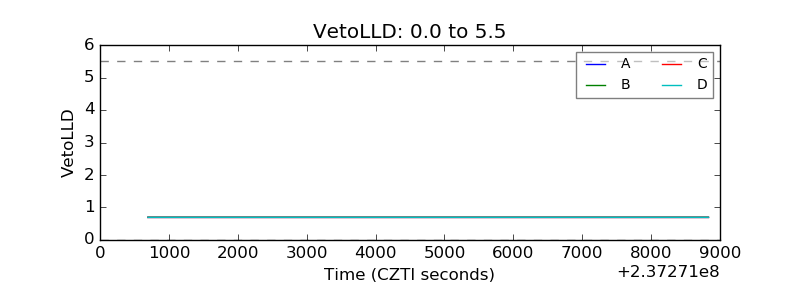 |
| Alpha Counter | 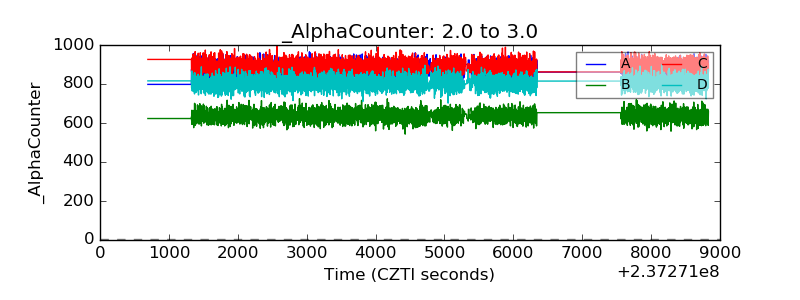 |
| _CPM_Rate | 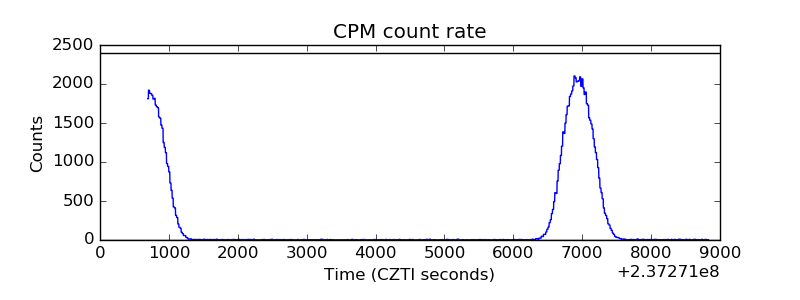 |
| CZT Counter | 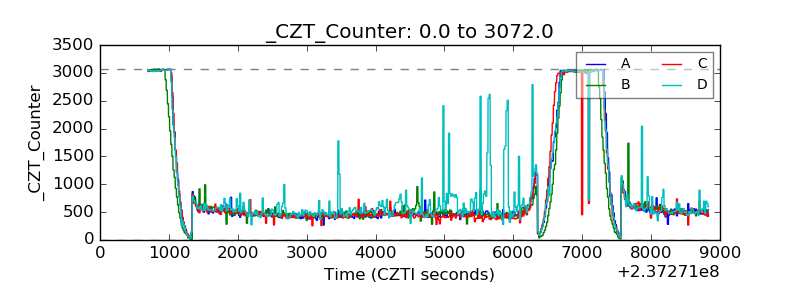 |
| +2.5 Volts monitor | 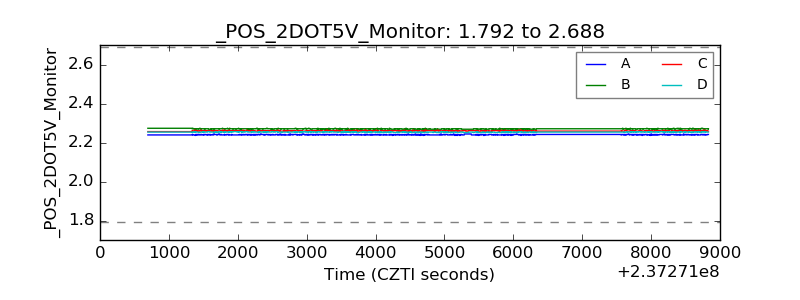 |
| +5 Volts monitor | 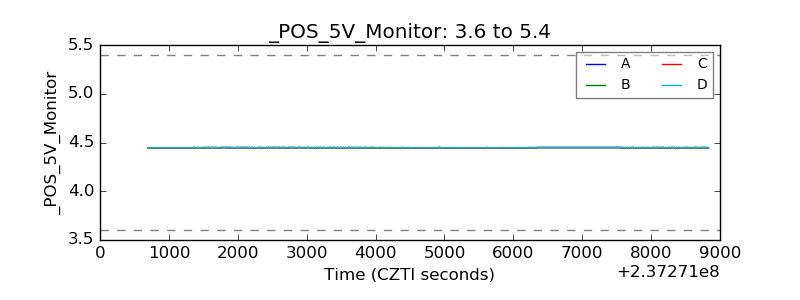 |
| _ROLL_ROT | 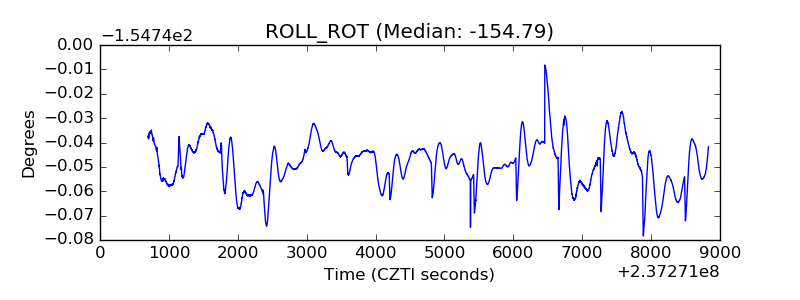 |
| _Roll_DEC | 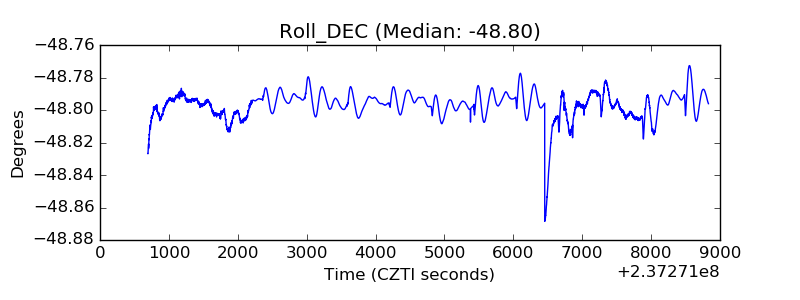 |
| _Roll_RA | 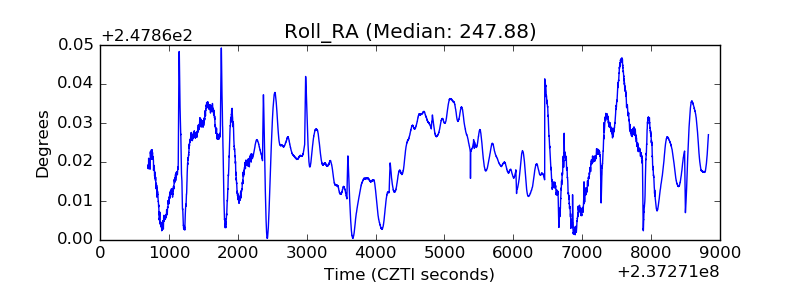 |
| Veto Counter | 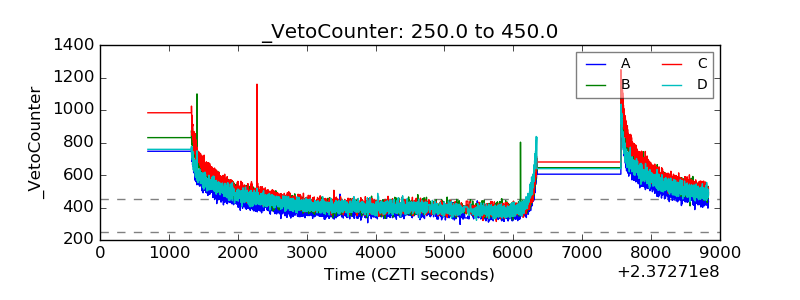 |