| Param | Original file | Final file |
|---|---|---|
| Filename | modeM0/AS1A03_033T01_9000001368cztM0_level2.fits | modeM0/AS1A03_033T01_9000001368cztM0_level2_quad_clean.evt |
| Size (bytes) | 238,593,600 | 214,493,760 |
| Size | 227.5 MB | 204.6 MB |
| Events in quadrant A | 1,470,862 | 1,277,127 |
| Events in quadrant B | 1,412,916 | 1,254,934 |
| Events in quadrant C | 1,431,884 | 1,177,183 |
| Events in quadrant D | 1,218,864 | 1,095,951 |
| Mode SS | |||
|---|---|---|---|
| Quadrant | BADHDUFLAG | Total packets | Discarded packets |
| A | 0 | 498 | 0 |
| B | 0 | 502 | 0 |
| C | 0 | 502 | 0 |
| D | 0 | 500 | 0 |
| Mode M9 | |||
|---|---|---|---|
| Quadrant | BADHDUFLAG | Total packets | Discarded packets |
| A | 0 | 51 | 0 |
| B | 0 | 49 | 0 |
| C | 0 | 51 | 0 |
| D | 0 | 51 | 0 |
| Mode M0 | |||
|---|---|---|---|
| Quadrant | BADHDUFLAG | Total packets | Discarded packets |
| A | 0 | 52620 | 0 |
| B | 0 | 51698 | 0 |
| C | 0 | 50830 | 0 |
| D | 0 | 67717 | 0 |
| Quadrant | Total seconds | Saturated seconds | Saturation percentage |
|---|---|---|---|
| A | 24588 | 679 | 2.761510% |
| B | 24571 | 518 | 2.108176% |
| C | 24578 | 398 | 1.619334% |
| D | 24513 | 1585 | 6.465957% |
Noise dominated data is calculated using 1-second bins in cleaned event files. If a bin has >2000 counts, and if more than 50% of those come from <1% of pixels, then it is considered to be noise-dominated and hence unusable.
| Quadrant | # 1 sec bins | Bins with >0 counts | Bins with >2000 counts | High rate bins dominated by noise | Noise dominated (total time) | Noise dominated (detector-on time) | Marked lightcurve |
|---|---|---|---|---|---|---|---|
| A | 29152 | 24858 | 0 | 0 | 0.00% | 0.00% |  |
| B | 29152 | 24860 | 0 | 0 | 0.00% | 0.00% |  |
| C | 29152 | 24858 | 0 | 0 | 0.00% | 0.00% | 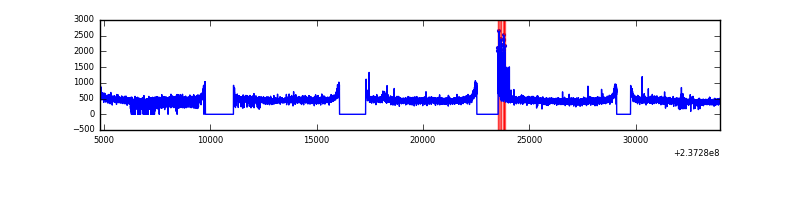 |
| D | 29152 | 24712 | 0 | 0 | 0.00% | 0.00% | 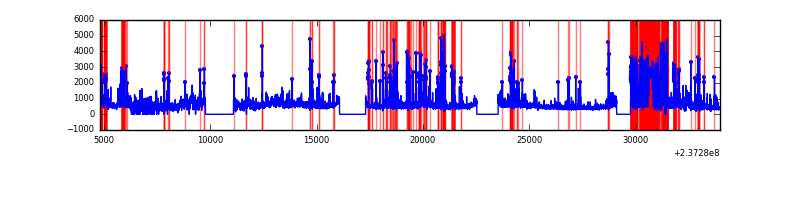 |
Top three noisy pixels from each quadrant. If the there are fewer than three noisy pixels in the level2.evt file, extra rows are filled as -1
| Pixel properties | Quadrant properties | ||||||
|---|---|---|---|---|---|---|---|
| Quadrant | DetID | PixID | Counts | Sigma | Mean | Median | Sigma |
| A | 0 | 29 | 1486 | 11.79 | 382 | 361 | 95.5 |
| A | 7 | 110 | 1224 | 9.04 | 382 | 361 | 95.5 |
| A | 9 | 19 | 1153 | 8.3 | 382 | 361 | 95.5 |
| B | 2 | 9 | 1213 | 11.49 | 373 | 357 | 74.5 |
| B | 3 | 17 | 970 | 8.23 | 373 | 357 | 74.5 |
| B | 3 | 80 | 947 | 7.92 | 373 | 357 | 74.5 |
| C | 1 | 81 | 1091 | 7.46 | 378 | 353 | 98.9 |
| C | 1 | 80 | 1058 | 7.13 | 378 | 353 | 98.9 |
| C | 12 | 241 | 969 | 6.23 | 378 | 353 | 98.9 |
| D | 6 | 231 | 900 | 6.29 | 347 | 317 | 92.6 |
| D | 3 | 14 | 883 | 6.11 | 347 | 317 | 92.6 |
| D | 10 | 113 | 851 | 5.76 | 347 | 317 | 92.6 |
Histogram calculated using DETX and DETY for each event in the final _common_clean file
| Quadrant A | 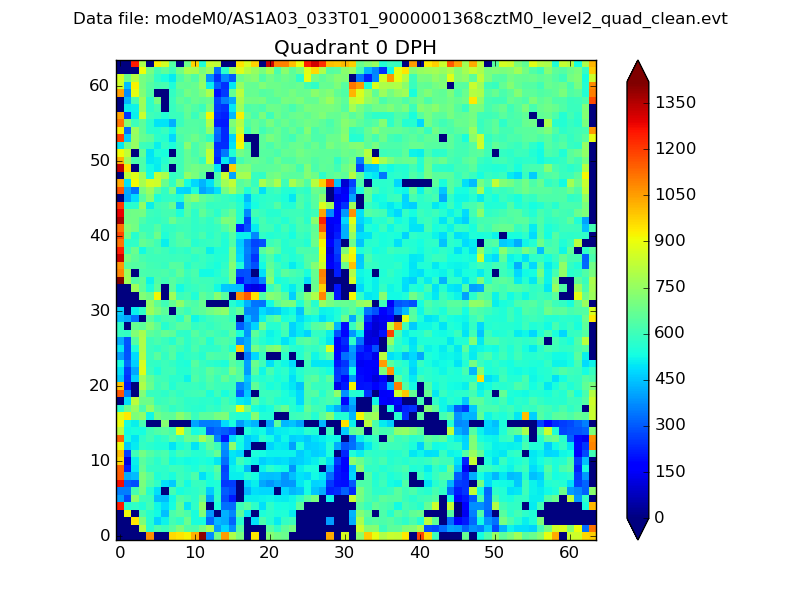 |
 |
Quadrant B |
|---|---|---|---|
| Quadrant D |  |
 |
Quadrant C |
| Plot type | Count rate plots | Images |
|---|---|---|
| Comparison with Poisson distribution Blue bars denote a histogram of data divided into 1 sec bins. Red curve is a Poisson curve with rate = median count rate of data. |
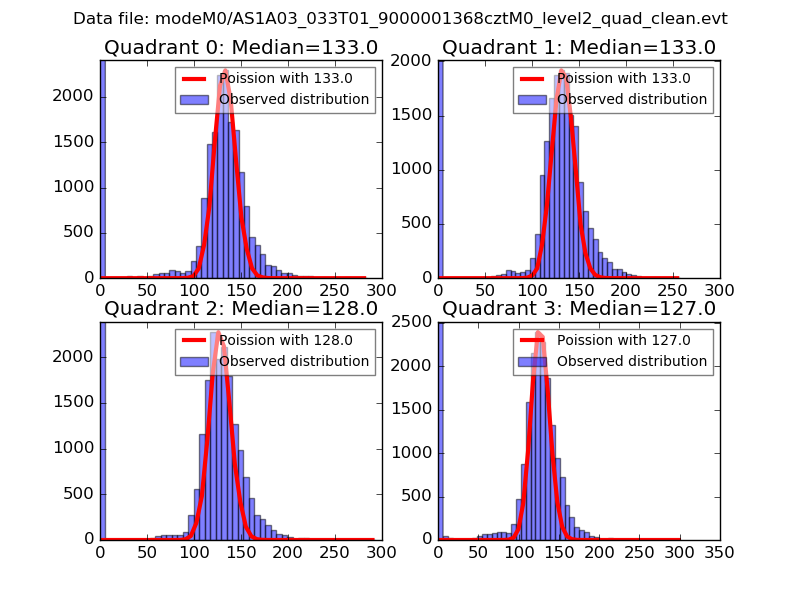 |
 |
| Quadrant-wise count rates Data is divided into 100 sec bins |
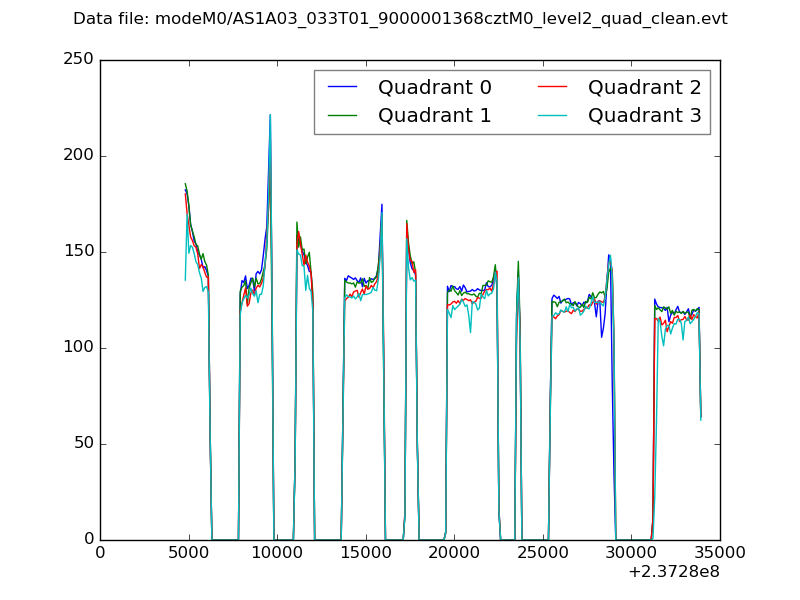 |
|
| Module-wise count rates for Quadrant A Data is divided into 100 sec bins |
 |
 |
| Module-wise count rates for Quadrant B Data is divided into 100 sec bins |
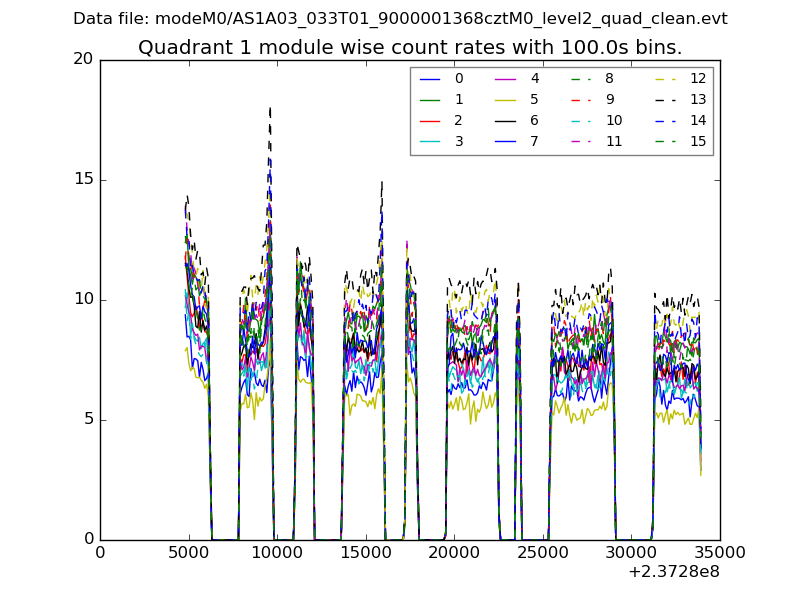 |
 |
| Module-wise count rates for Quadrant C Data is divided into 100 sec bins |
 |
 |
| Module-wise count rates for Quadrant D Data is divided into 100 sec bins |
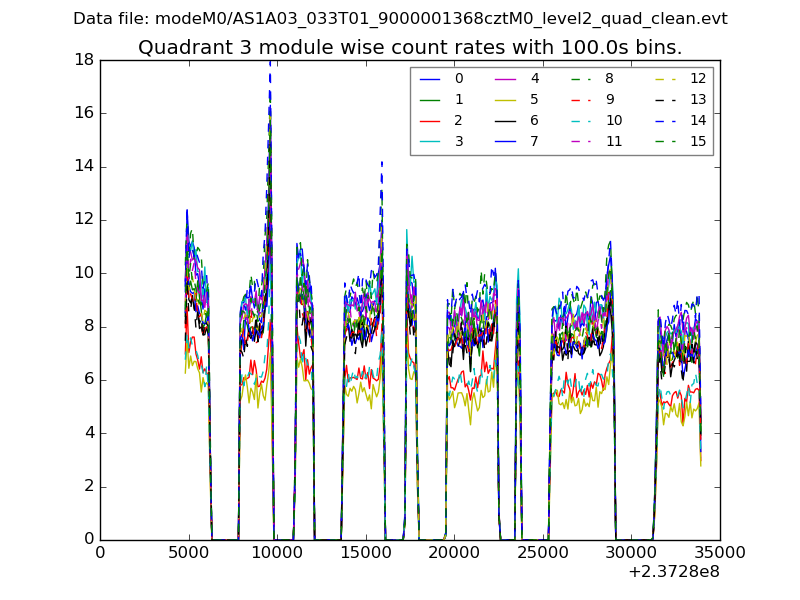 |
 |
| Parameter | Plot |
|---|---|
| CZT HV Monitor |  |
| D_VDD | 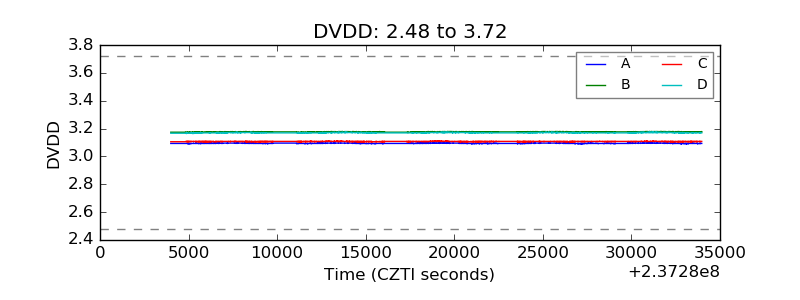 |
| Temperature 1 |  |
| Veto HV Monitor |  |
| Veto LLD | 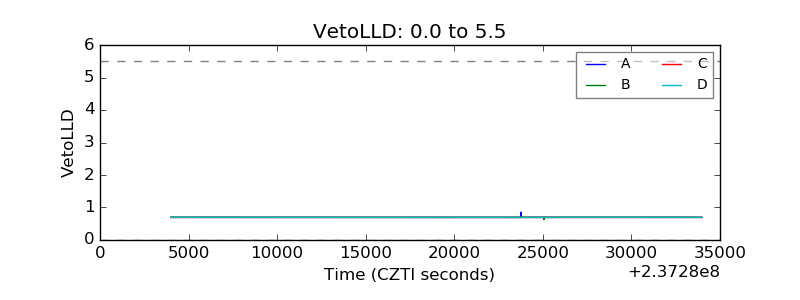 |
| Alpha Counter | 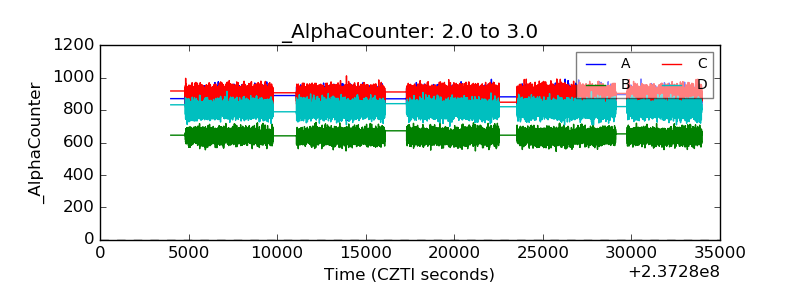 |
| _CPM_Rate |  |
| CZT Counter |  |
| +2.5 Volts monitor | 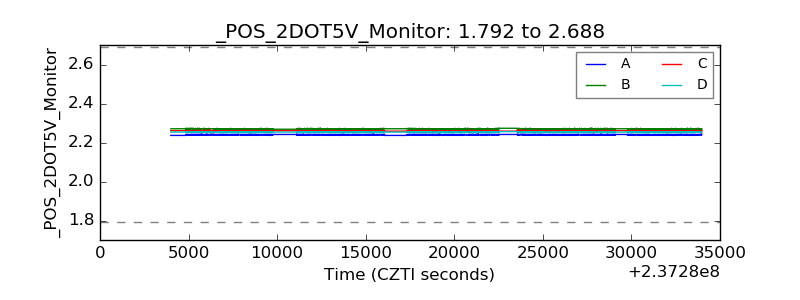 |
| +5 Volts monitor |  |
| _ROLL_ROT |  |
| _Roll_DEC |  |
| _Roll_RA |  |
| Veto Counter |  |