| Param | Original file | Final file |
|---|---|---|
| Filename | modeM0/AS1A03_033T01_9000001368_09625cztM0_level2.evt | modeM0/AS1A03_033T01_9000001368_09625cztM0_level2_quad_clean.evt |
| Size (bytes) | 375,894,720 | 80,628,480 |
| Size | 358.5 MB | 76.9 MB |
| Events in quadrant A | 2,596,629 | 537,657 |
| Events in quadrant B | 2,640,553 | 526,854 |
| Events in quadrant C | 2,473,617 | 519,905 |
| Events in quadrant D | 3,320,499 | 494,847 |
| Mode SS | |||
|---|---|---|---|
| Quadrant | BADHDUFLAG | Total packets | Discarded packets |
| A | 0 | 118 | 12 |
| B | 0 | 118 | 12 |
| C | 0 | 118 | 4 |
| D | 0 | 118 | 10 |
| Mode M9 | |||
|---|---|---|---|
| Quadrant | BADHDUFLAG | Total packets | Discarded packets |
| A | 0 | 13 | 0 |
| B | 0 | 13 | 2 |
| C | 0 | 13 | 0 |
| D | 0 | 13 | 0 |
| Mode M0 | |||
|---|---|---|---|
| Quadrant | BADHDUFLAG | Total packets | Discarded packets |
| A | 0 | 12068 | 1324 |
| B | 0 | 12250 | 1405 |
| C | 0 | 11950 | 1293 |
| D | 0 | 15666 | 2460 |
| Quadrant | Total seconds | Saturated seconds | Saturation percentage |
|---|---|---|---|
| A | 5199 | 64 | 1.231006% |
| B | 5166 | 72 | 1.393728% |
| C | 5207 | 44 | 0.845016% |
| D | 5043 | 84 | 1.665675% |
Noise dominated data is calculated using 1-second bins in cleaned event files. If a bin has >2000 counts, and if more than 50% of those come from <1% of pixels, then it is considered to be noise-dominated and hence unusable.
| Quadrant | # 1 sec bins | Bins with >0 counts | Bins with >2000 counts | High rate bins dominated by noise | Noise dominated (total time) | Noise dominated (detector-on time) | Marked lightcurve |
|---|---|---|---|---|---|---|---|
| A | 7172 | 5645 | 0 | 0 | 0.00% | 0.00% | 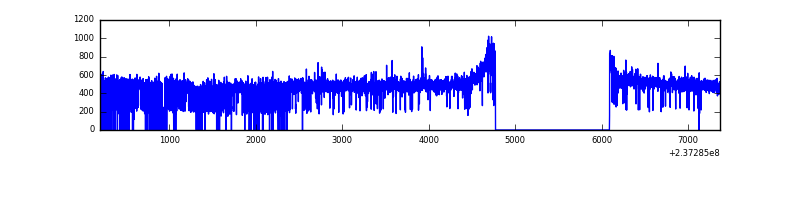 |
| B | 7172 | 5634 | 1 | 1 | 0.01% | 0.02% | 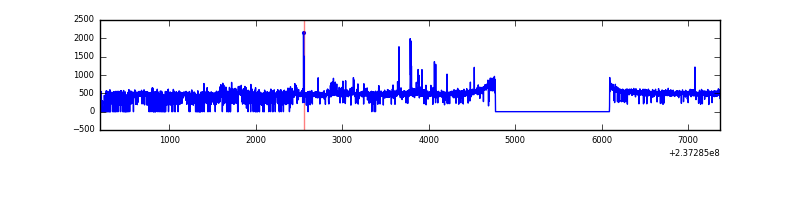 |
| C | 7172 | 5638 | 0 | 0 | 0.00% | 0.00% | 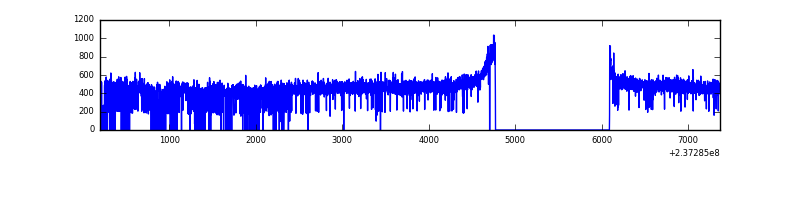 |
| D | 7171 | 5536 | 16 | 16 | 0.22% | 0.29% | 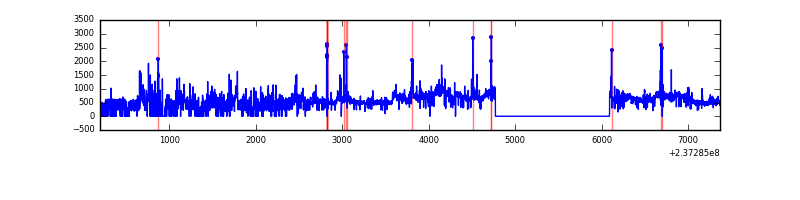 |
Top three noisy pixels from each quadrant. If the there are fewer than three noisy pixels in the level2.evt file, extra rows are filled as -1
| Pixel properties | Quadrant properties | ||||||
|---|---|---|---|---|---|---|---|
| Quadrant | DetID | PixID | Counts | Sigma | Mean | Median | Sigma |
| A | 3 | 1 | 31264 | 225.86 | 667 | 656 | 135.5 |
| A | 0 | 226 | 6262 | 41.37 | 667 | 656 | 135.5 |
| A | 12 | 194 | 5513 | 35.84 | 667 | 656 | 135.5 |
| B | 0 | 214 | 47212 | 379.33 | 655 | 642 | 122.8 |
| B | 0 | 229 | 28972 | 230.76 | 655 | 642 | 122.8 |
| B | 10 | 245 | 14913 | 116.24 | 655 | 642 | 122.8 |
| C | 10 | 22 | 5083 | 30.66 | 632 | 637 | 145.0 |
| C | 13 | 61 | 4761 | 28.44 | 632 | 637 | 145.0 |
| C | 14 | 67 | 1710 | 7.4 | 632 | 637 | 145.0 |
| D | 8 | 195 | 536859 | 3612.64 | 622 | 609 | 148.4 |
| D | 1 | 52 | 217171 | 1458.95 | 622 | 609 | 148.4 |
| D | 10 | 172 | 70580 | 471.38 | 622 | 609 | 148.4 |
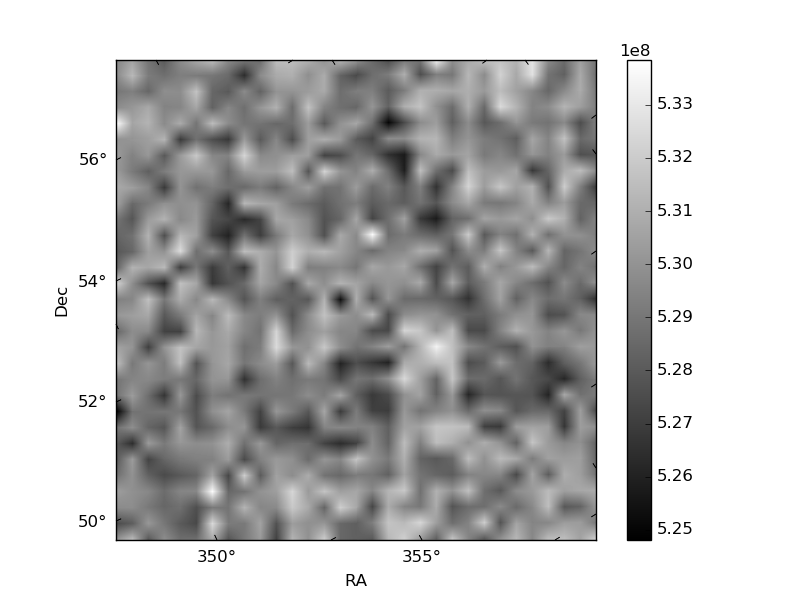
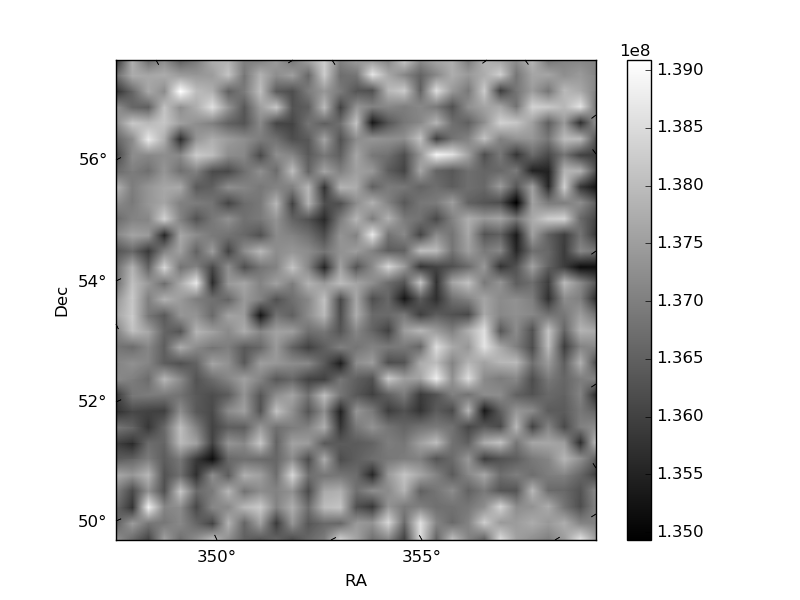
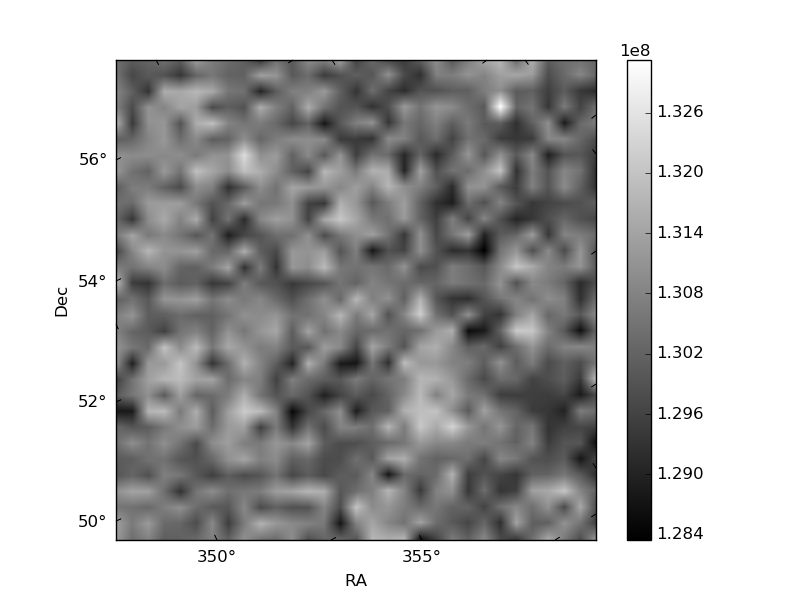
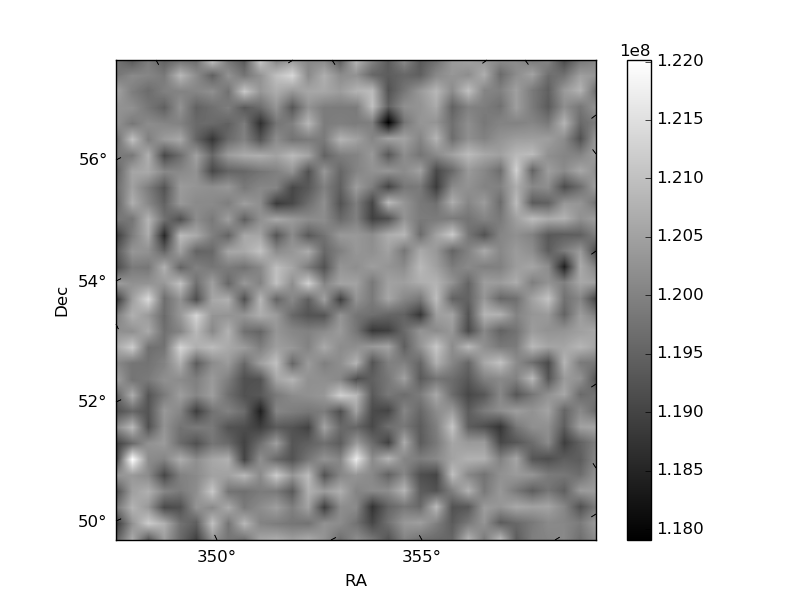
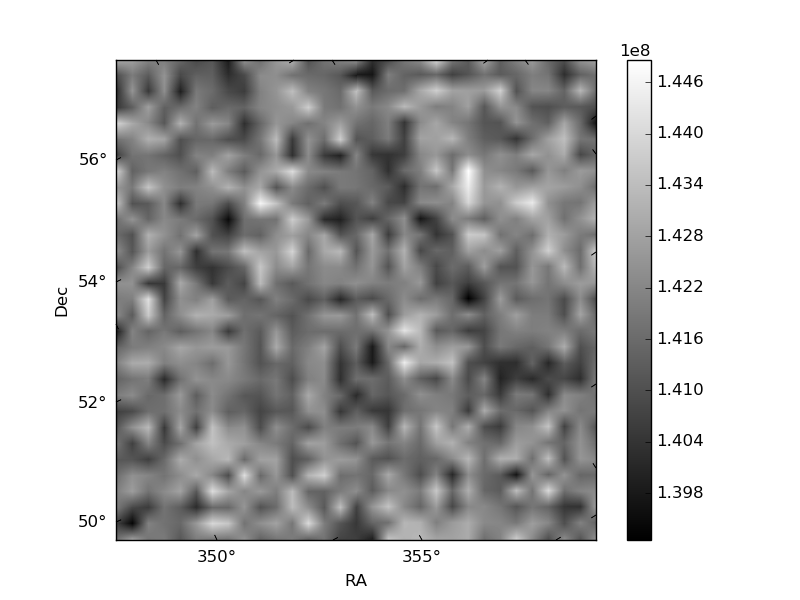
Histogram calculated using DETX and DETY for each event in the final _common_clean file
| Quadrant A | 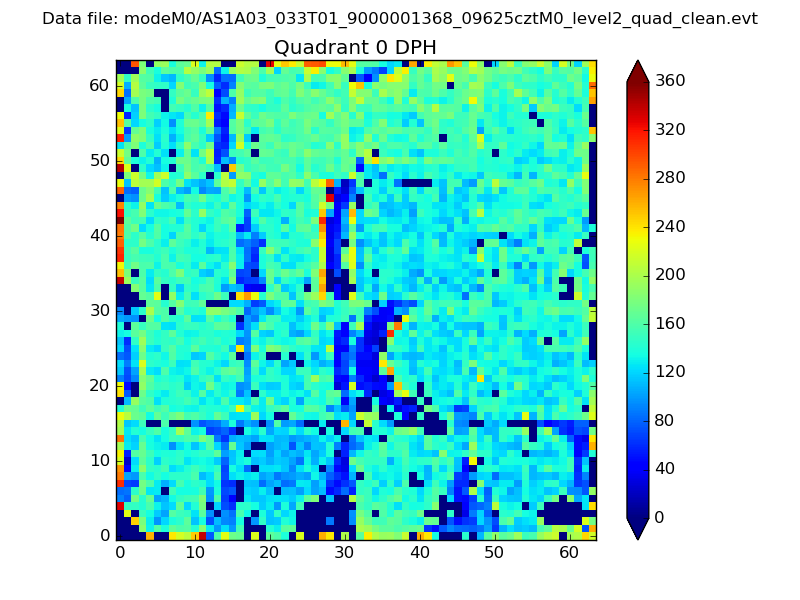 |
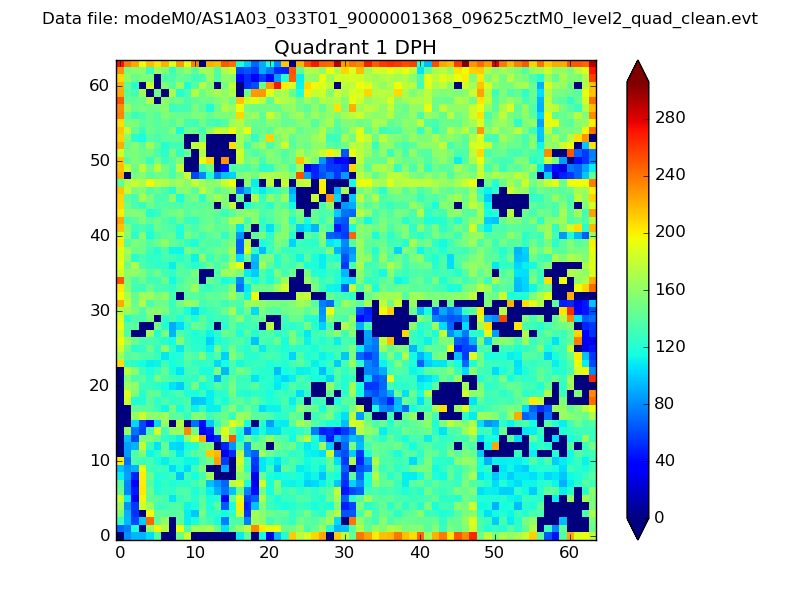 |
Quadrant B |
|---|---|---|---|
| Quadrant D | 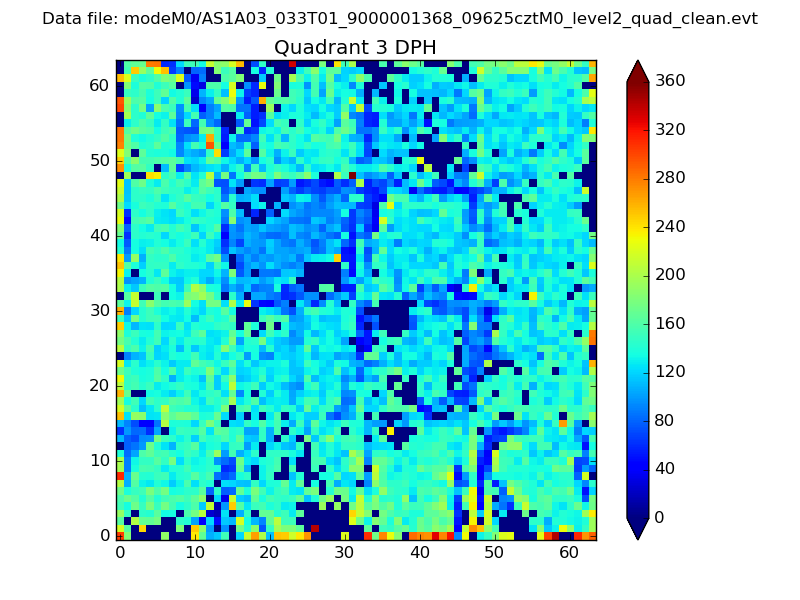 |
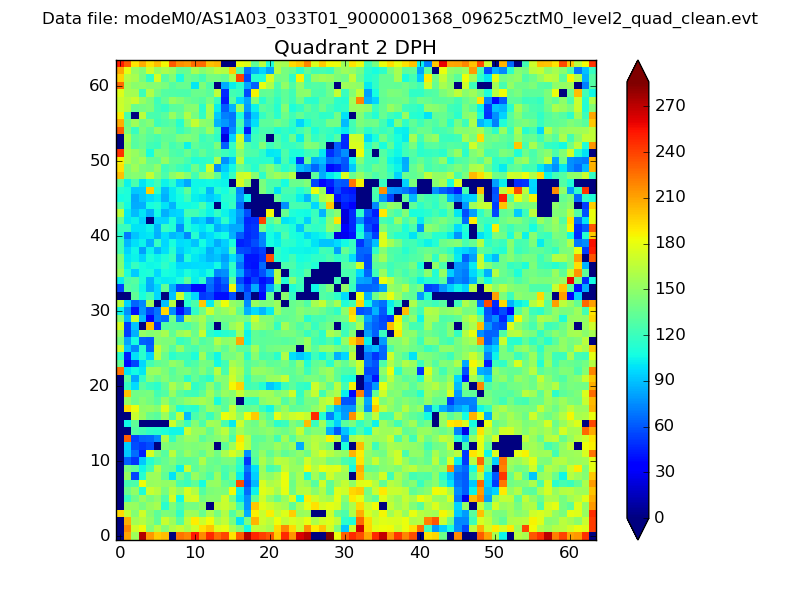 |
Quadrant C |
| Plot type | Count rate plots | Images |
|---|---|---|
| Comparison with Poisson distribution Blue bars denote a histogram of data divided into 1 sec bins. Red curve is a Poisson curve with rate = median count rate of data. |
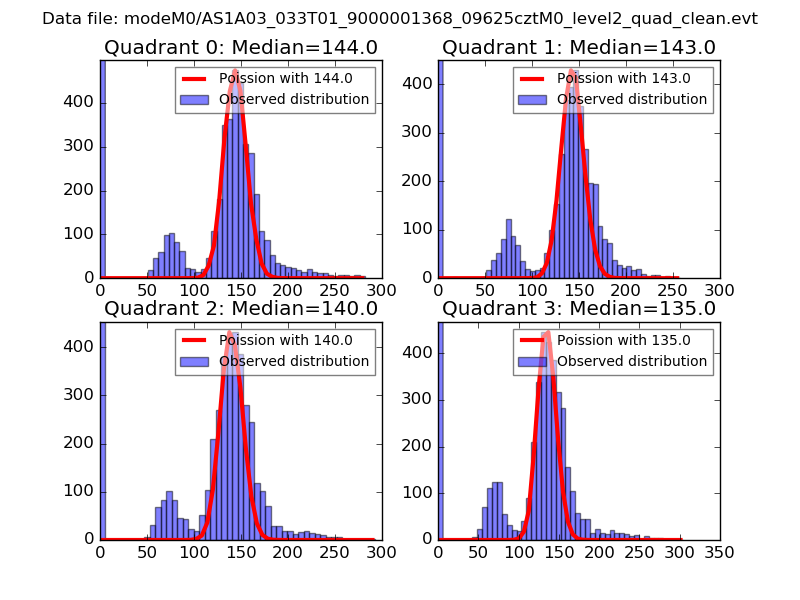 |
 |
| Quadrant-wise count rates Data is divided into 100 sec bins |
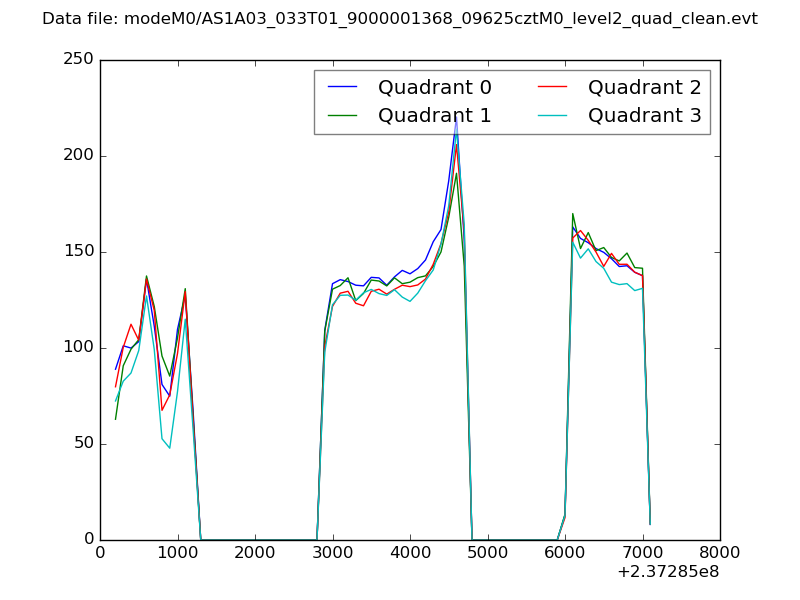 |
|
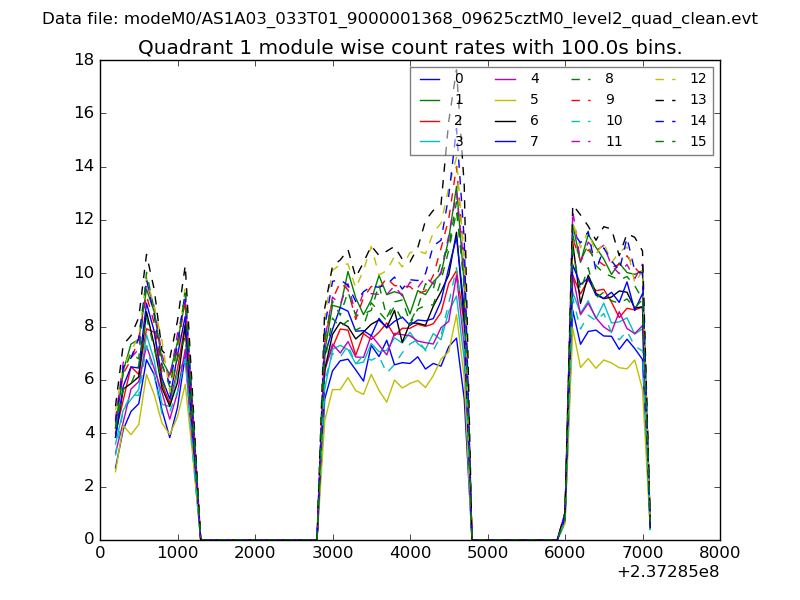
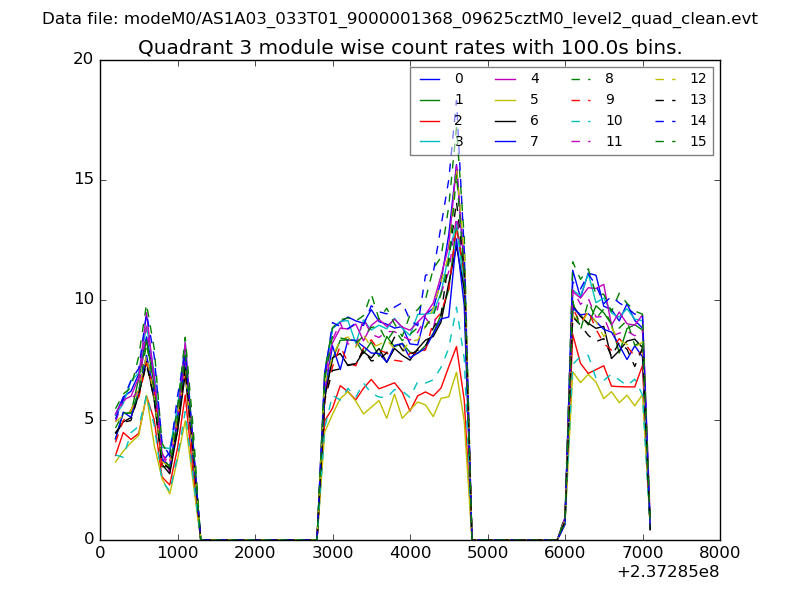
| Module-wise count rates for Quadrant A Data is divided into 100 sec bins |
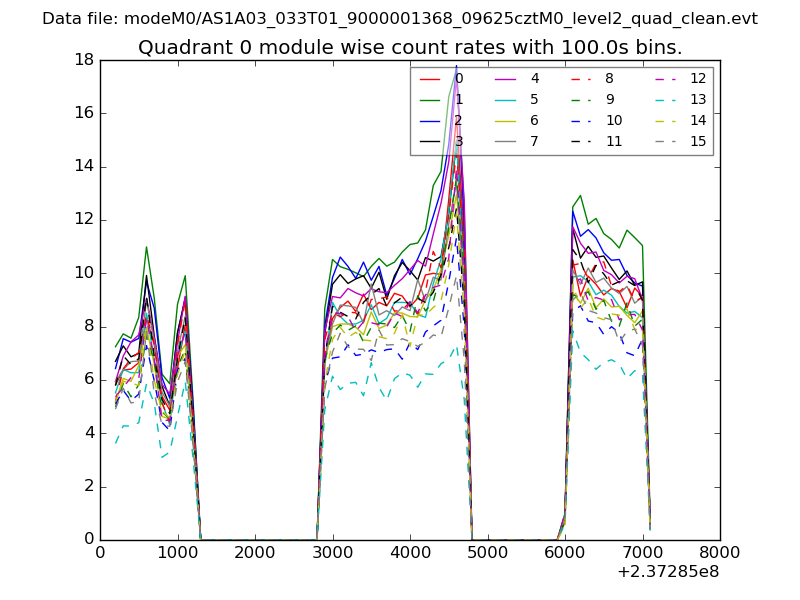 |
 |
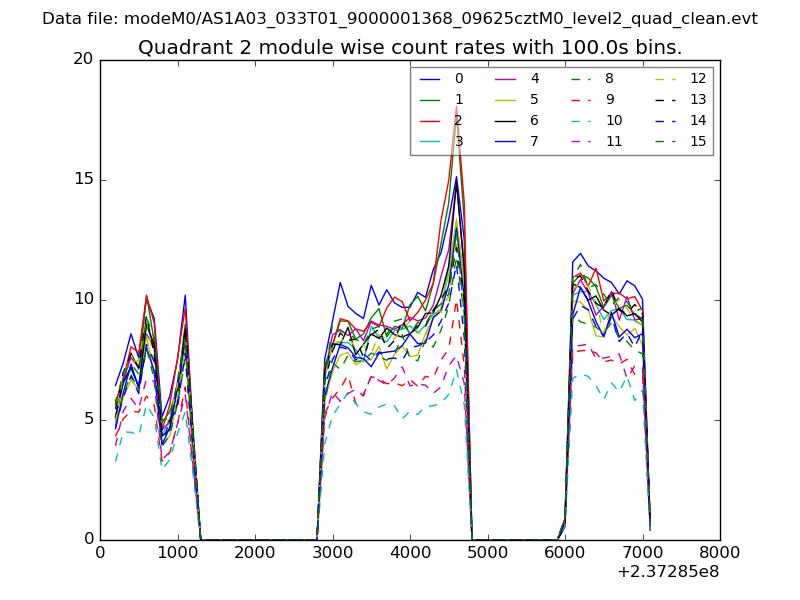
| Module-wise count rates for Quadrant B Data is divided into 100 sec bins |
 |
 |
| Module-wise count rates for Quadrant C Data is divided into 100 sec bins |
 |
 |
| Module-wise count rates for Quadrant D Data is divided into 100 sec bins |
 |
 |
| Parameter | Plot |
|---|---|
| CZT HV Monitor | 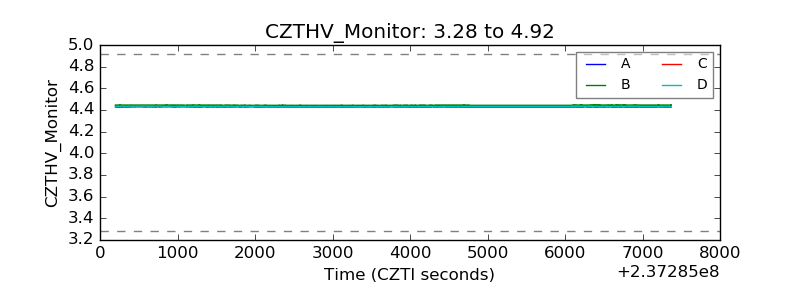 |
| D_VDD | 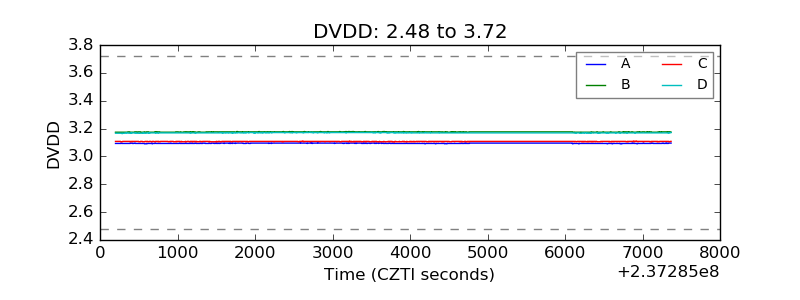 |
| Temperature 1 | 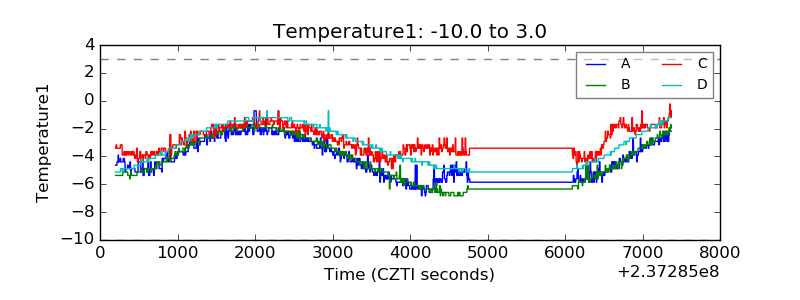 |
| Veto HV Monitor | 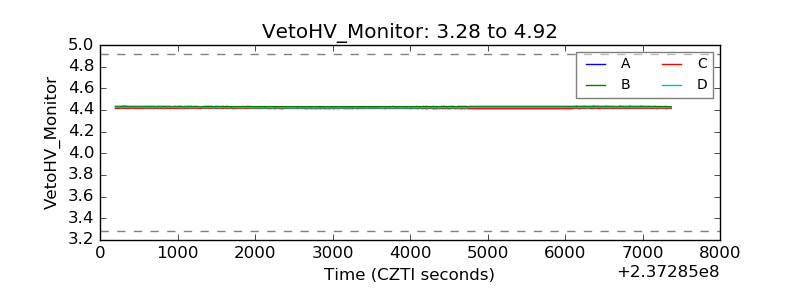 |
| Veto LLD | 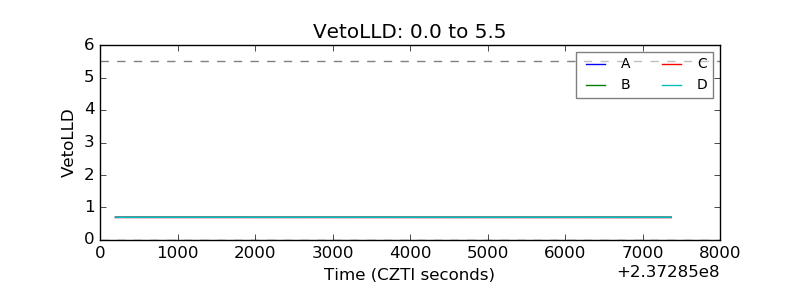 |
| Alpha Counter | 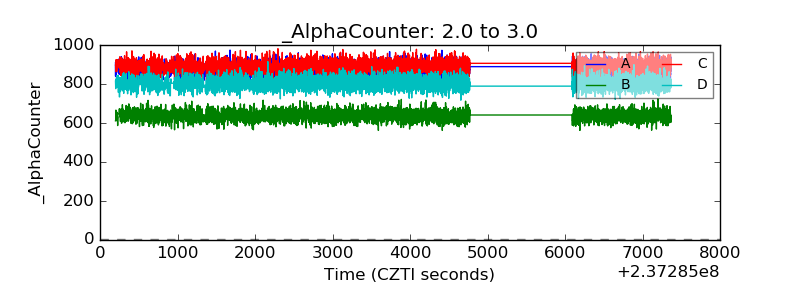 |
| _CPM_Rate | 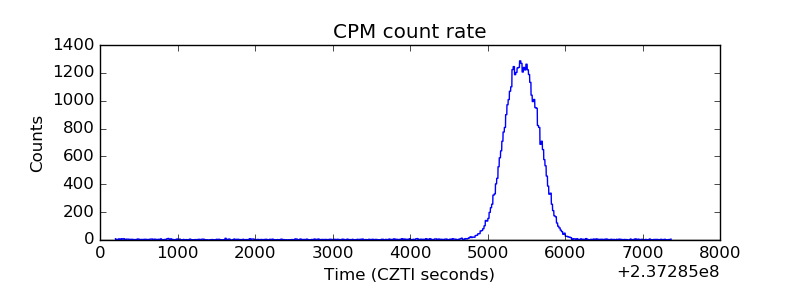 |
| CZT Counter | 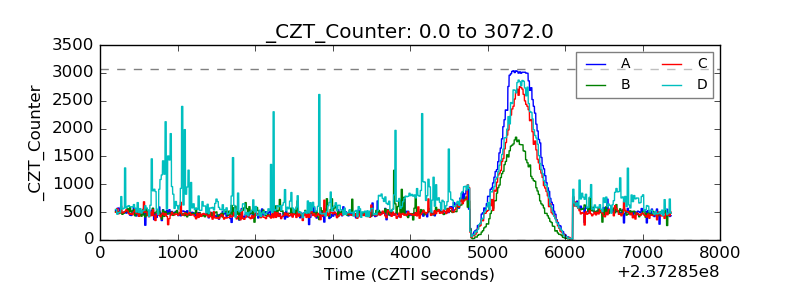 |
| +2.5 Volts monitor |  |
| +5 Volts monitor |  |
| _ROLL_ROT | 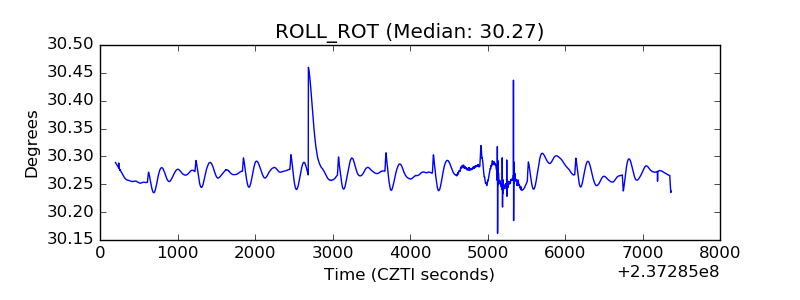 |
| _Roll_DEC | 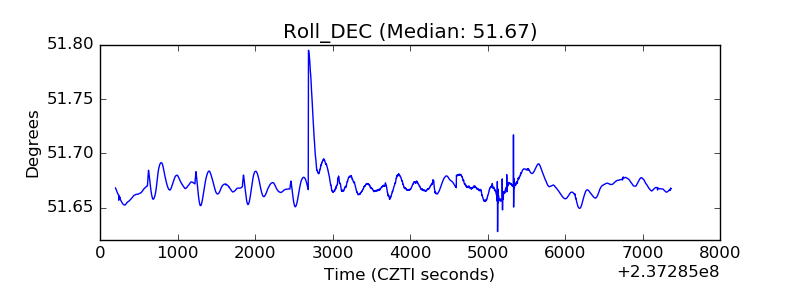 |
| _Roll_RA | 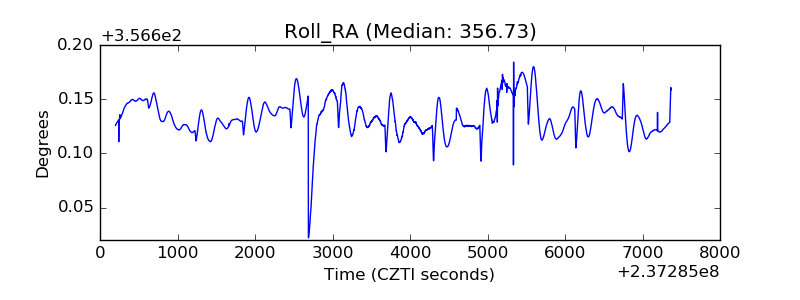 |
| Veto Counter | 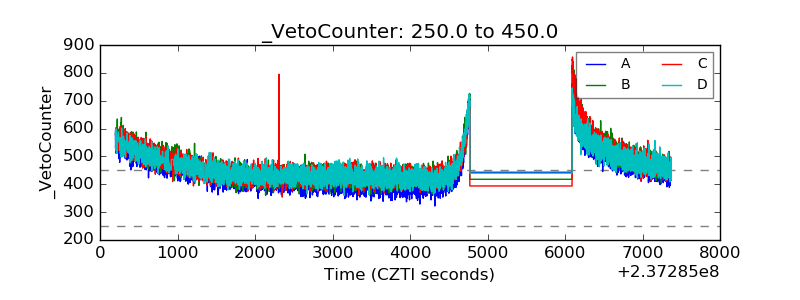 |