| Param | Original file | Final file |
|---|---|---|
| Filename | modeM0/AS1A03_033T01_9000001368_09626cztM0_level2.evt | modeM0/AS1A03_033T01_9000001368_09626cztM0_level2_quad_clean.evt |
| Size (bytes) | 755,827,200 | 139,043,520 |
| Size | 720.8 MB | 132.6 MB |
| Events in quadrant A | 5,217,430 | 895,319 |
| Events in quadrant B | 5,293,734 | 882,451 |
| Events in quadrant C | 4,917,347 | 864,988 |
| Events in quadrant D | 6,757,184 | 847,383 |
| Mode SS | |||
|---|---|---|---|
| Quadrant | BADHDUFLAG | Total packets | Discarded packets |
| A | 0 | 212 | 0 |
| B | 0 | 212 | 0 |
| C | 0 | 212 | 0 |
| D | 0 | 212 | 0 |
| Mode M9 | |||
|---|---|---|---|
| Quadrant | BADHDUFLAG | Total packets | Discarded packets |
| A | 0 | 26 | 0 |
| B | 0 | 26 | 0 |
| C | 0 | 26 | 0 |
| D | 0 | 26 | 0 |
| Mode M0 | |||
|---|---|---|---|
| Quadrant | BADHDUFLAG | Total packets | Discarded packets |
| A | 0 | 21777 | 3 |
| B | 0 | 21922 | 2 |
| C | 0 | 21360 | 2 |
| D | 0 | 27010 | 2 |
| Quadrant | Total seconds | Saturated seconds | Saturation percentage |
|---|---|---|---|
| A | 10406 | 184 | 1.768211% |
| B | 10406 | 199 | 1.912358% |
| C | 10406 | 121 | 1.162791% |
| D | 10406 | 238 | 2.287142% |
Noise dominated data is calculated using 1-second bins in cleaned event files. If a bin has >2000 counts, and if more than 50% of those come from <1% of pixels, then it is considered to be noise-dominated and hence unusable.
| Quadrant | # 1 sec bins | Bins with >0 counts | Bins with >2000 counts | High rate bins dominated by noise | Noise dominated (total time) | Noise dominated (detector-on time) | Marked lightcurve |
|---|---|---|---|---|---|---|---|
| A | 12956 | 10408 | 0 | 0 | 0.00% | 0.00% | 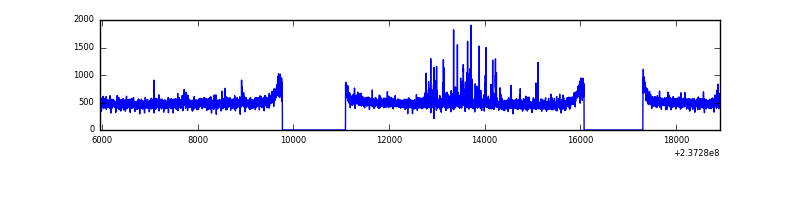 |
| B | 12956 | 10408 | 2 | 2 | 0.02% | 0.02% | 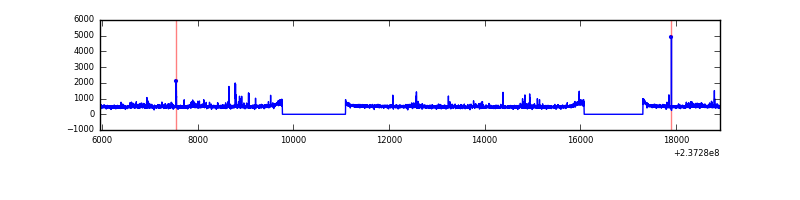 |
| C | 12956 | 10408 | 0 | 0 | 0.00% | 0.00% | 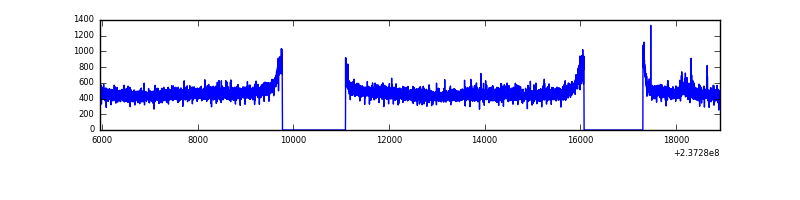 |
| D | 12956 | 10408 | 74 | 74 | 0.57% | 0.71% | 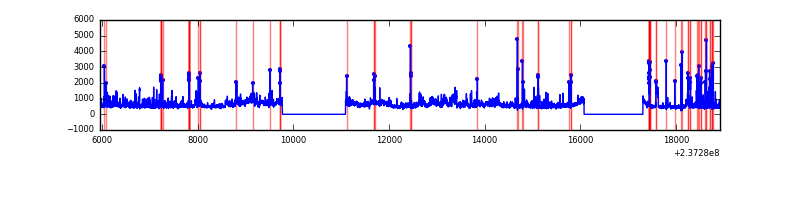 |
Top three noisy pixels from each quadrant. If the there are fewer than three noisy pixels in the level2.evt file, extra rows are filled as -1
| Pixel properties | Quadrant properties | ||||||
|---|---|---|---|---|---|---|---|
| Quadrant | DetID | PixID | Counts | Sigma | Mean | Median | Sigma |
| A | 1 | 162 | 50491 | 186.0 | 1320 | 1296 | 264.5 |
| A | 3 | 1 | 36585 | 133.42 | 1320 | 1296 | 264.5 |
| A | 1 | 178 | 22584 | 80.49 | 1320 | 1296 | 264.5 |
| B | 0 | 214 | 116398 | 477.88 | 1303 | 1277 | 240.9 |
| B | 0 | 229 | 48715 | 196.92 | 1303 | 1277 | 240.9 |
| B | 12 | 111 | 25246 | 99.5 | 1303 | 1277 | 240.9 |
| C | 9 | 237 | 17743 | 58.04 | 1253 | 1258 | 284.0 |
| C | 13 | 61 | 9524 | 29.1 | 1253 | 1258 | 284.0 |
| C | 10 | 22 | 6229 | 17.5 | 1253 | 1258 | 284.0 |
| D | 8 | 195 | 975789 | 3199.46 | 1266 | 1237 | 304.6 |
| D | 1 | 52 | 504629 | 1652.64 | 1266 | 1237 | 304.6 |
| D | 10 | 172 | 142392 | 463.41 | 1266 | 1237 | 304.6 |
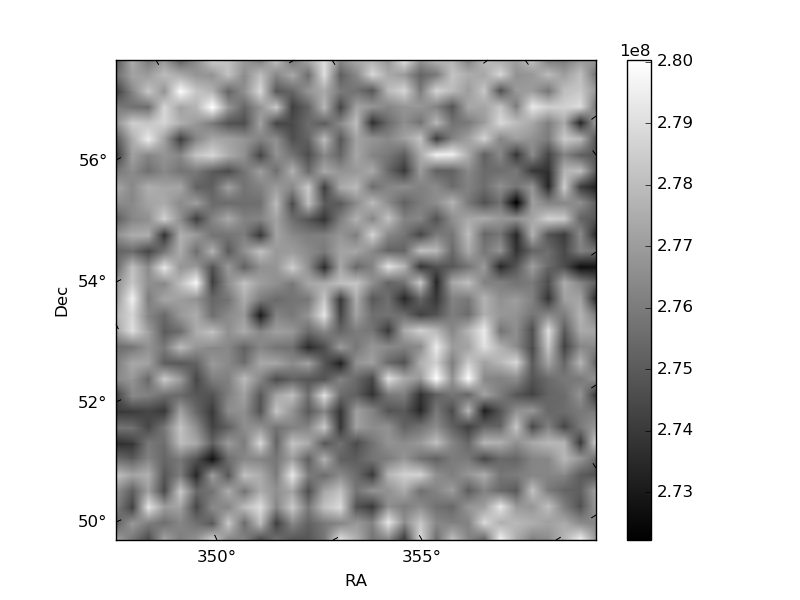
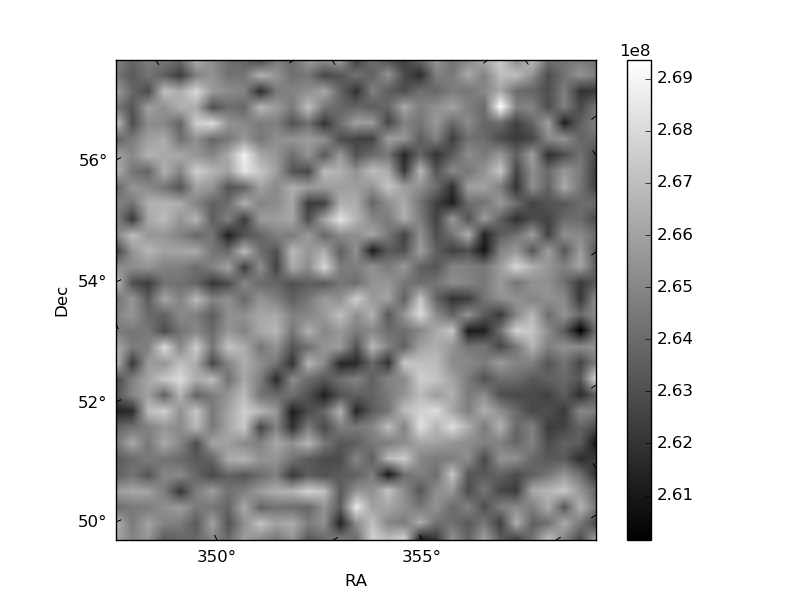
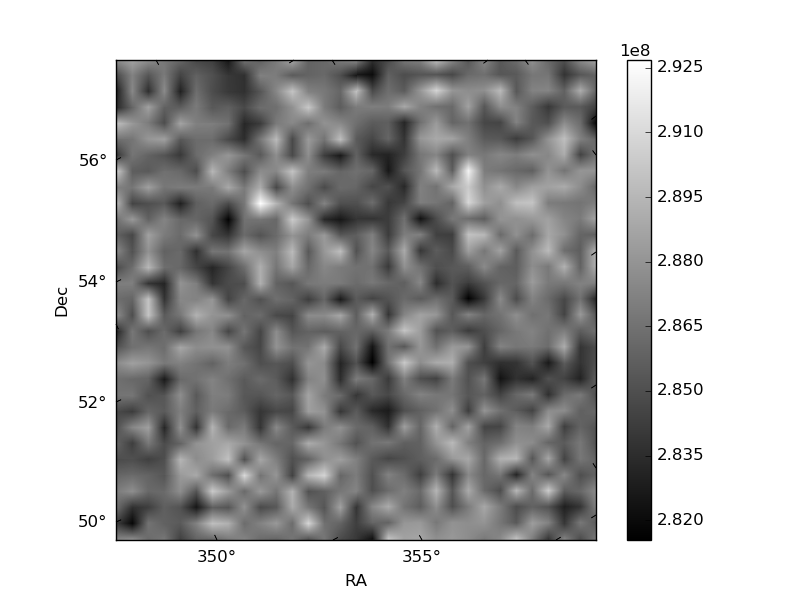
Histogram calculated using DETX and DETY for each event in the final _common_clean file
| Quadrant A | 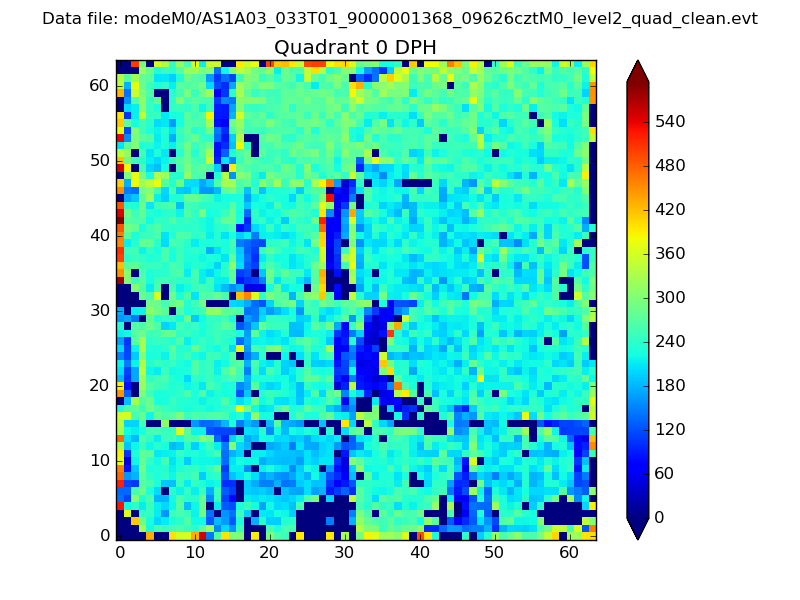 |
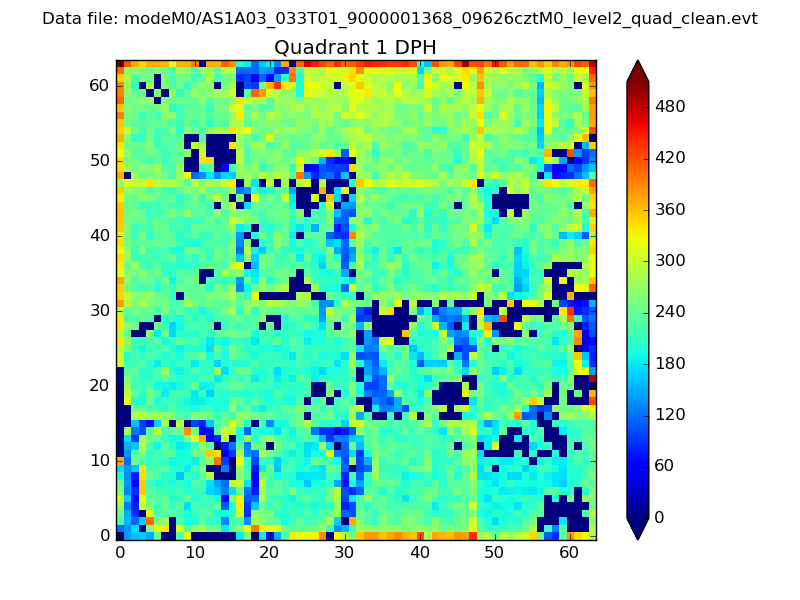 |
Quadrant B |
|---|---|---|---|
| Quadrant D | 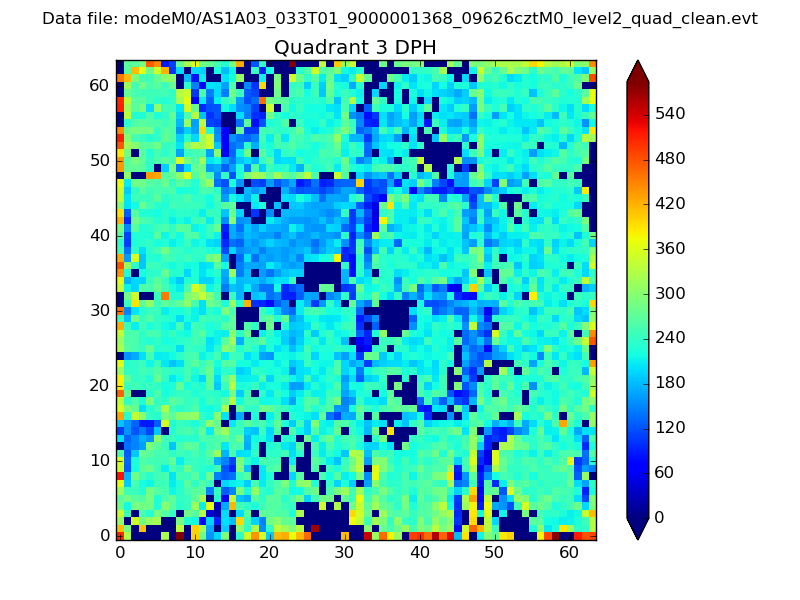 |
 |
Quadrant C |
| Plot type | Count rate plots | Images |
|---|---|---|
| Comparison with Poisson distribution Blue bars denote a histogram of data divided into 1 sec bins. Red curve is a Poisson curve with rate = median count rate of data. |
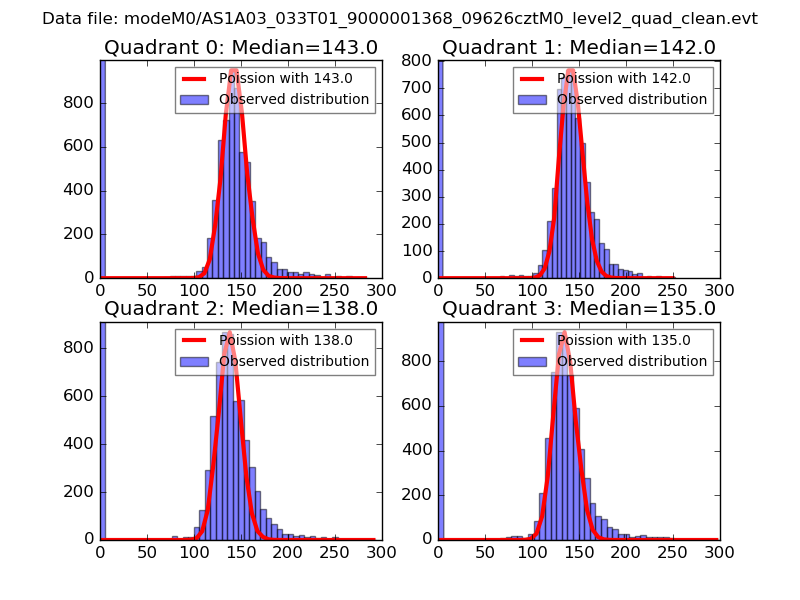 |
 |
| Quadrant-wise count rates Data is divided into 100 sec bins |
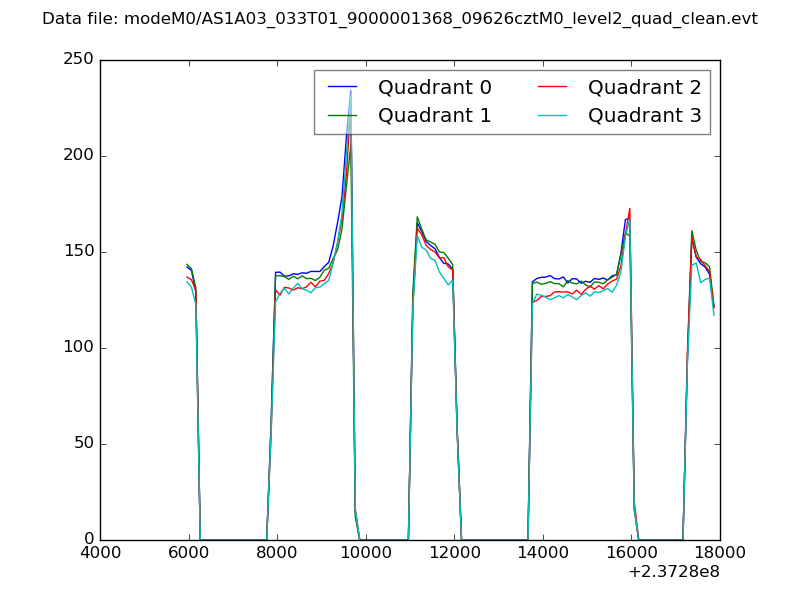 |
|
| Module-wise count rates for Quadrant A Data is divided into 100 sec bins |
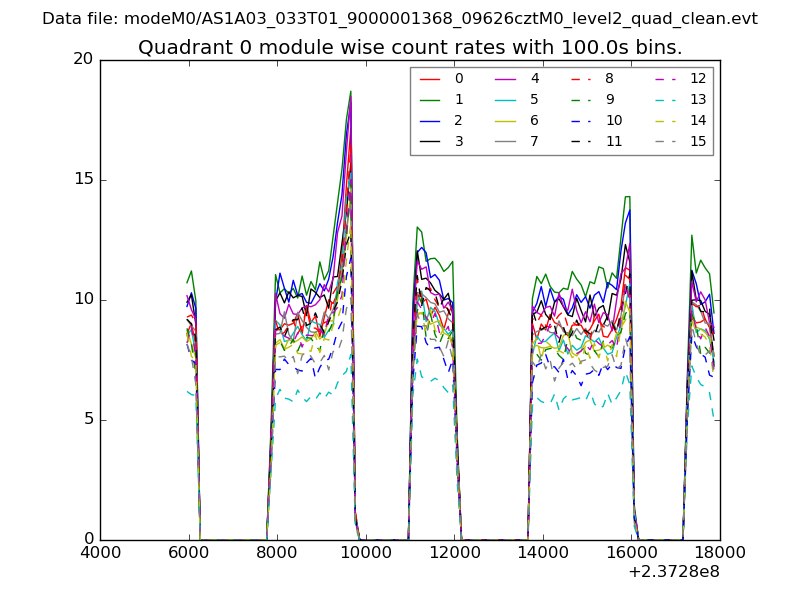 |
 |
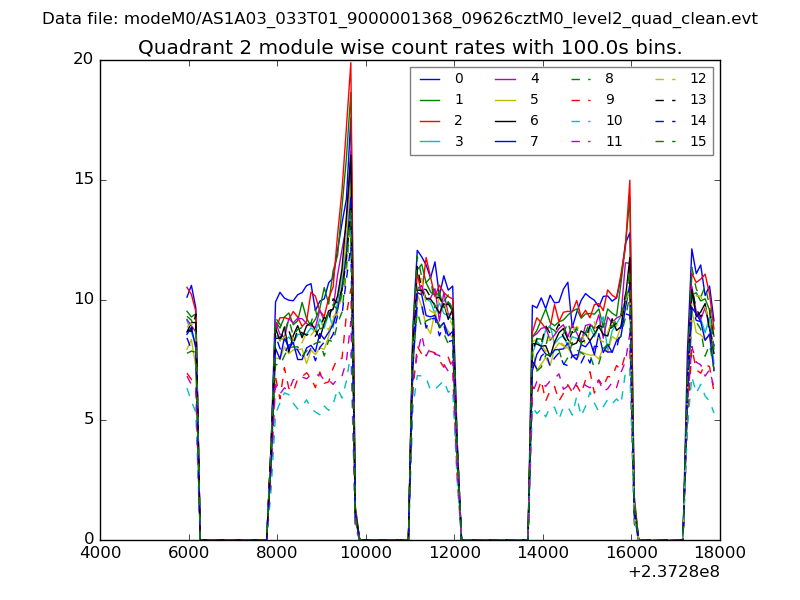
| Module-wise count rates for Quadrant B Data is divided into 100 sec bins |
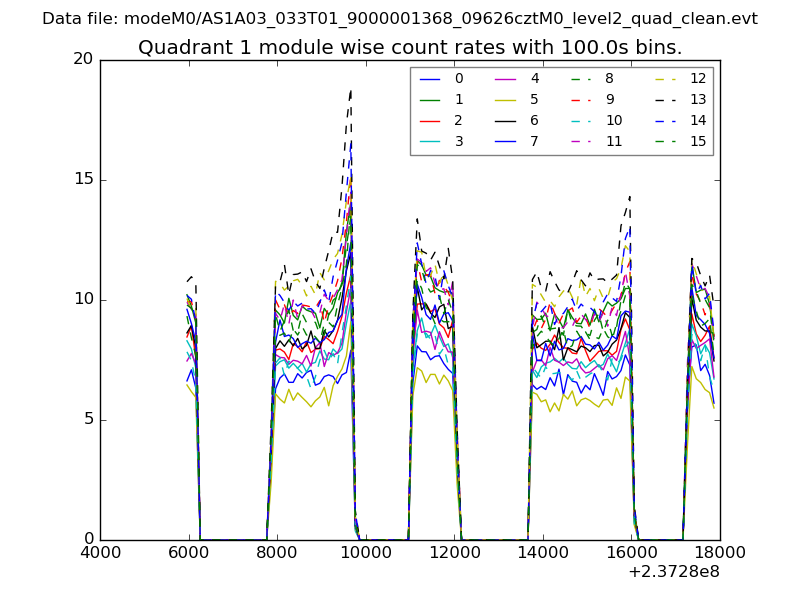 |
 |
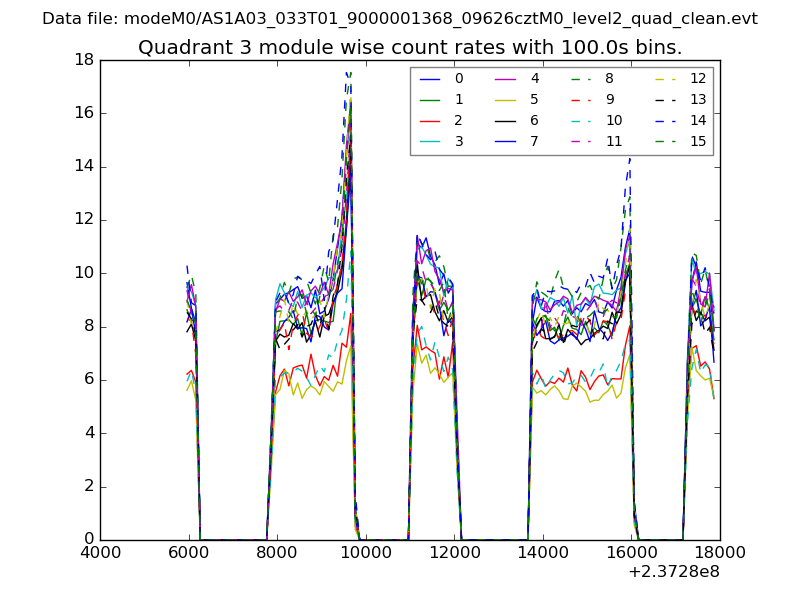
| Module-wise count rates for Quadrant C Data is divided into 100 sec bins |
 |
 |
| Module-wise count rates for Quadrant D Data is divided into 100 sec bins |
 |
 |
| Parameter | Plot |
|---|---|
| CZT HV Monitor | 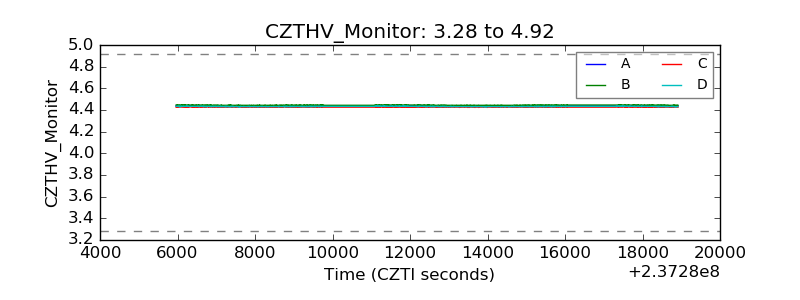 |
| D_VDD | 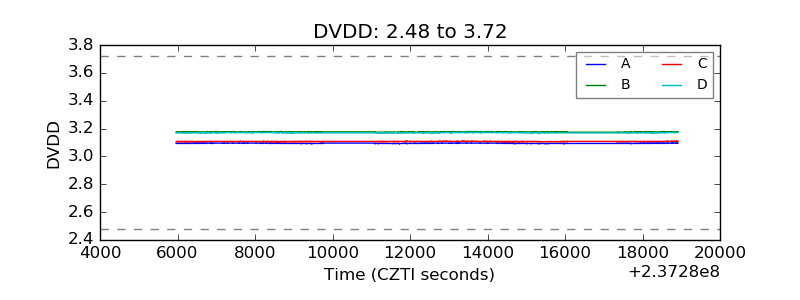 |
| Temperature 1 | 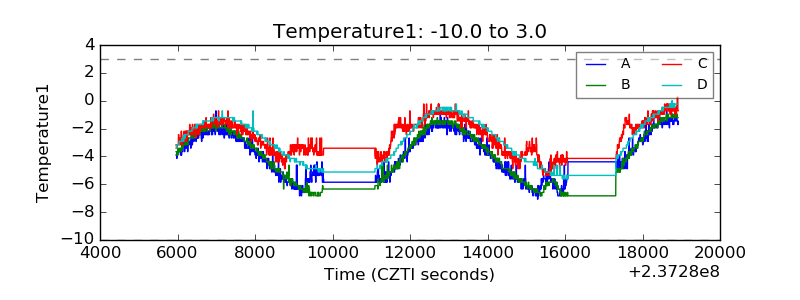 |
| Veto HV Monitor | 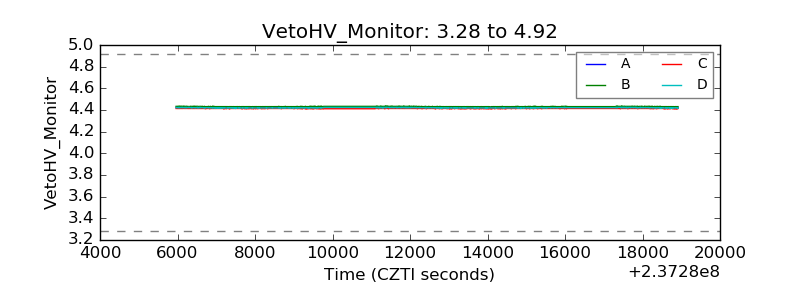 |
| Veto LLD | 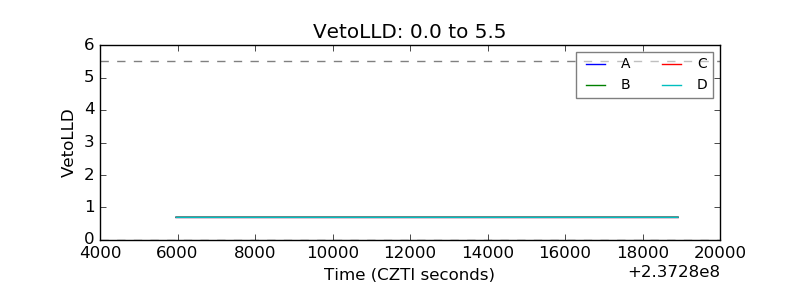 |
| Alpha Counter | 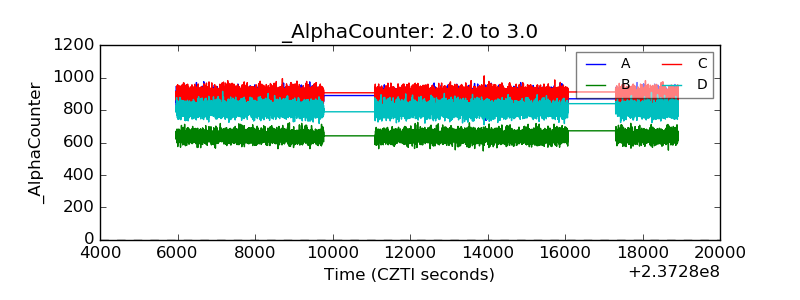 |
| _CPM_Rate | 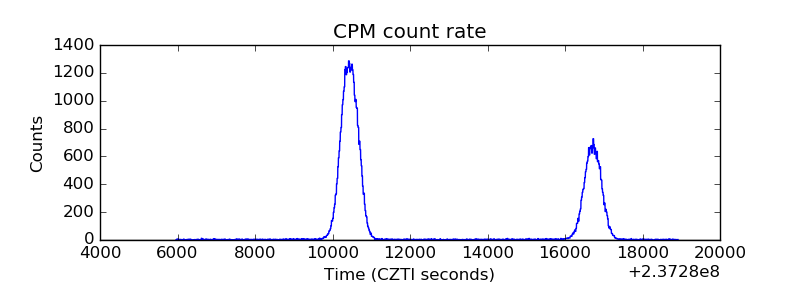 |
| CZT Counter | 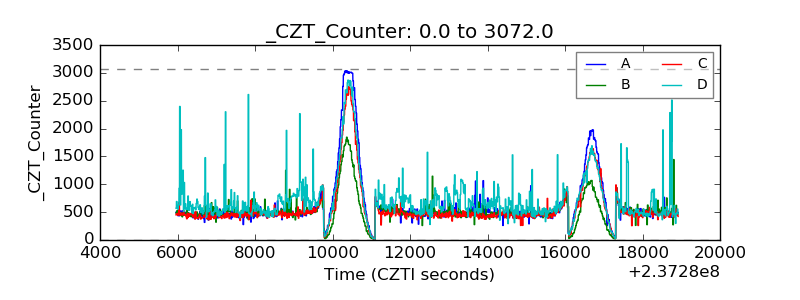 |
| +2.5 Volts monitor |  |
| +5 Volts monitor |  |
| _ROLL_ROT | 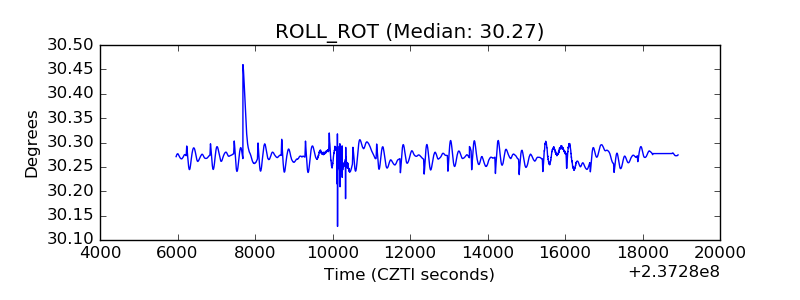 |
| _Roll_DEC | 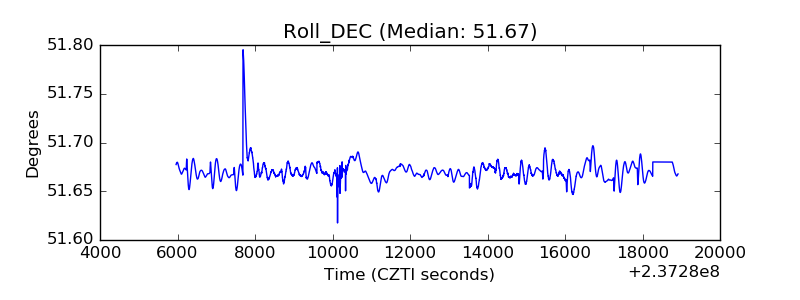 |
| _Roll_RA | 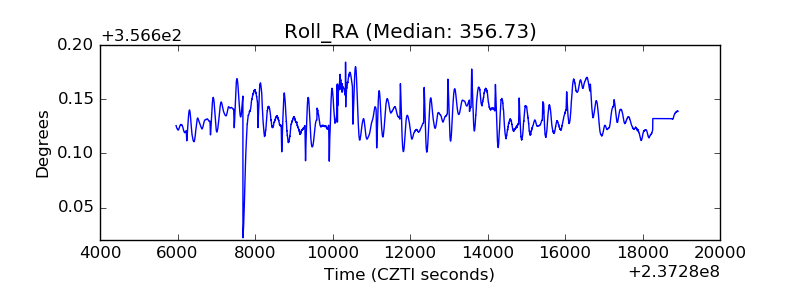 |
| Veto Counter | 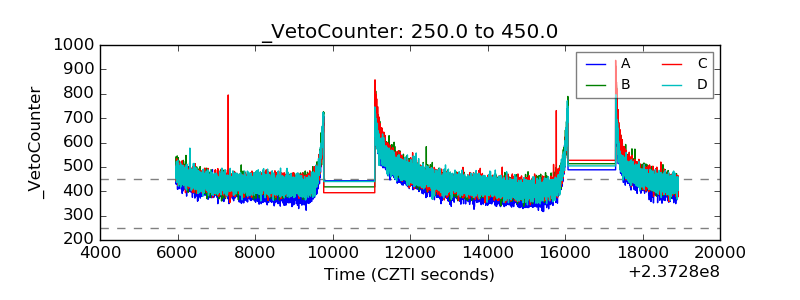 |