| Param | Original file | Final file |
|---|---|---|
| Filename | modeM0/AS1A03_033T01_9000001368_09627cztM0_level2.evt | modeM0/AS1A03_033T01_9000001368_09627cztM0_level2_quad_clean.evt |
| Size (bytes) | 497,488,320 | 82,339,200 |
| Size | 474.4 MB | 78.5 MB |
| Events in quadrant A | 3,306,543 | 513,865 |
| Events in quadrant B | 3,495,960 | 514,222 |
| Events in quadrant C | 3,367,672 | 500,403 |
| Events in quadrant D | 4,430,268 | 486,385 |
| Mode SS | |||
|---|---|---|---|
| Quadrant | BADHDUFLAG | Total packets | Discarded packets |
| A | 0 | 138 | 0 |
| B | 0 | 138 | 0 |
| C | 0 | 138 | 0 |
| D | 0 | 138 | 0 |
| Mode M9 | |||
|---|---|---|---|
| Quadrant | BADHDUFLAG | Total packets | Discarded packets |
| A | 0 | 12 | 0 |
| B | 0 | 12 | 0 |
| C | 0 | 12 | 0 |
| D | 0 | 13 | 0 |
| Mode M0 | |||
|---|---|---|---|
| Quadrant | BADHDUFLAG | Total packets | Discarded packets |
| A | 0 | 14190 | 3 |
| B | 0 | 14717 | 2 |
| C | 0 | 14621 | 2 |
| D | 0 | 17643 | 2 |
| Quadrant | Total seconds | Saturated seconds | Saturation percentage |
|---|---|---|---|
| A | 6864 | 166 | 2.418415% |
| B | 6864 | 170 | 2.476690% |
| C | 6864 | 165 | 2.403846% |
| D | 6864 | 298 | 4.341492% |
Noise dominated data is calculated using 1-second bins in cleaned event files. If a bin has >2000 counts, and if more than 50% of those come from <1% of pixels, then it is considered to be noise-dominated and hence unusable.
| Quadrant | # 1 sec bins | Bins with >0 counts | Bins with >2000 counts | High rate bins dominated by noise | Noise dominated (total time) | Noise dominated (detector-on time) | Marked lightcurve |
|---|---|---|---|---|---|---|---|
| A | 7869 | 6865 | 0 | 0 | 0.00% | 0.00% | 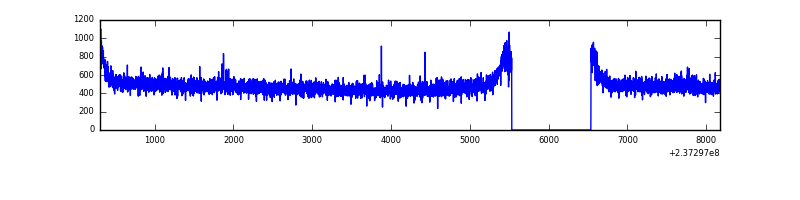 |
| B | 7869 | 6865 | 2 | 2 | 0.03% | 0.03% | 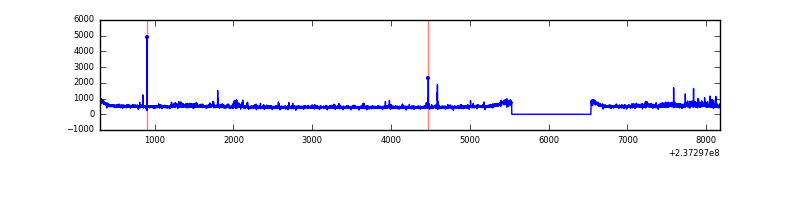 |
| C | 7869 | 6865 | 12 | 12 | 0.15% | 0.17% | 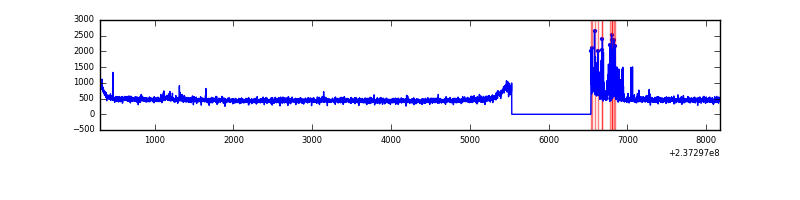 |
| D | 7869 | 6865 | 151 | 151 | 1.92% | 2.20% | 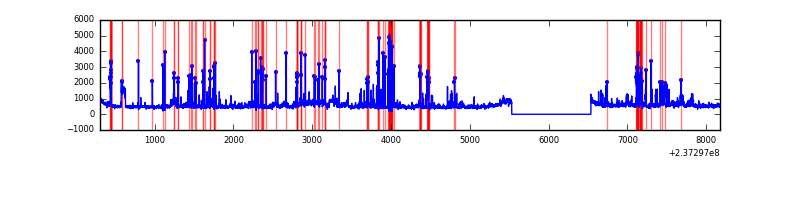 |
Top three noisy pixels from each quadrant. If the there are fewer than three noisy pixels in the level2.evt file, extra rows are filled as -1
| Pixel properties | Quadrant properties | ||||||
|---|---|---|---|---|---|---|---|
| Quadrant | DetID | PixID | Counts | Sigma | Mean | Median | Sigma |
| A | 3 | 1 | 10492 | 56.01 | 855 | 837 | 172.4 |
| A | 0 | 226 | 8023 | 41.69 | 855 | 837 | 172.4 |
| A | 12 | 194 | 7402 | 38.09 | 855 | 837 | 172.4 |
| B | 0 | 214 | 122043 | 753.94 | 850 | 830 | 160.8 |
| B | 0 | 229 | 42024 | 256.23 | 850 | 830 | 160.8 |
| B | 12 | 111 | 16689 | 98.64 | 850 | 830 | 160.8 |
| C | 4 | 254 | 166613 | 892.13 | 814 | 816 | 185.8 |
| C | 9 | 237 | 17223 | 88.28 | 814 | 816 | 185.8 |
| C | 13 | 61 | 6259 | 29.29 | 814 | 816 | 185.8 |
| D | 1 | 52 | 736245 | 3591.22 | 818 | 796 | 204.8 |
| D | 8 | 195 | 352421 | 1717.0 | 818 | 796 | 204.8 |
| D | 10 | 172 | 46007 | 220.77 | 818 | 796 | 204.8 |
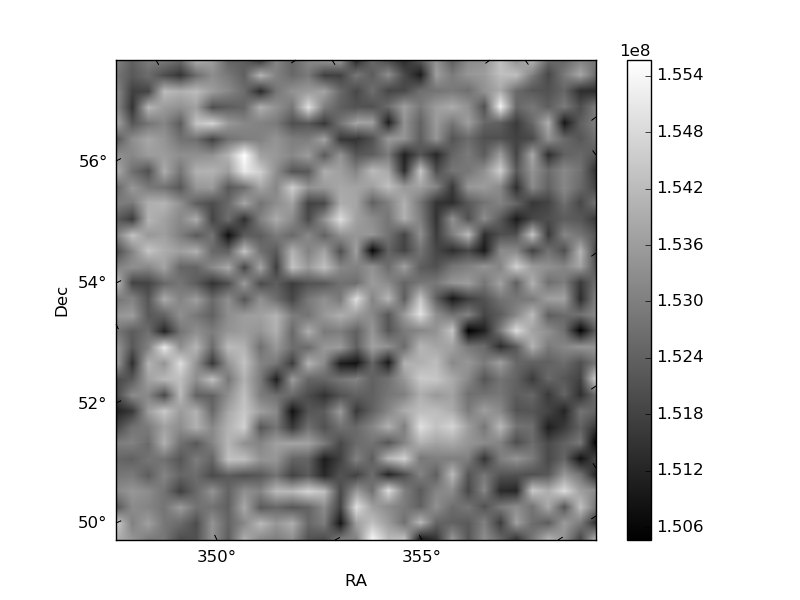
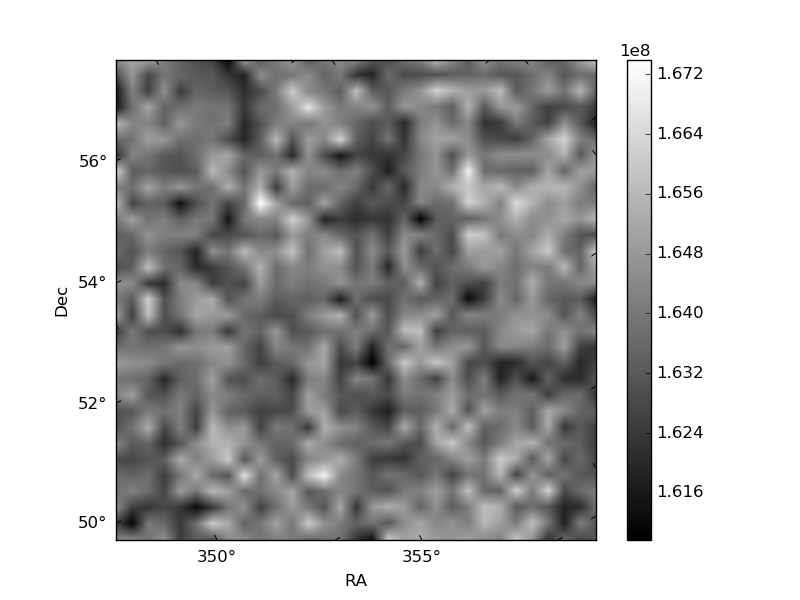
Histogram calculated using DETX and DETY for each event in the final _common_clean file
| Quadrant A | 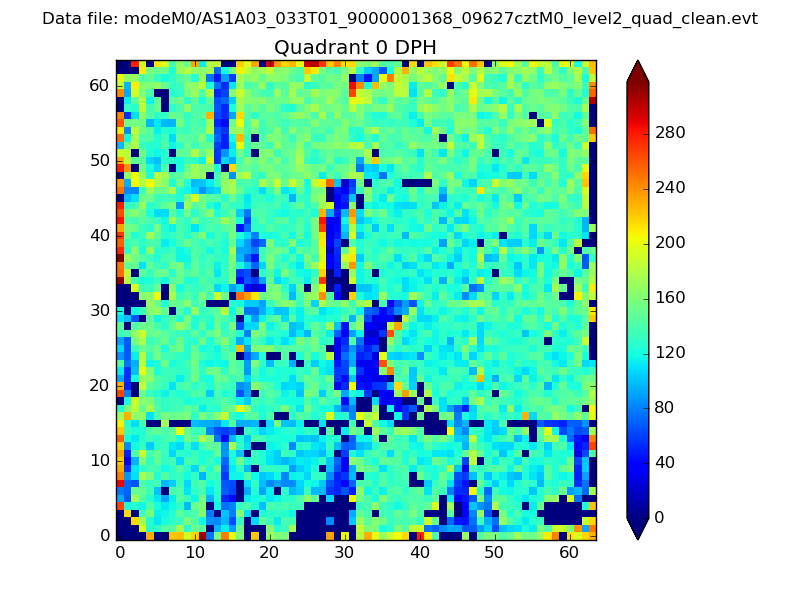 |
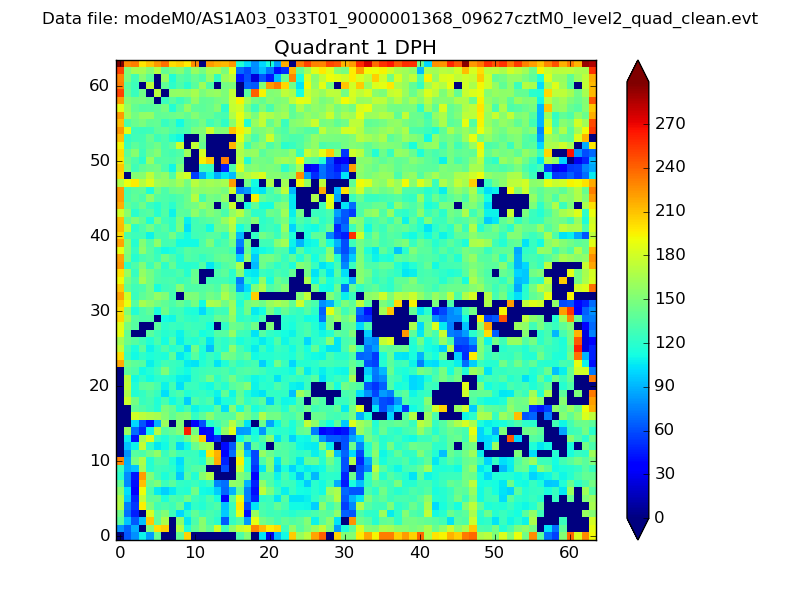 |
Quadrant B |
|---|---|---|---|
| Quadrant D | 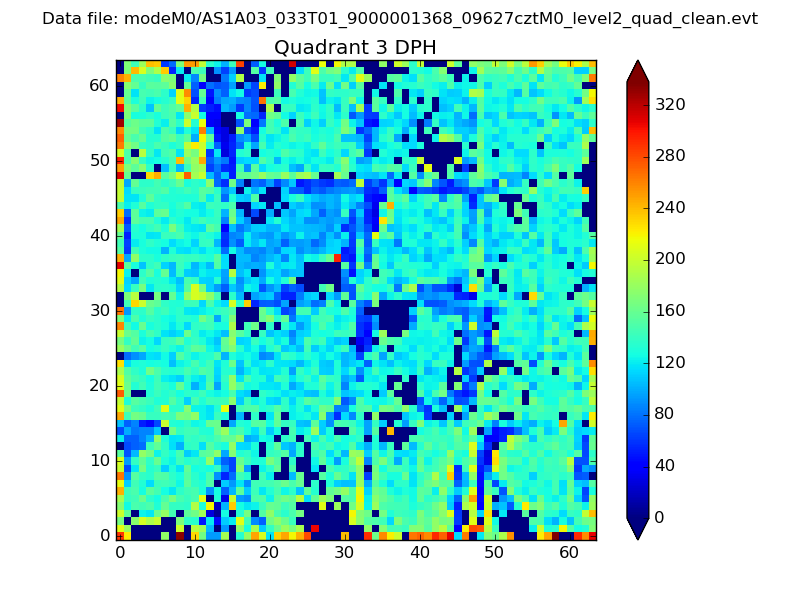 |
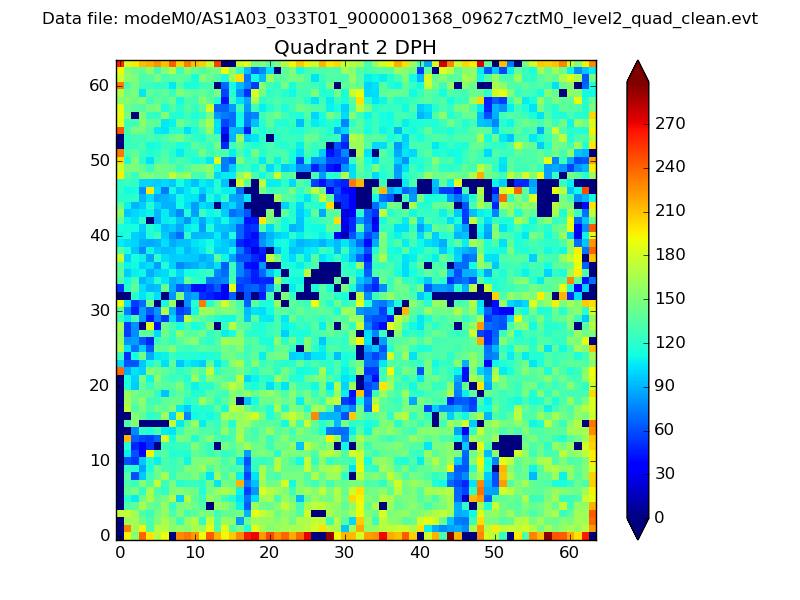 |
Quadrant C |
| Plot type | Count rate plots | Images |
|---|---|---|
| Comparison with Poisson distribution Blue bars denote a histogram of data divided into 1 sec bins. Red curve is a Poisson curve with rate = median count rate of data. |
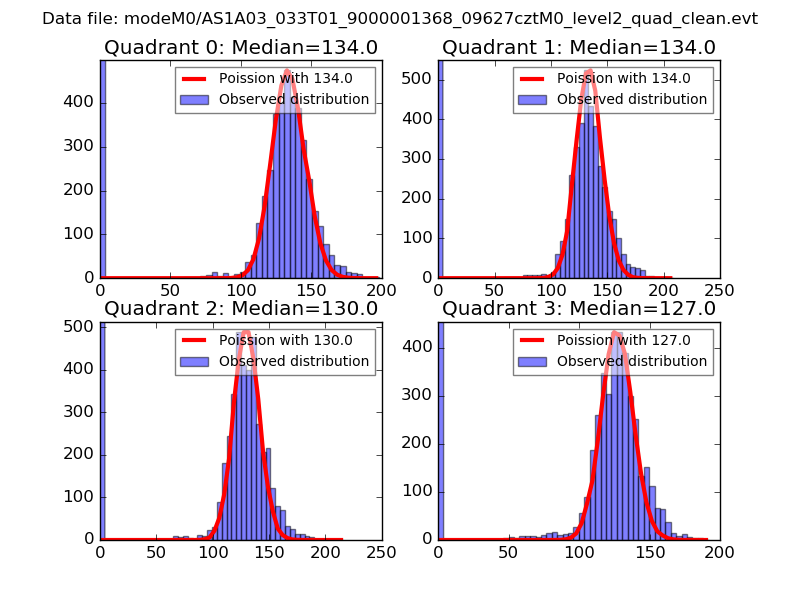 |
 |
| Quadrant-wise count rates Data is divided into 100 sec bins |
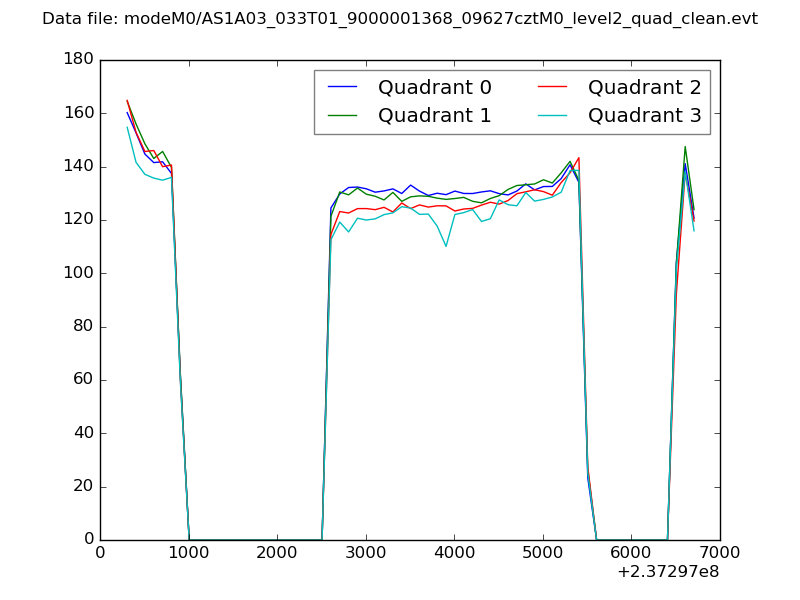 |
|
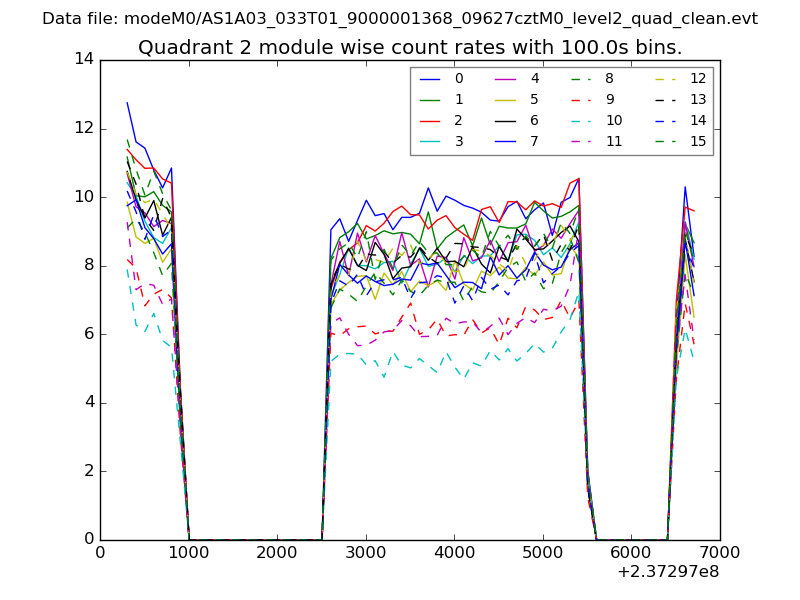
| Module-wise count rates for Quadrant A Data is divided into 100 sec bins |
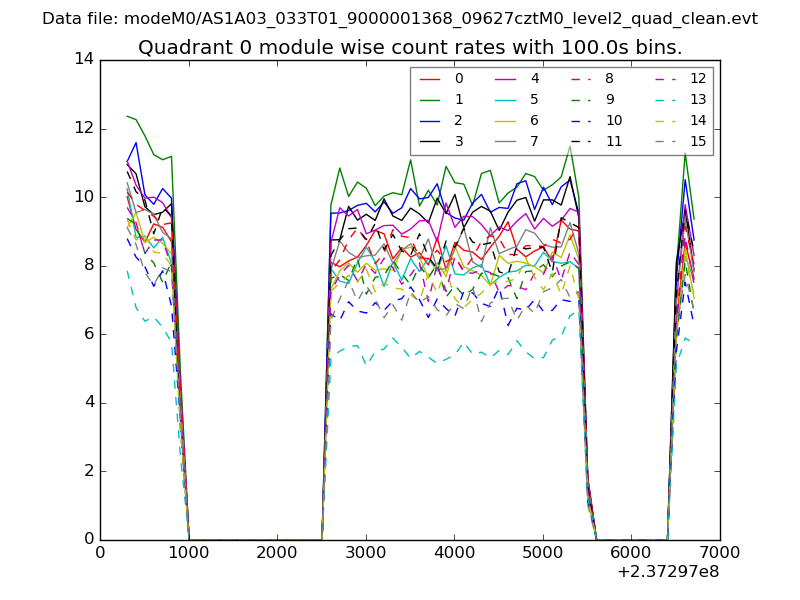 |
 |
| Module-wise count rates for Quadrant B Data is divided into 100 sec bins |
 |
 |
| Module-wise count rates for Quadrant C Data is divided into 100 sec bins |
 |
 |
| Module-wise count rates for Quadrant D Data is divided into 100 sec bins |
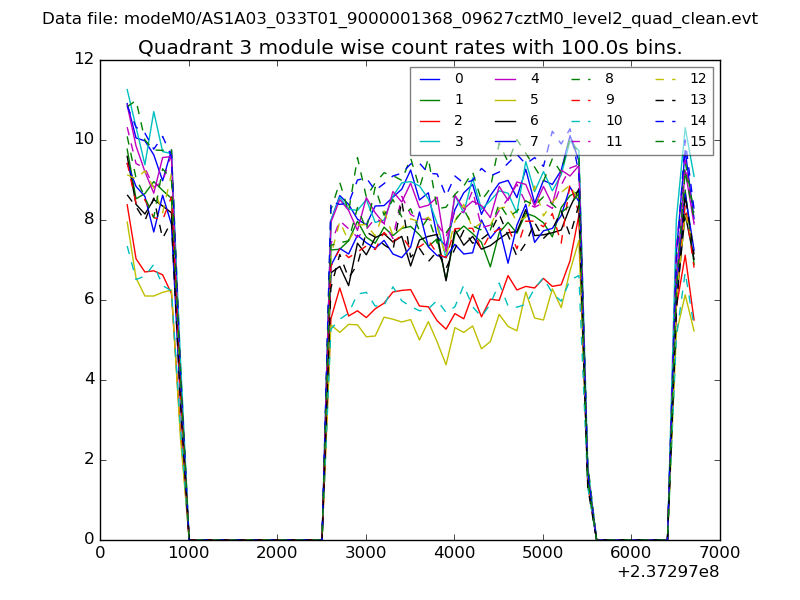 |
 |
| Parameter | Plot |
|---|---|
| CZT HV Monitor | 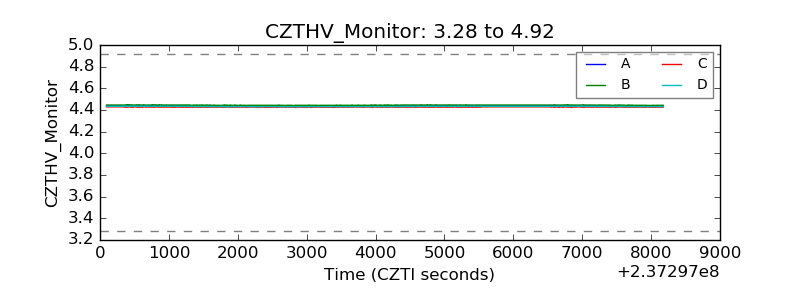 |
| D_VDD |  |
| Temperature 1 | 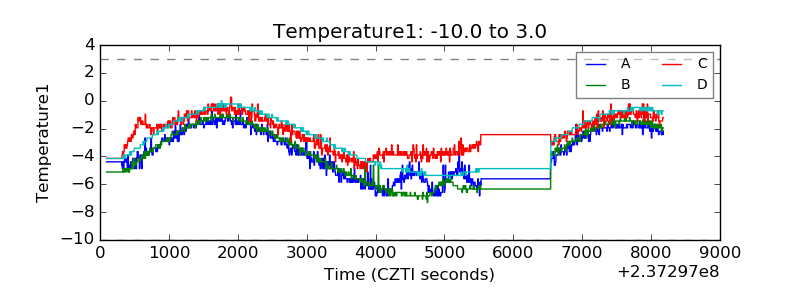 |
| Veto HV Monitor | 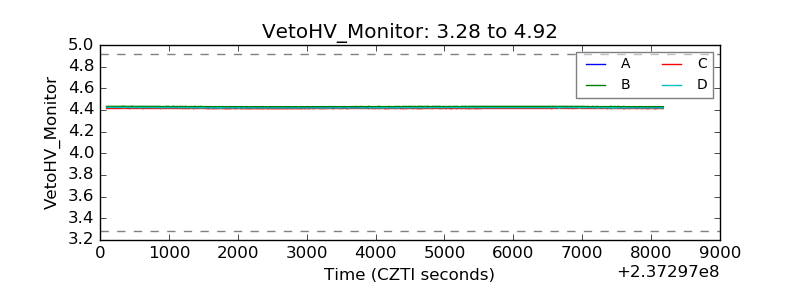 |
| Veto LLD | 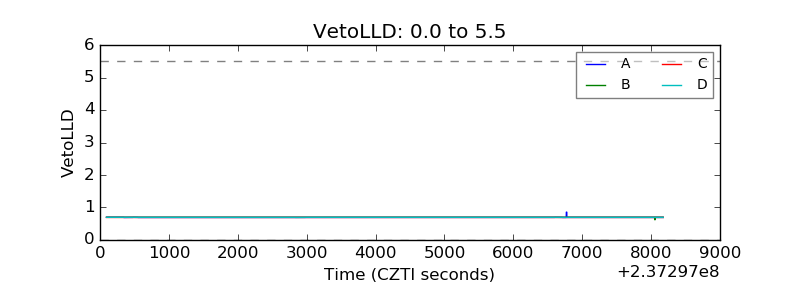 |
| Alpha Counter | 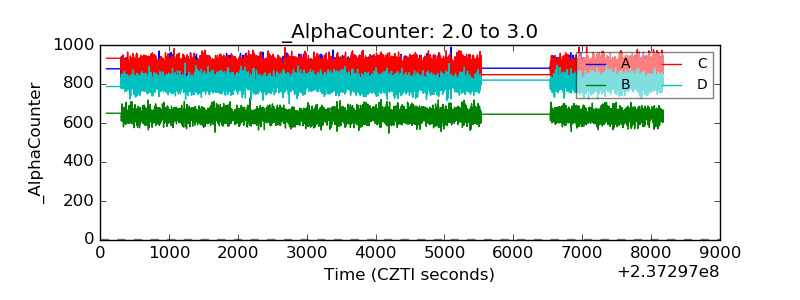 |
| _CPM_Rate | 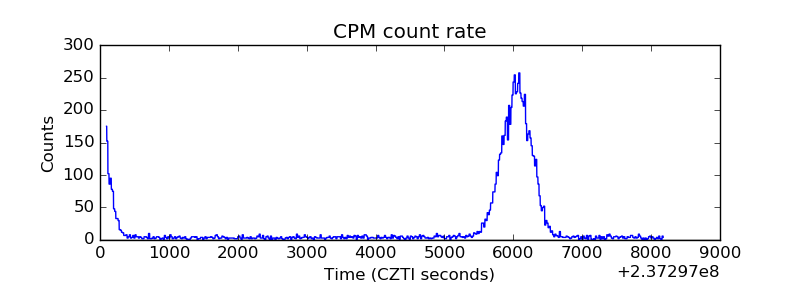 |
| CZT Counter | 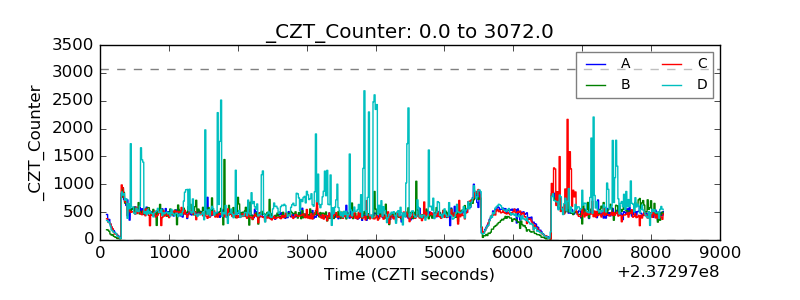 |
| +2.5 Volts monitor |  |
| +5 Volts monitor |  |
| _ROLL_ROT | 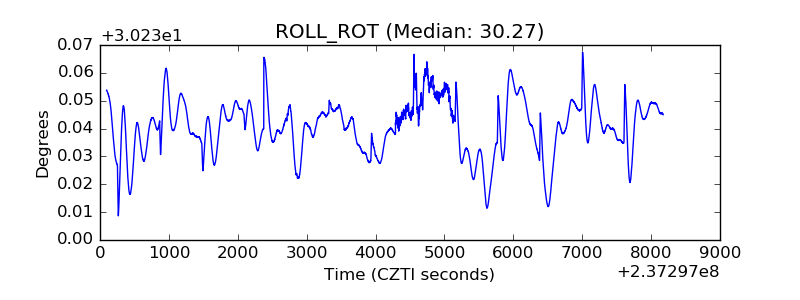 |
| _Roll_DEC | 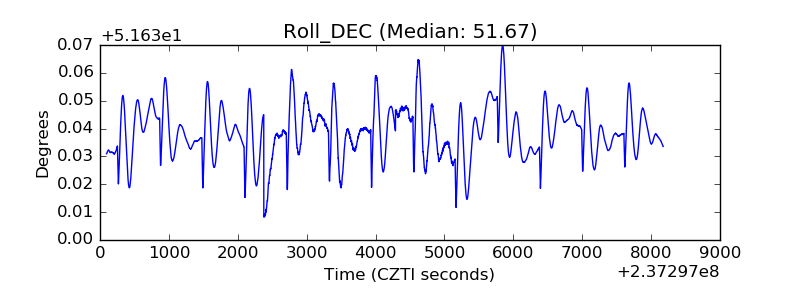 |
| _Roll_RA | 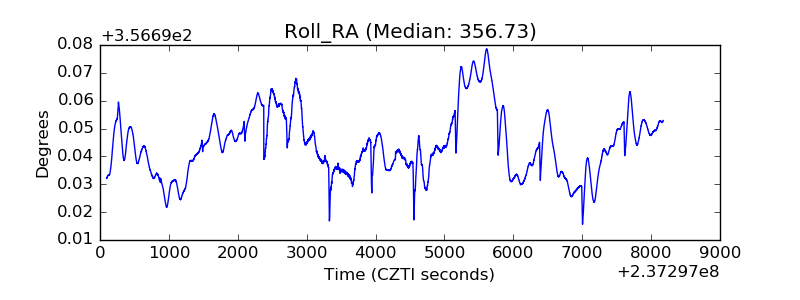 |
| Veto Counter | 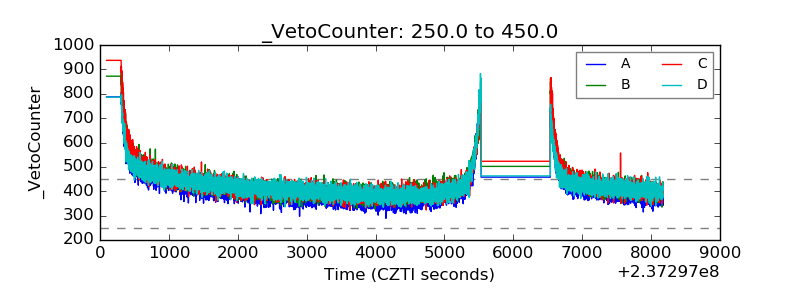 |