| Param | Original file | Final file |
|---|---|---|
| Filename | modeM0/AS1A03_033T01_9000001368_09628cztM0_level2.evt | modeM0/AS1A03_033T01_9000001368_09628cztM0_level2_quad_clean.evt |
| Size (bytes) | 515,537,280 | 74,989,440 |
| Size | 491.7 MB | 71.5 MB |
| Events in quadrant A | 3,686,180 | 444,674 |
| Events in quadrant B | 3,342,510 | 458,670 |
| Events in quadrant C | 3,094,159 | 447,503 |
| Events in quadrant D | 5,030,914 | 448,635 |
| Mode SS | |||
|---|---|---|---|
| Quadrant | BADHDUFLAG | Total packets | Discarded packets |
| A | 0 | 138 | 0 |
| B | 0 | 138 | 0 |
| C | 0 | 138 | 0 |
| D | 0 | 138 | 0 |
| Mode M9 | |||
|---|---|---|---|
| Quadrant | BADHDUFLAG | Total packets | Discarded packets |
| A | 0 | 6 | 0 |
| B | 0 | 6 | 0 |
| C | 0 | 6 | 0 |
| D | 0 | 6 | 0 |
| Mode M0 | |||
|---|---|---|---|
| Quadrant | BADHDUFLAG | Total packets | Discarded packets |
| A | 0 | 15503 | 43 |
| B | 0 | 14416 | 53 |
| C | 0 | 14019 | 65 |
| D | 0 | 19661 | 49 |
| Quadrant | Total seconds | Saturated seconds | Saturation percentage |
|---|---|---|---|
| A | 6758 | 335 | 4.957088% |
| B | 6755 | 150 | 2.220577% |
| C | 6750 | 125 | 1.851852% |
| D | 6762 | 770 | 11.387164% |
Noise dominated data is calculated using 1-second bins in cleaned event files. If a bin has >2000 counts, and if more than 50% of those come from <1% of pixels, then it is considered to be noise-dominated and hence unusable.
| Quadrant | # 1 sec bins | Bins with >0 counts | Bins with >2000 counts | High rate bins dominated by noise | Noise dominated (total time) | Noise dominated (detector-on time) | Marked lightcurve |
|---|---|---|---|---|---|---|---|
| A | 7434 | 6779 | 130 | 130 | 1.75% | 1.92% | 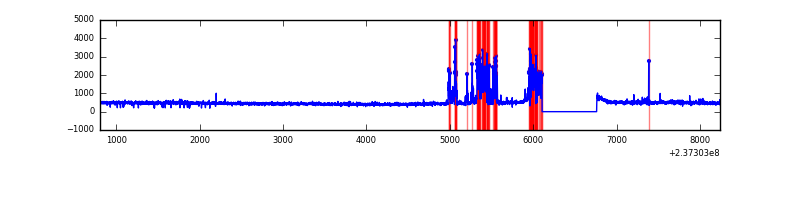 |
| B | 7434 | 6777 | 0 | 0 | 0.00% | 0.00% | 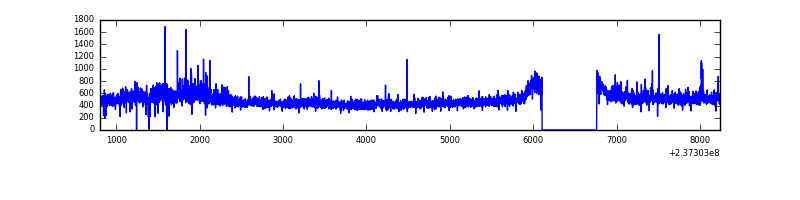 |
| C | 7434 | 6779 | 3 | 3 | 0.04% | 0.04% | 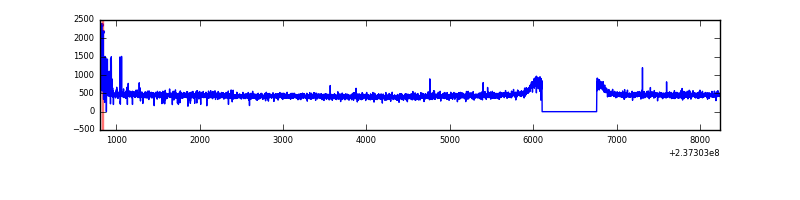 |
| D | 7434 | 6779 | 562 | 562 | 7.56% | 8.29% | 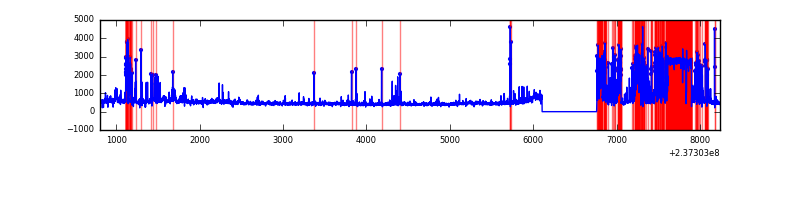 |
Top three noisy pixels from each quadrant. If the there are fewer than three noisy pixels in the level2.evt file, extra rows are filled as -1
| Pixel properties | Quadrant properties | ||||||
|---|---|---|---|---|---|---|---|
| Quadrant | DetID | PixID | Counts | Sigma | Mean | Median | Sigma |
| A | 14 | 111 | 618869 | 3837.8 | 788 | 770 | 161.1 |
| A | 3 | 1 | 12991 | 75.88 | 788 | 770 | 161.1 |
| A | 1 | 162 | 10077 | 57.79 | 788 | 770 | 161.1 |
| B | 0 | 214 | 95931 | 617.33 | 808 | 787 | 154.1 |
| B | 0 | 229 | 52875 | 337.96 | 808 | 787 | 154.1 |
| B | 12 | 111 | 15832 | 97.62 | 808 | 787 | 154.1 |
| C | 4 | 254 | 67739 | 374.58 | 775 | 776 | 178.8 |
| C | 13 | 61 | 5872 | 28.51 | 775 | 776 | 178.8 |
| C | 15 | 127 | 2209 | 8.02 | 775 | 776 | 178.8 |
| D | 1 | 52 | 1793644 | 9717.14 | 733 | 712 | 184.5 |
| D | 8 | 195 | 170116 | 918.12 | 733 | 712 | 184.5 |
| D | 13 | 137 | 118926 | 640.68 | 733 | 712 | 184.5 |
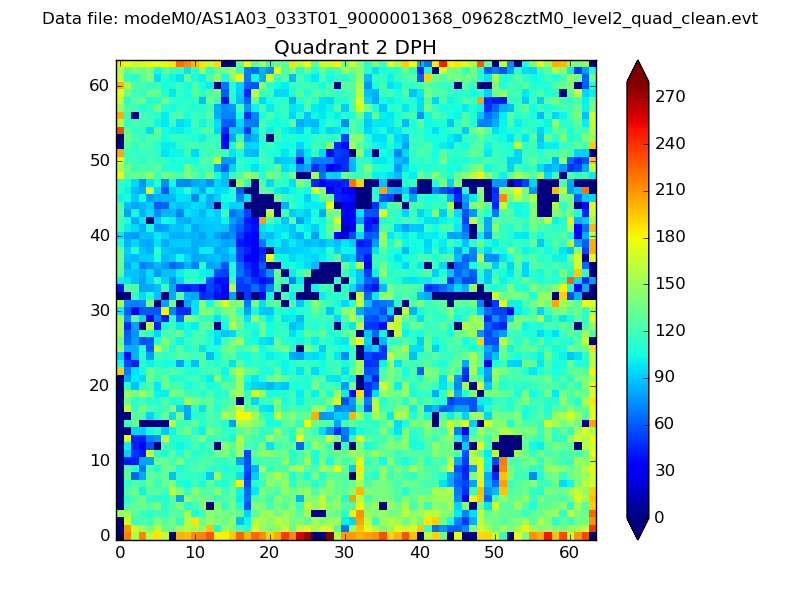
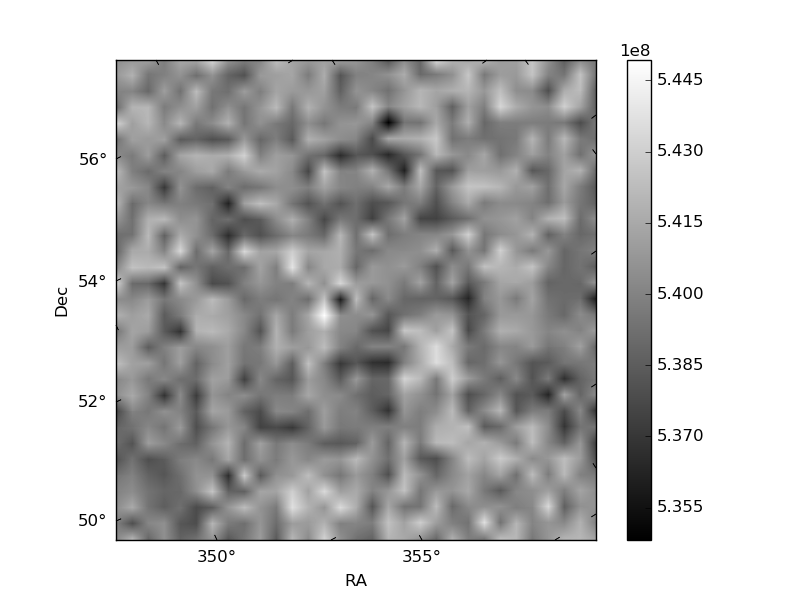
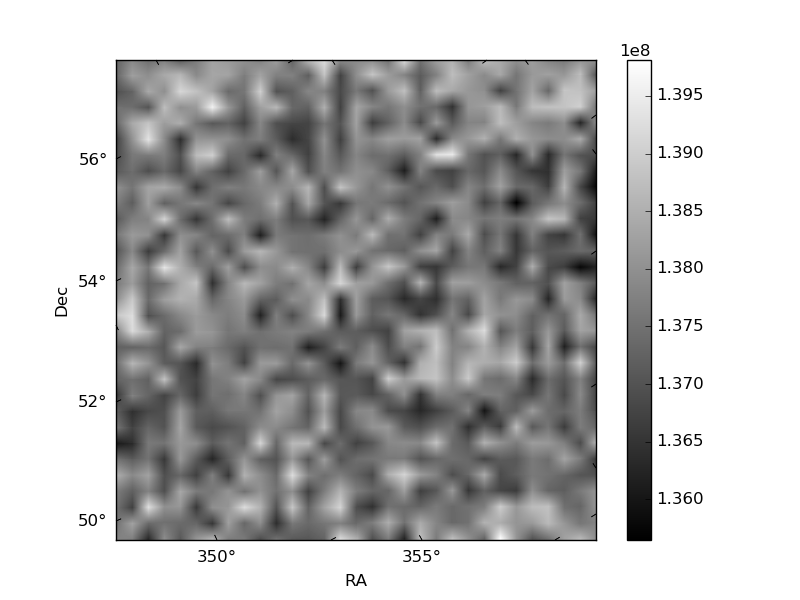
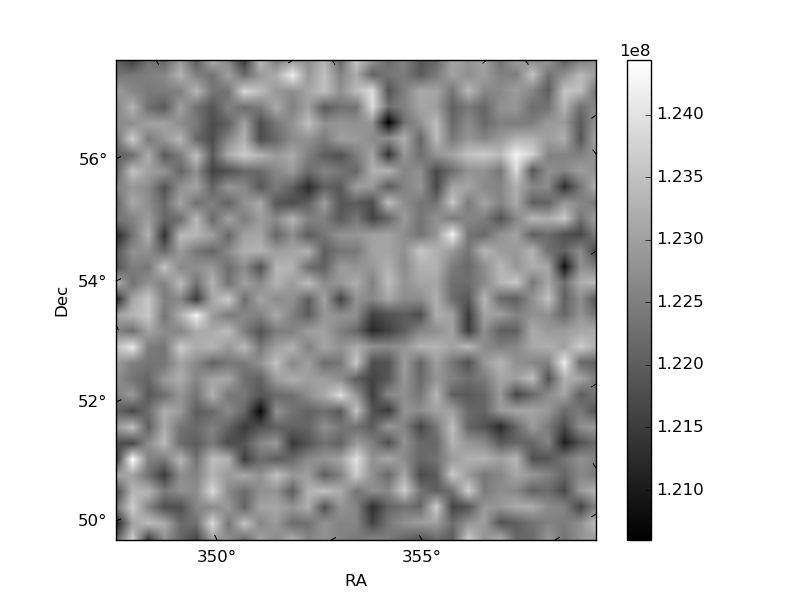
Histogram calculated using DETX and DETY for each event in the final _common_clean file
| Quadrant A | 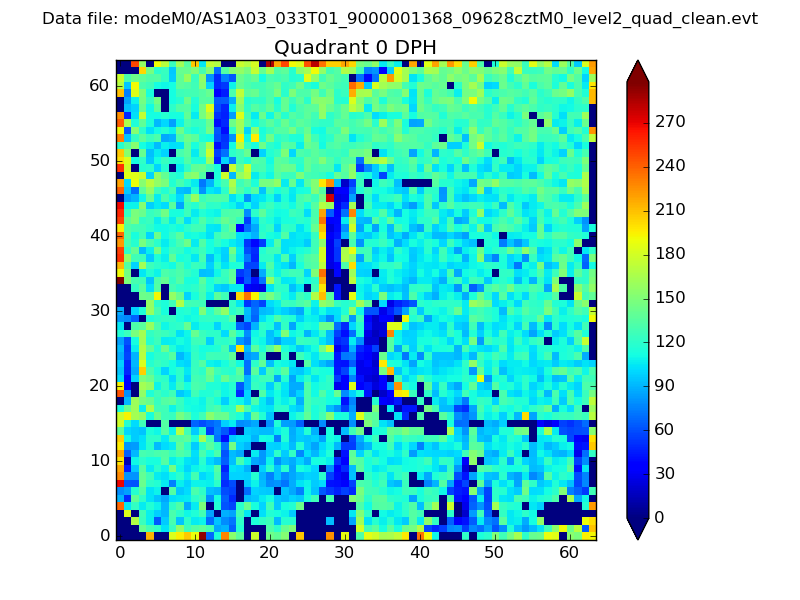 |
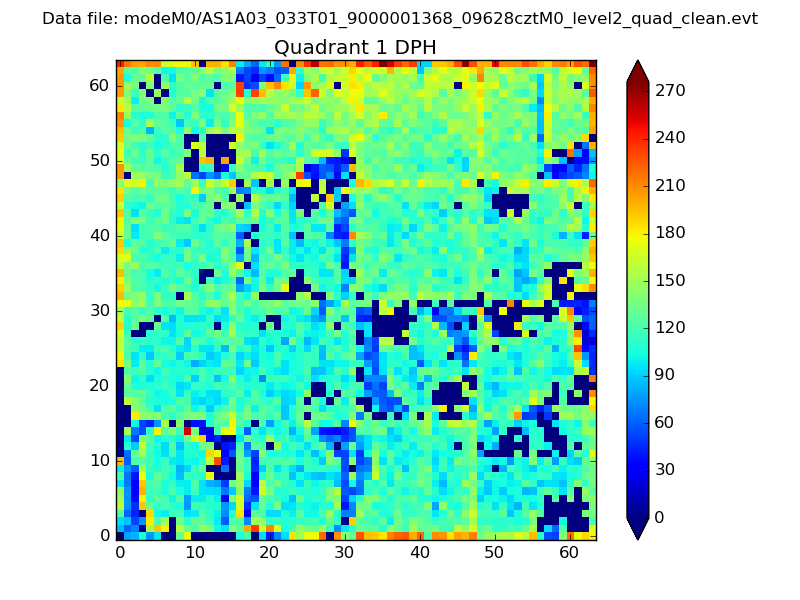 |
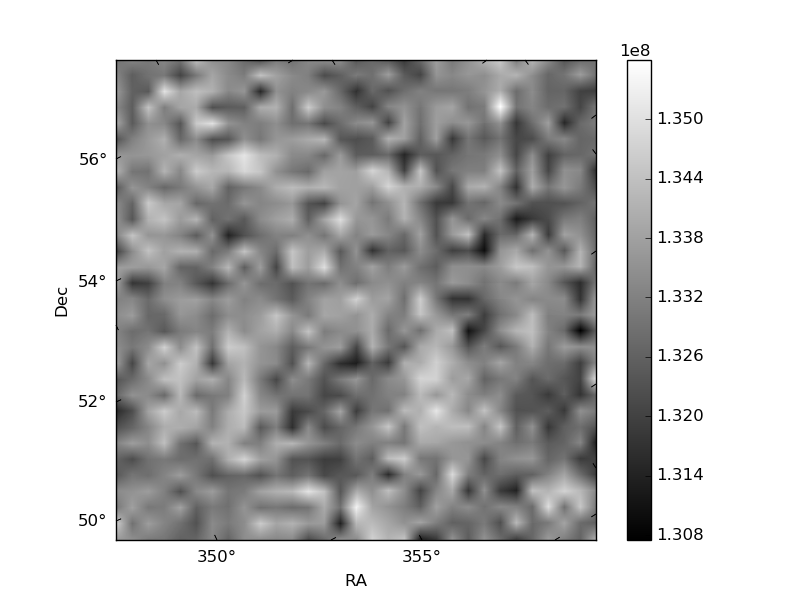
Quadrant B |
|---|---|---|---|
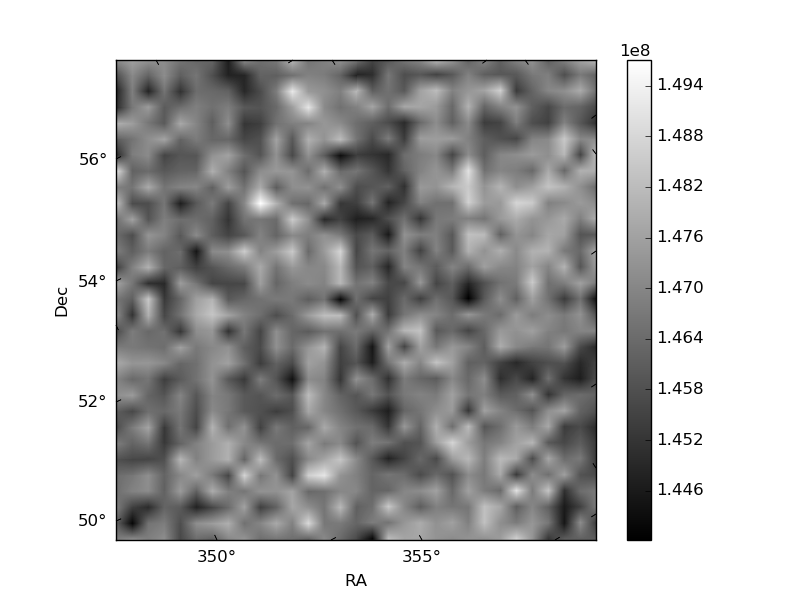
| Quadrant D | 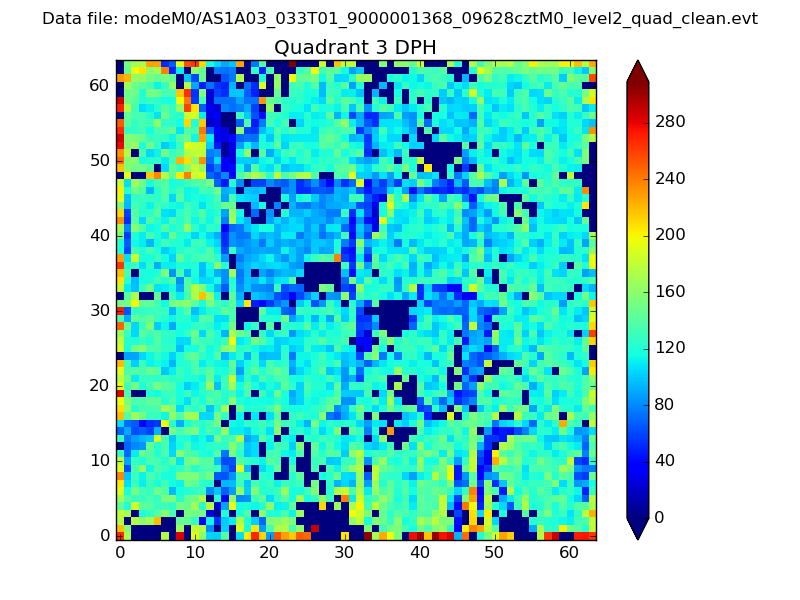 |
 |
Quadrant C |
| Plot type | Count rate plots | Images |
|---|---|---|
| Comparison with Poisson distribution Blue bars denote a histogram of data divided into 1 sec bins. Red curve is a Poisson curve with rate = median count rate of data. |
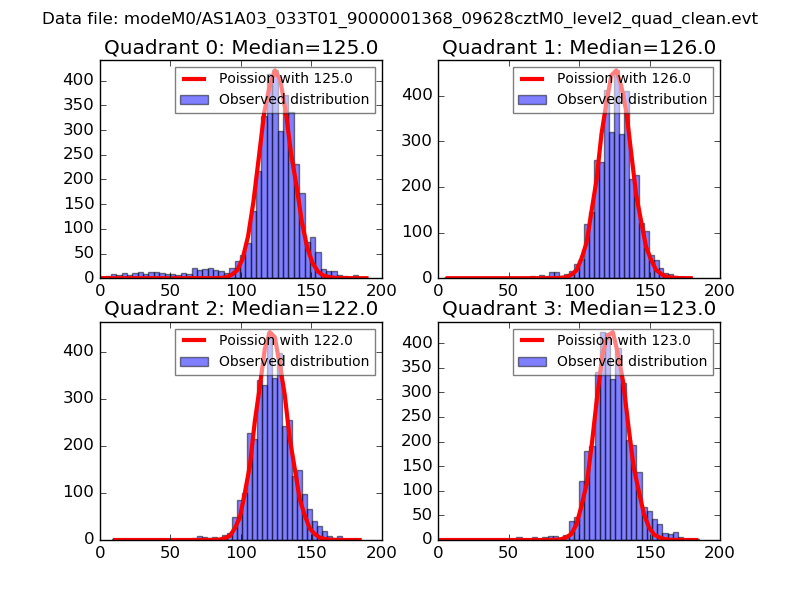 |
 |
| Quadrant-wise count rates Data is divided into 100 sec bins |
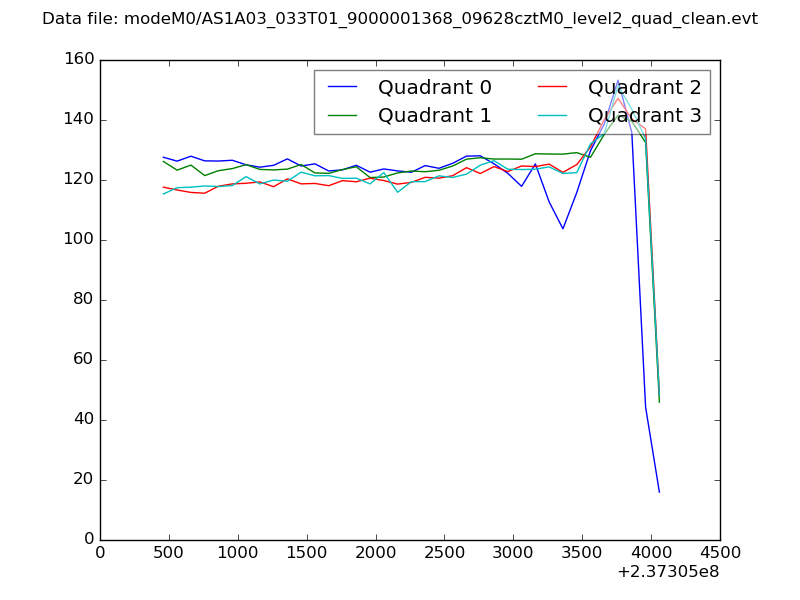 |
|
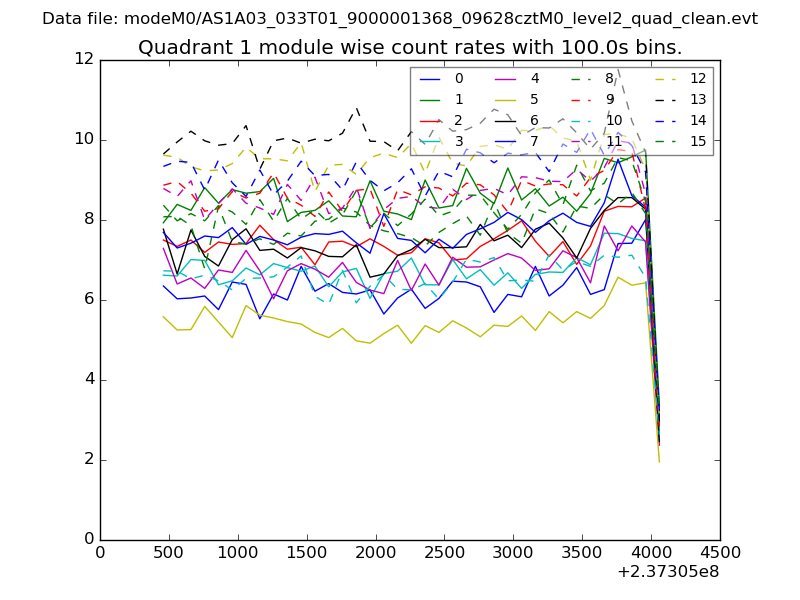
| Module-wise count rates for Quadrant A Data is divided into 100 sec bins |
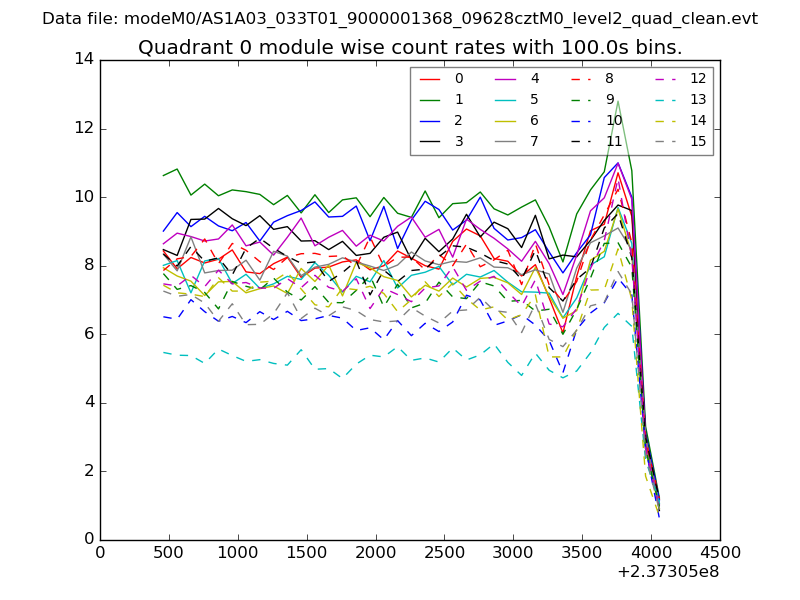 |
 |
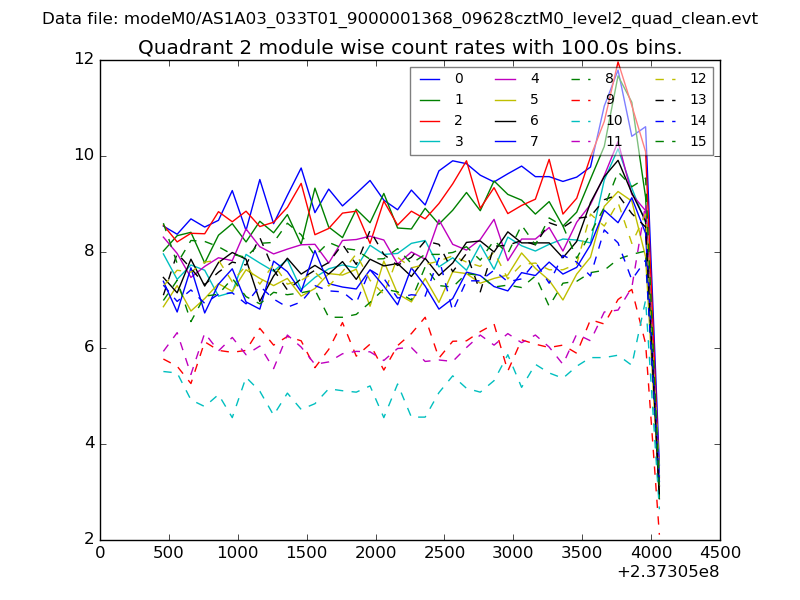
| Module-wise count rates for Quadrant B Data is divided into 100 sec bins |
 |
 |
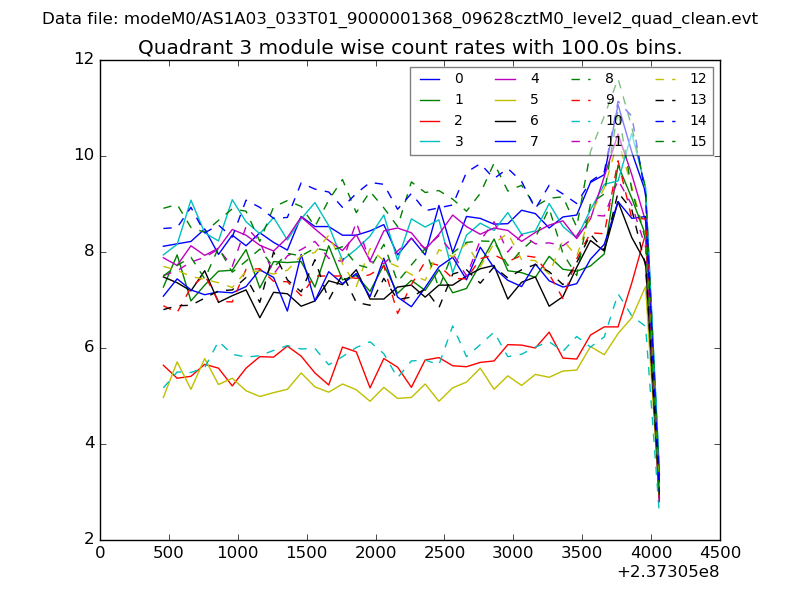
| Module-wise count rates for Quadrant C Data is divided into 100 sec bins |
 |
 |
| Module-wise count rates for Quadrant D Data is divided into 100 sec bins |
 |
 |
| Parameter | Plot |
|---|---|
| CZT HV Monitor | 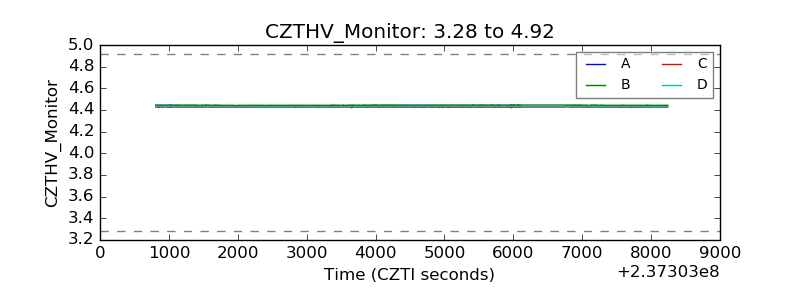 |
| D_VDD | 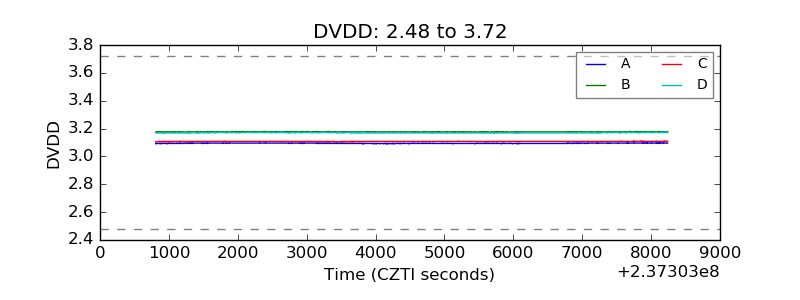 |
| Temperature 1 | 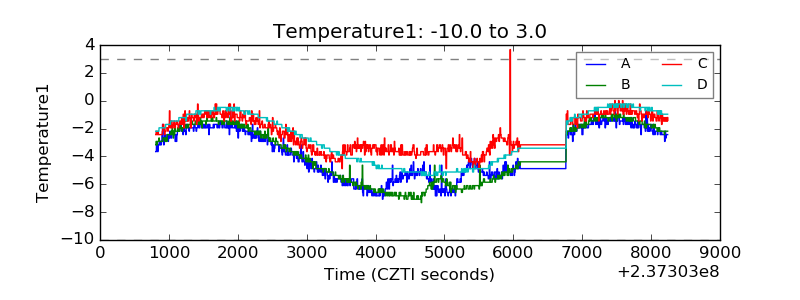 |
| Veto HV Monitor | 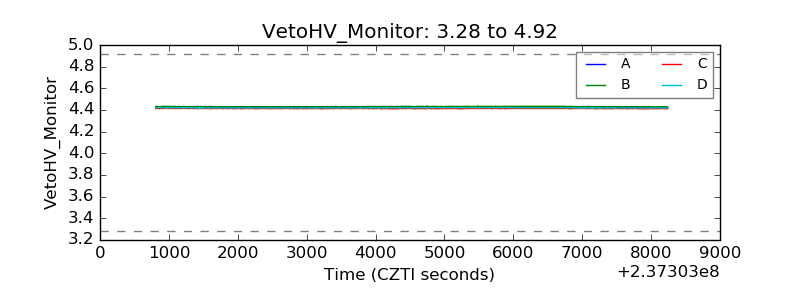 |
| Veto LLD | 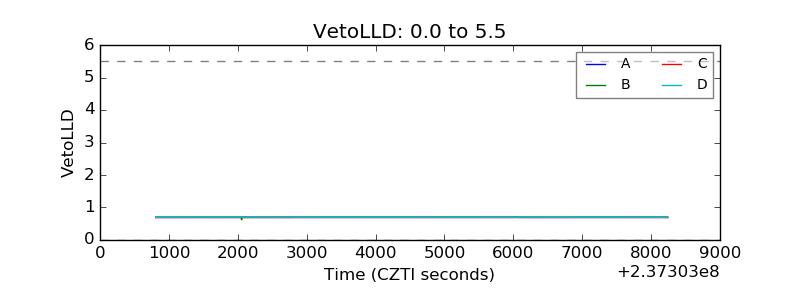 |
| Alpha Counter | 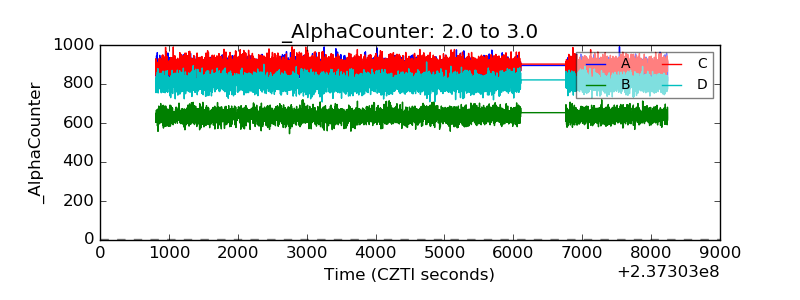 |
| _CPM_Rate | 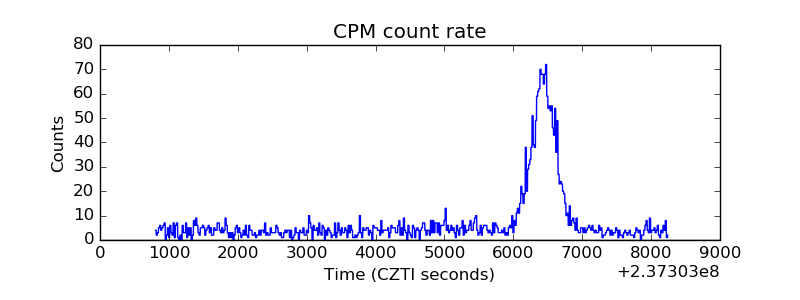 |
| CZT Counter | 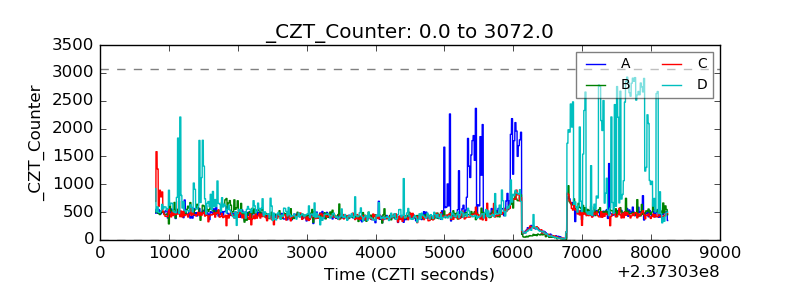 |
| +2.5 Volts monitor |  |
| +5 Volts monitor |  |
| _ROLL_ROT | 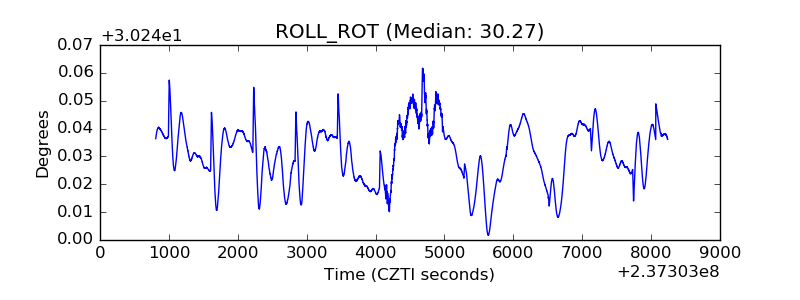 |
| _Roll_DEC | 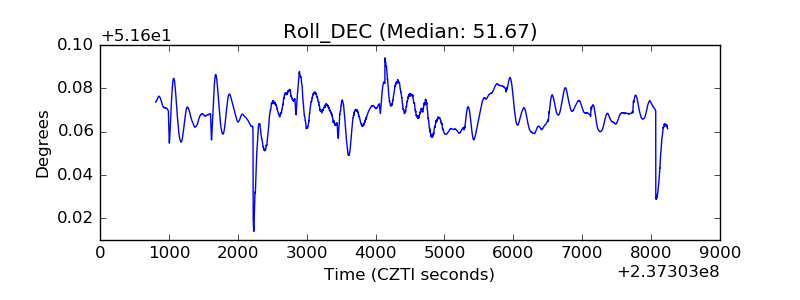 |
| _Roll_RA | 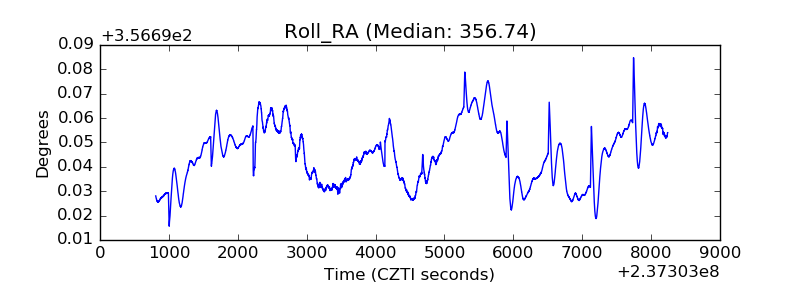 |
| Veto Counter | 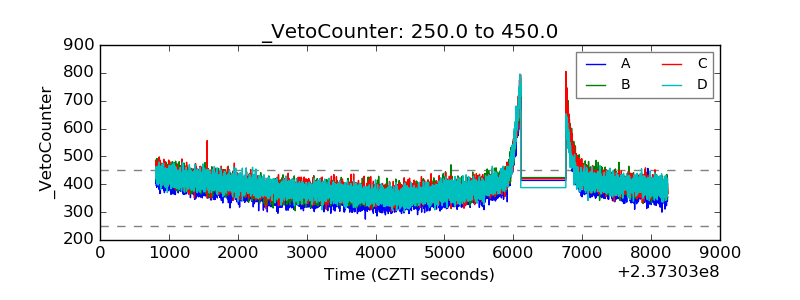 |