| Param | Original file | Final file |
|---|---|---|
| Filename | modeM0/AS1A03_033T01_9000001368_09629cztM0_level2.evt | modeM0/AS1A03_033T01_9000001368_09629cztM0_level2_quad_clean.evt |
| Size (bytes) | 338,716,800 | 50,195,520 |
| Size | 323.0 MB | 47.9 MB |
| Events in quadrant A | 1,937,386 | 318,438 |
| Events in quadrant B | 1,966,390 | 317,327 |
| Events in quadrant C | 1,799,060 | 305,889 |
| Events in quadrant D | 4,270,764 | 284,278 |
| Mode SS | |||
|---|---|---|---|
| Quadrant | BADHDUFLAG | Total packets | Discarded packets |
| A | 0 | 84 | 2 |
| B | 0 | 84 | 0 |
| C | 0 | 84 | 0 |
| D | 0 | 84 | 0 |
| Mode M9 | |||
|---|---|---|---|
| Quadrant | BADHDUFLAG | Total packets | Discarded packets |
| A | 1 | 273359709408 | 0 |
| B | 1 | -1 | -1 |
| C | 1 | -1 | -1 |
| D | 1 | -1 | -1 |
| Mode M0 | |||
|---|---|---|---|
| Quadrant | BADHDUFLAG | Total packets | Discarded packets |
| A | 0 | 8690 | 72 |
| B | 0 | 8763 | 46 |
| C | 0 | 8517 | 82 |
| D | 0 | 16018 | 382 |
| Quadrant | Total seconds | Saturated seconds | Saturation percentage |
|---|---|---|---|
| A | 4173 | 50 | 1.198179% |
| B | 4186 | 44 | 1.051123% |
| C | 4167 | 25 | 0.599952% |
| D | 4144 | 868 | 20.945946% |
Noise dominated data is calculated using 1-second bins in cleaned event files. If a bin has >2000 counts, and if more than 50% of those come from <1% of pixels, then it is considered to be noise-dominated and hence unusable.
| Quadrant | # 1 sec bins | Bins with >0 counts | Bins with >2000 counts | High rate bins dominated by noise | Noise dominated (total time) | Noise dominated (detector-on time) | Marked lightcurve |
|---|---|---|---|---|---|---|---|
| A | 4207 | 4206 | 2 | 2 | 0.05% | 0.05% | 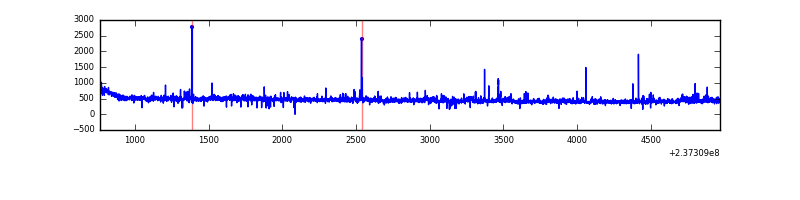 |
| B | 4207 | 4206 | 1 | 1 | 0.02% | 0.02% |  |
| C | 4207 | 4206 | 0 | 0 | 0.00% | 0.00% | 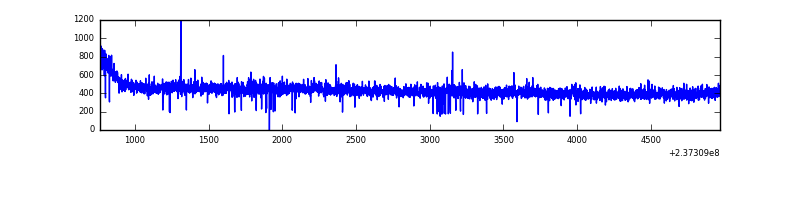 |
| D | 4207 | 4176 | 757 | 757 | 17.99% | 18.13% | 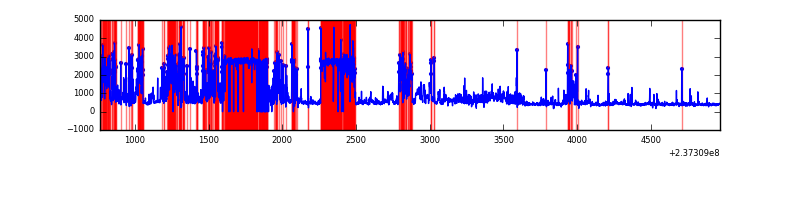 |
Top three noisy pixels from each quadrant. If the there are fewer than three noisy pixels in the level2.evt file, extra rows are filled as -1
| Pixel properties | Quadrant properties | ||||||
|---|---|---|---|---|---|---|---|
| Quadrant | DetID | PixID | Counts | Sigma | Mean | Median | Sigma |
| A | 1 | 162 | 47820 | 489.45 | 474 | 464 | 96.8 |
| A | 1 | 178 | 14131 | 141.26 | 474 | 464 | 96.8 |
| A | 1 | 161 | 13426 | 133.97 | 474 | 464 | 96.8 |
| B | 0 | 229 | 27625 | 295.37 | 477 | 465 | 92.0 |
| B | 0 | 214 | 24001 | 255.95 | 477 | 465 | 92.0 |
| B | 0 | 219 | 17227 | 182.29 | 477 | 465 | 92.0 |
| C | 13 | 61 | 3446 | 27.77 | 459 | 461 | 107.5 |
| C | 14 | 239 | 2659 | 20.45 | 459 | 461 | 107.5 |
| C | 12 | 4 | 2574 | 19.66 | 459 | 461 | 107.5 |
| D | 1 | 52 | 2312068 | 21945.7 | 389 | 380 | 105.3 |
| D | 13 | 137 | 219829 | 2083.31 | 389 | 380 | 105.3 |
| D | 7 | 71 | 119480 | 1130.66 | 389 | 380 | 105.3 |
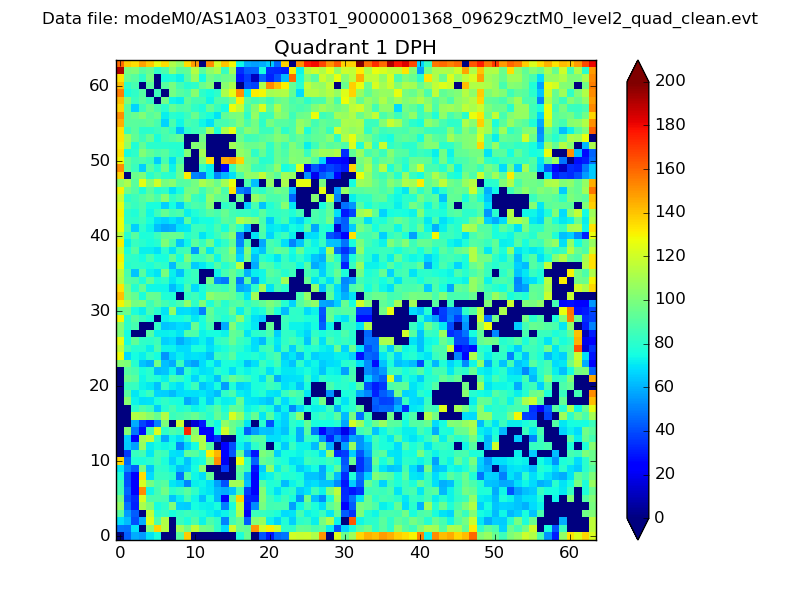
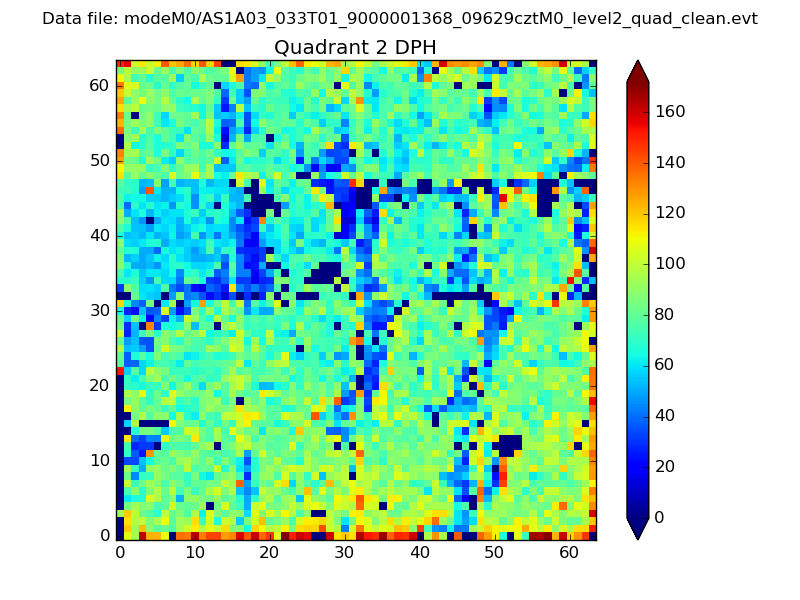
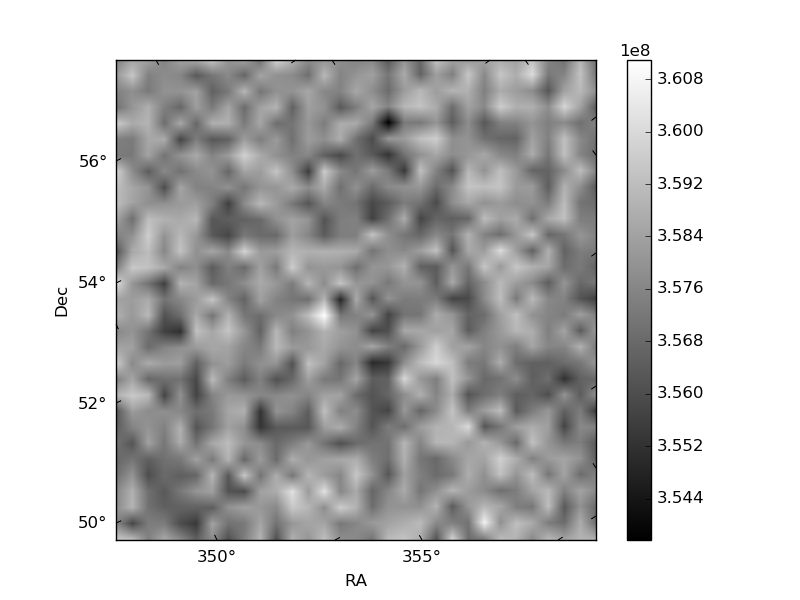
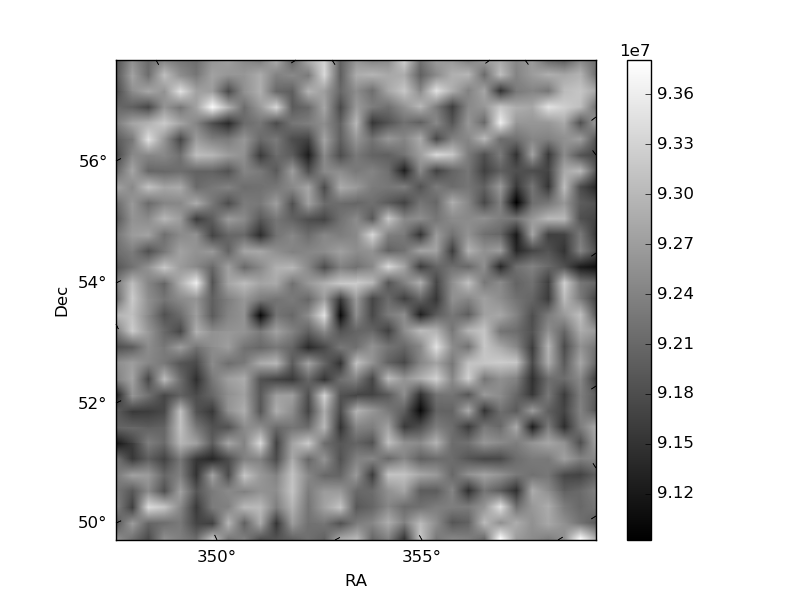
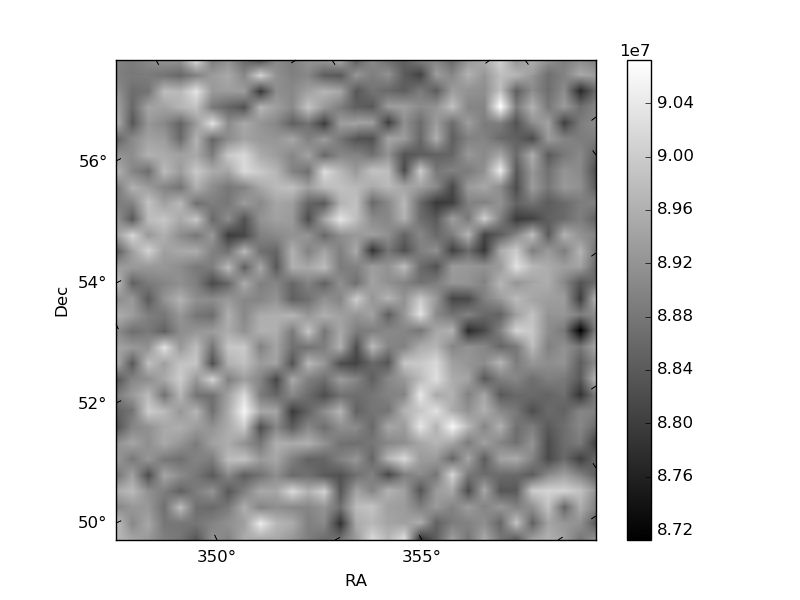
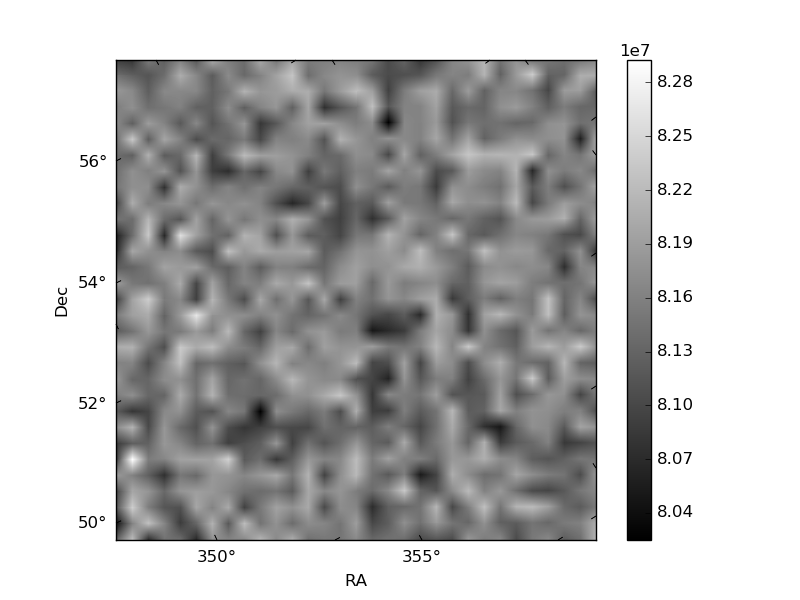
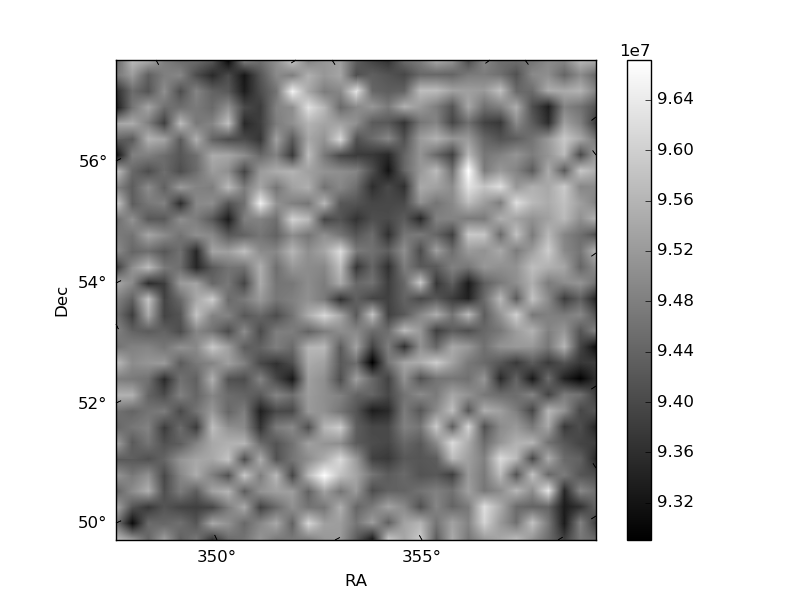
Histogram calculated using DETX and DETY for each event in the final _common_clean file
| Quadrant A | 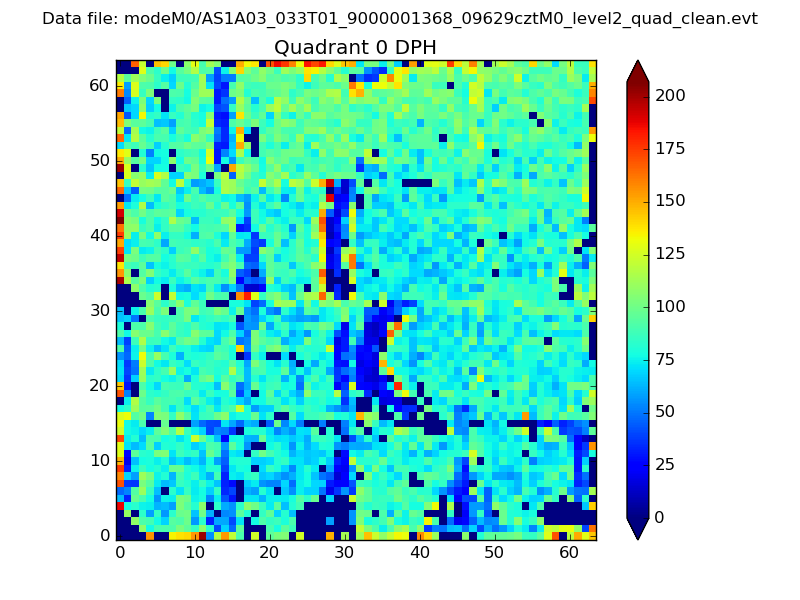 |
 |
Quadrant B |
|---|---|---|---|
| Quadrant D | 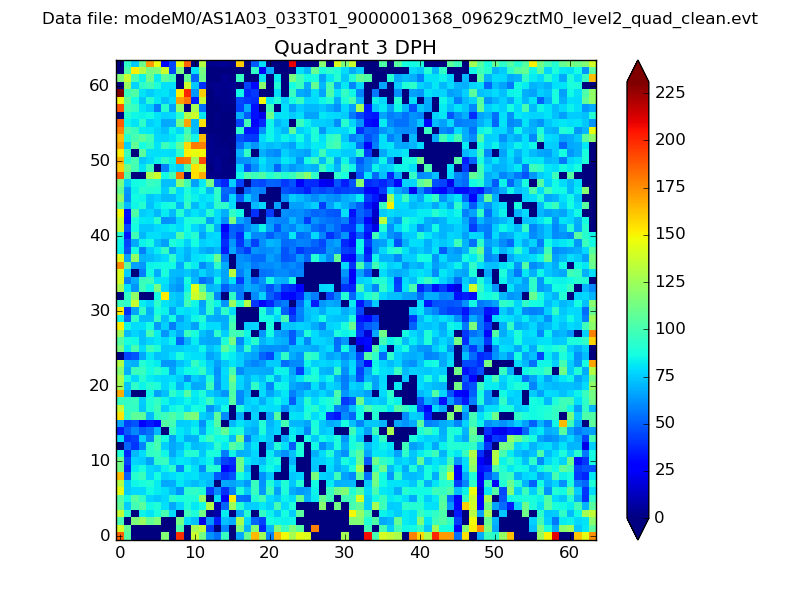 |
 |
Quadrant C |
| Plot type | Count rate plots | Images |
|---|---|---|
| Comparison with Poisson distribution Blue bars denote a histogram of data divided into 1 sec bins. Red curve is a Poisson curve with rate = median count rate of data. |
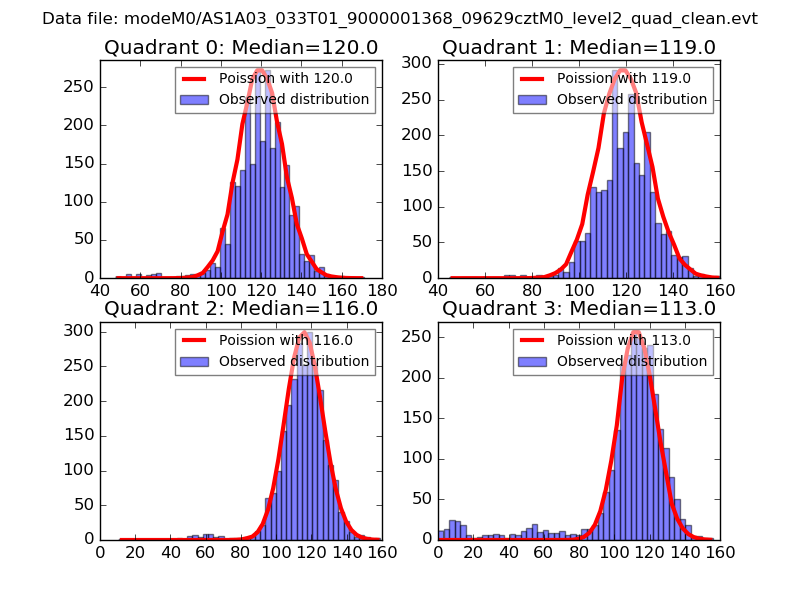 |
 |
| Quadrant-wise count rates Data is divided into 100 sec bins |
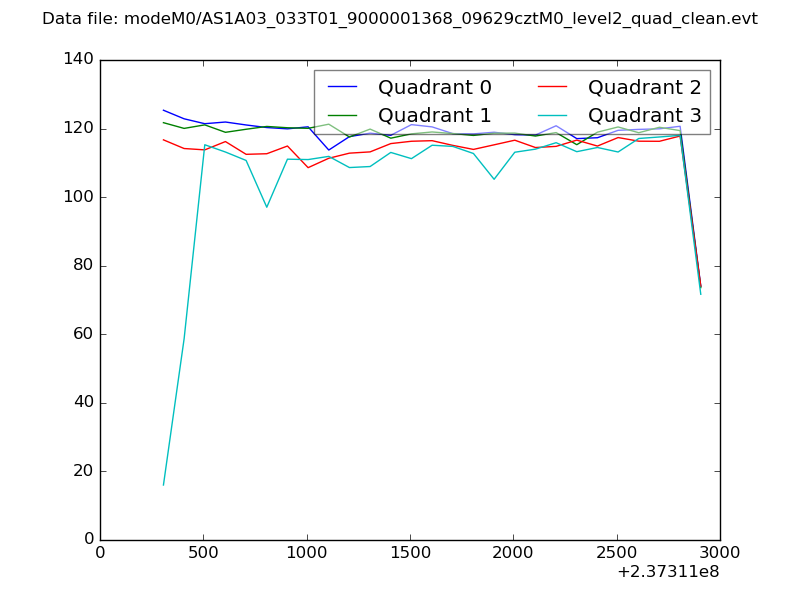 |
|
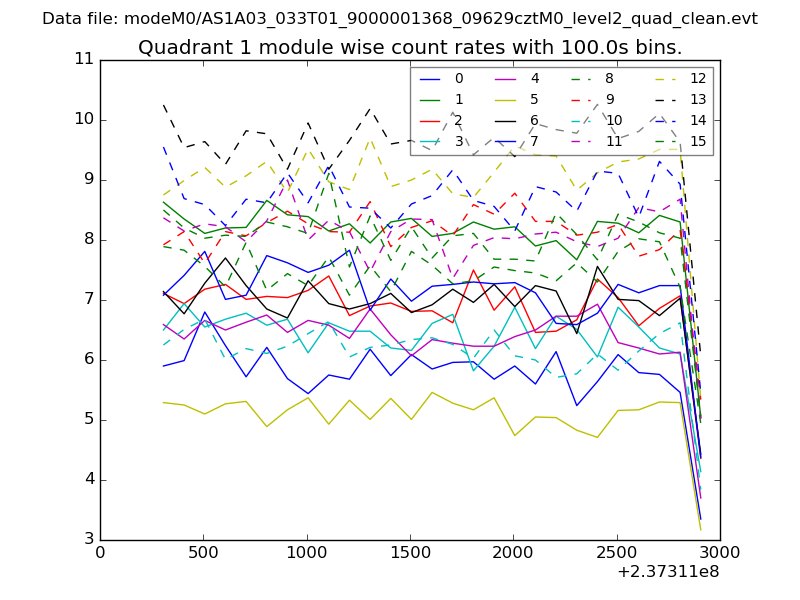
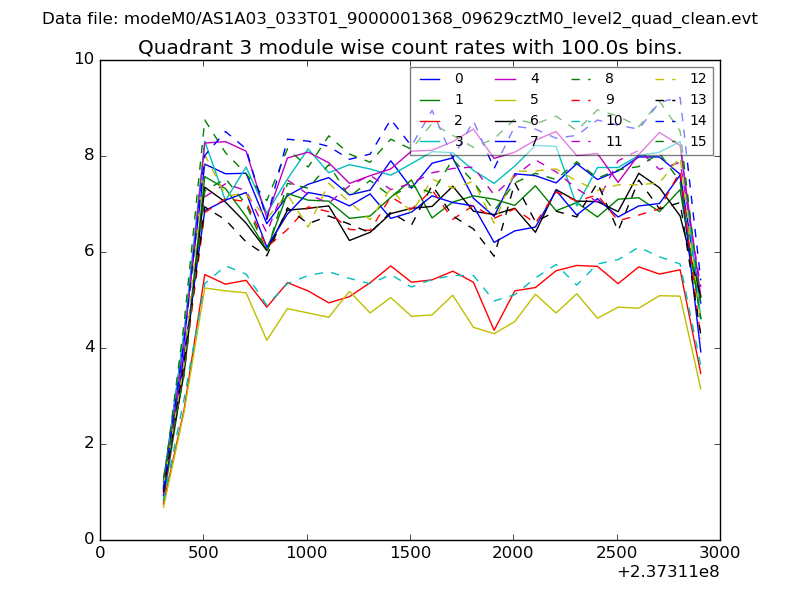
| Module-wise count rates for Quadrant A Data is divided into 100 sec bins |
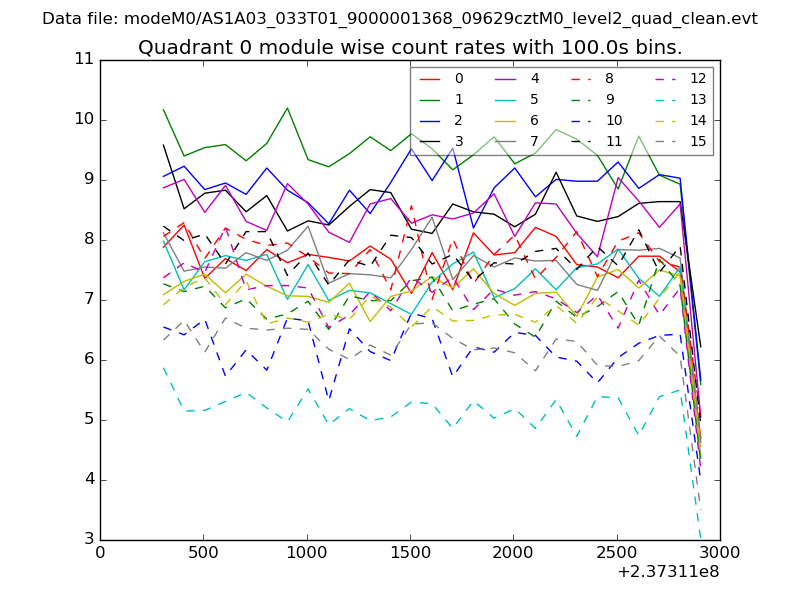 |
 |
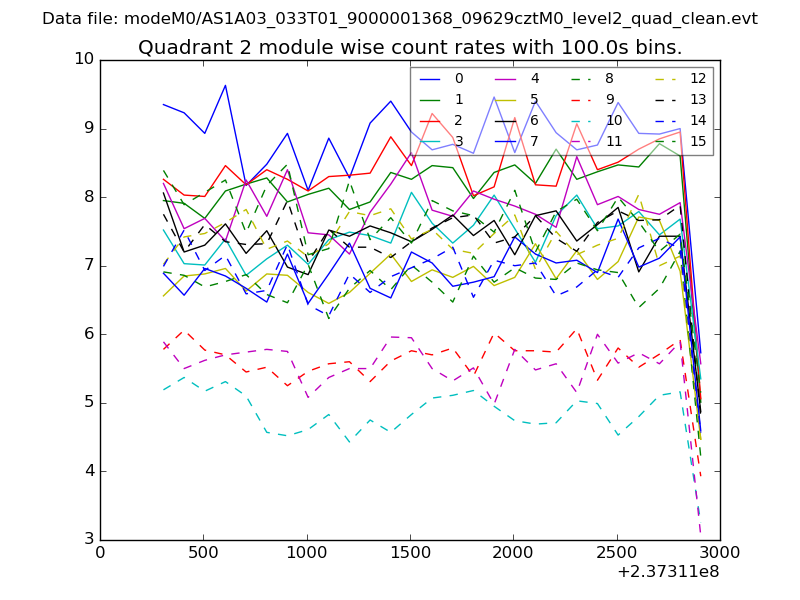
| Module-wise count rates for Quadrant B Data is divided into 100 sec bins |
 |
 |
| Module-wise count rates for Quadrant C Data is divided into 100 sec bins |
 |
 |
| Module-wise count rates for Quadrant D Data is divided into 100 sec bins |
 |
 |
| Parameter | Plot |
|---|---|
| CZT HV Monitor | 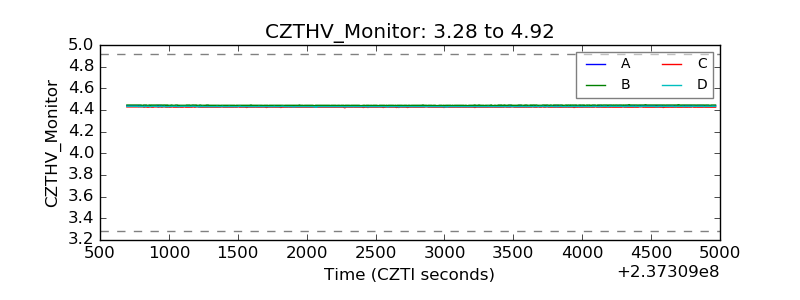 |
| D_VDD |  |
| Temperature 1 |  |
| Veto HV Monitor | 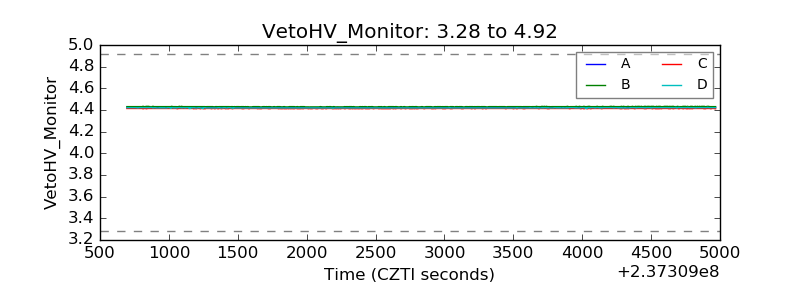 |
| Veto LLD | 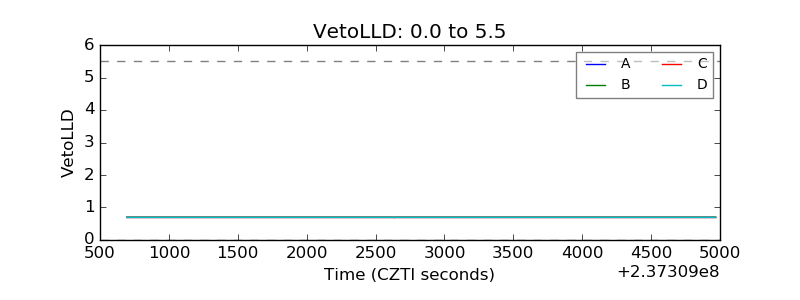 |
| Alpha Counter | 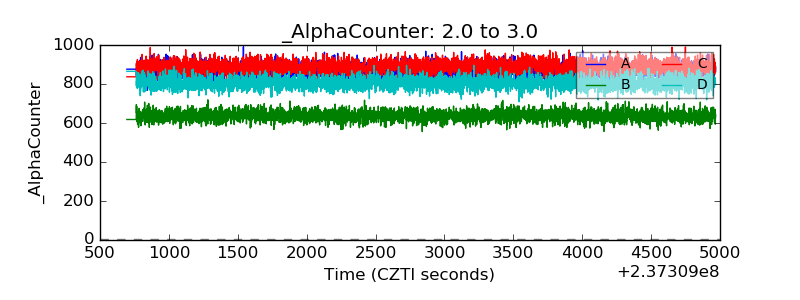 |
| _CPM_Rate | 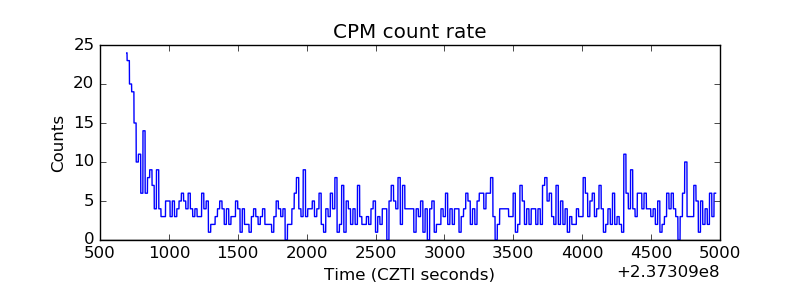 |
| CZT Counter | 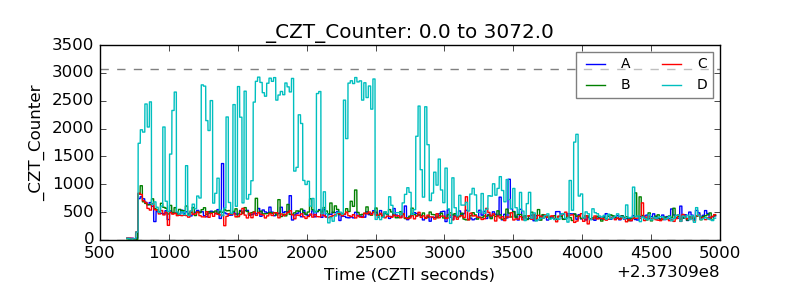 |
| +2.5 Volts monitor |  |
| +5 Volts monitor |  |
| _ROLL_ROT | 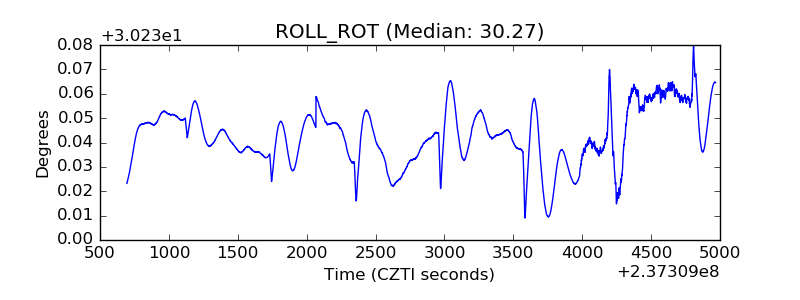 |
| _Roll_DEC |  |
| _Roll_RA | 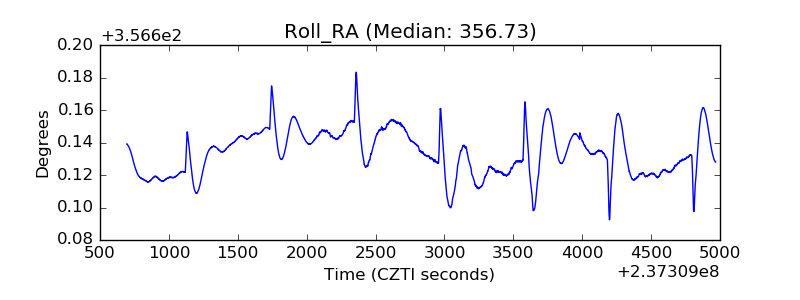 |
| Veto Counter | 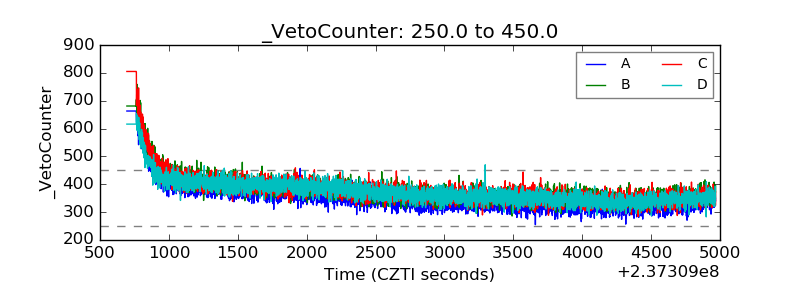 |