| Param | Original file | Final file |
|---|---|---|
| Filename | modeM0/AS1A03_077T01_9000001372cztM0_level2.fits | modeM0/AS1A03_077T01_9000001372cztM0_level2_quad_clean.evt |
| Size (bytes) | 741,507,840 | 639,817,920 |
| Size | 707.2 MB | 610.2 MB |
| Events in quadrant A | 4,810,076 | 3,923,084 |
| Events in quadrant B | 4,635,575 | 3,903,315 |
| Events in quadrant C | 4,767,434 | 3,802,581 |
| Events in quadrant D | 2,883,607 | 2,401,387 |
| Mode M9 | |||
|---|---|---|---|
| Quadrant | BADHDUFLAG | Total packets | Discarded packets |
| A | 0 | 185 | 0 |
| B | 0 | 183 | 0 |
| C | 0 | 165 | 0 |
| D | 0 | 180 | 0 |
| Mode SS | |||
|---|---|---|---|
| Quadrant | BADHDUFLAG | Total packets | Discarded packets |
| A | 0 | 1757 | 0 |
| B | 0 | 1792 | 0 |
| C | 0 | 1767 | 0 |
| D | 0 | 1831 | 0 |
| Mode M0 | |||
|---|---|---|---|
| Quadrant | BADHDUFLAG | Total packets | Discarded packets |
| A | 0 | 169405 | 0 |
| B | 0 | 172261 | 0 |
| C | 0 | 169183 | 0 |
| D | 0 | 150279 | 0 |
| Quadrant | Total seconds | Saturated seconds | Saturation percentage |
|---|---|---|---|
| A | 82552 | 685 | 0.829780% |
| B | 82289 | 828 | 1.006210% |
| C | 82778 | 510 | 0.616106% |
| D | 61271 | 1319 | 2.152731% |
Noise dominated data is calculated using 1-second bins in cleaned event files. If a bin has >2000 counts, and if more than 50% of those come from <1% of pixels, then it is considered to be noise-dominated and hence unusable.
| Quadrant | # 1 sec bins | Bins with >0 counts | Bins with >2000 counts | High rate bins dominated by noise | Noise dominated (total time) | Noise dominated (detector-on time) | Marked lightcurve |
|---|---|---|---|---|---|---|---|
| A | 160910 | 94032 | 0 | 0 | 0.00% | 0.00% |  |
| B | 160908 | 93685 | 0 | 0 | 0.00% | 0.00% |  |
| C | 160910 | 94204 | 0 | 0 | 0.00% | 0.00% |  |
| D | 111711 | 68303 | 0 | 0 | 0.00% | 0.00% |  |
Top three noisy pixels from each quadrant. If the there are fewer than three noisy pixels in the level2.evt file, extra rows are filled as -1
| Pixel properties | Quadrant properties | ||||||
|---|---|---|---|---|---|---|---|
| Quadrant | DetID | PixID | Counts | Sigma | Mean | Median | Sigma |
| A | 0 | 29 | 4698 | 11.23 | 1251 | 1170 | 314.1 |
| A | 7 | 110 | 3954 | 8.86 | 1251 | 1170 | 314.1 |
| A | 0 | 30 | 3600 | 7.73 | 1251 | 1170 | 314.1 |
| B | 2 | 9 | 3905 | 11.28 | 1222 | 1163 | 243.1 |
| B | 12 | 226 | 3094 | 7.94 | 1222 | 1163 | 243.1 |
| B | 14 | 254 | 3067 | 7.83 | 1222 | 1163 | 243.1 |
| C | 1 | 80 | 3548 | 7.26 | 1258 | 1169 | 327.5 |
| C | 1 | 81 | 3438 | 6.93 | 1258 | 1169 | 327.5 |
| C | 12 | 241 | 3369 | 6.72 | 1258 | 1169 | 327.5 |
| D | 6 | 231 | 2093 | 6.43 | 822 | 754 | 208.2 |
| D | 3 | 14 | 2068 | 6.31 | 822 | 754 | 208.2 |
| D | 10 | 189 | 1993 | 5.95 | 822 | 754 | 208.2 |
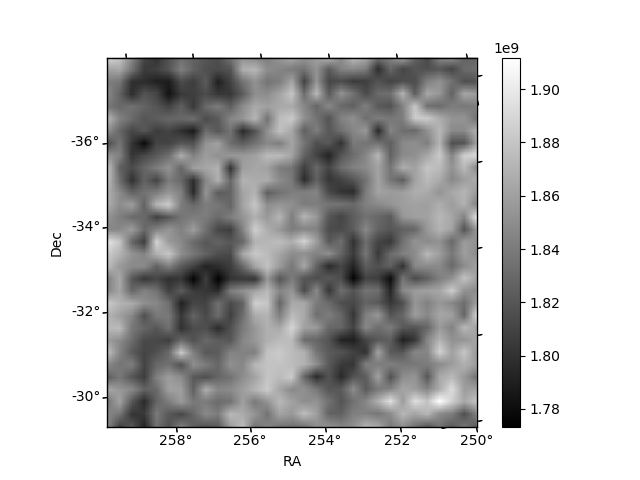
Histogram calculated using DETX and DETY for each event in the final _common_clean file
| Quadrant A |  |
 |
Quadrant B |
|---|---|---|---|
| Quadrant D | 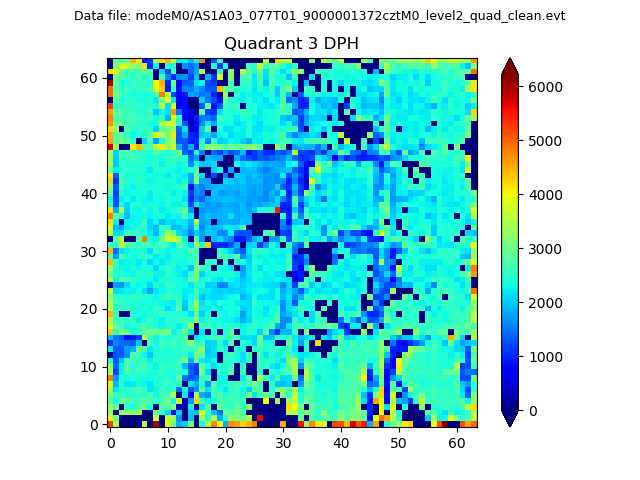 |
 |
Quadrant C |
| Plot type | Count rate plots | Images |
|---|---|---|
| Comparison with Poisson distribution Blue bars denote a histogram of data divided into 1 sec bins. Red curve is a Poisson curve with rate = median count rate of data. |
 |
 |
| Quadrant-wise count rates Data is divided into 100 sec bins |
 |
|
| Module-wise count rates for Quadrant A Data is divided into 100 sec bins |
 |
 |
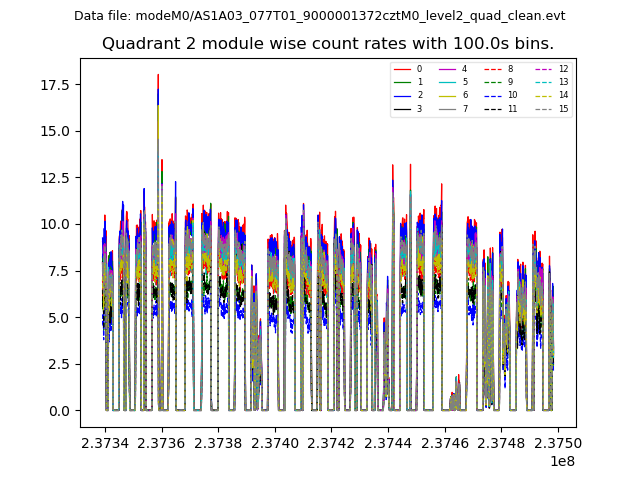
| Module-wise count rates for Quadrant B Data is divided into 100 sec bins |
 |
 |
| Module-wise count rates for Quadrant C Data is divided into 100 sec bins |
 |
 |
| Module-wise count rates for Quadrant D Data is divided into 100 sec bins |
 |
 |
| Parameter | Plot |
|---|---|
| CZT HV Monitor |  |
| D_VDD |  |
| Temperature 1 | 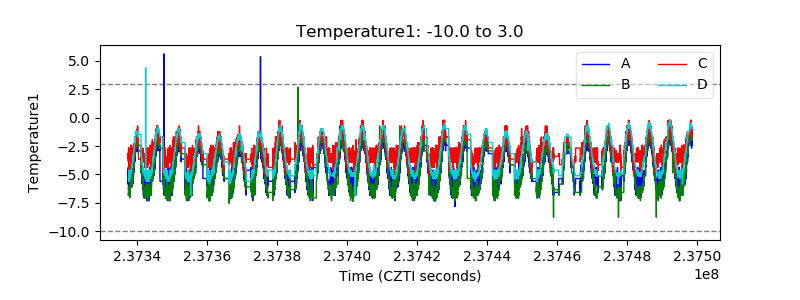 |
| Veto HV Monitor |  |
| Veto LLD |  |
| Alpha Counter |  |
| _CPM_Rate |  |
| CZT Counter |  |
| +2.5 Volts monitor | 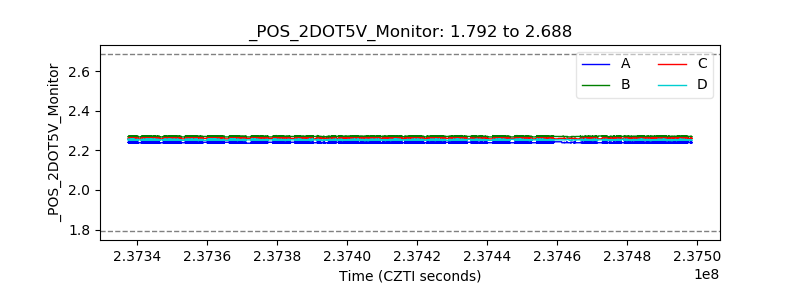 |
| +5 Volts monitor |  |
| _ROLL_ROT |  |
| _Roll_DEC |  |
| _Roll_RA |  |
| Veto Counter |  |