| Param | Original file | Final file |
|---|---|---|
| Filename | modeM0/AS1A03_077T01_9000001372_09633cztM0_level2.evt | modeM0/AS1A03_077T01_9000001372_09633cztM0_level2_quad_clean.evt |
| Size (bytes) | 261,610,560 | 51,422,400 |
| Size | 249.5 MB | 49.0 MB |
| Events in quadrant A | 1,847,415 | 324,462 |
| Events in quadrant B | 1,946,050 | 326,183 |
| Events in quadrant C | 1,785,477 | 318,306 |
| Events in quadrant D | 2,071,979 | 308,038 |
| Mode M9 | |||
|---|---|---|---|
| Quadrant | BADHDUFLAG | Total packets | Discarded packets |
| A | 0 | 7 | 1 |
| B | 0 | 7 | 0 |
| C | 0 | 7 | 0 |
| D | 0 | 7 | 0 |
| Mode SS | |||
|---|---|---|---|
| Quadrant | BADHDUFLAG | Total packets | Discarded packets |
| A | 0 | 90 | 4 |
| B | 0 | 90 | 8 |
| C | 0 | 90 | 6 |
| D | 0 | 90 | 8 |
| Mode M0 | |||
|---|---|---|---|
| Quadrant | BADHDUFLAG | Total packets | Discarded packets |
| A | 0 | 8928 | 851 |
| B | 0 | 9170 | 865 |
| C | 0 | 8838 | 898 |
| D | 0 | 9899 | 1081 |
| Quadrant | Total seconds | Saturated seconds | Saturation percentage |
|---|---|---|---|
| A | 3964 | 24 | 0.605449% |
| B | 3963 | 22 | 0.555135% |
| C | 3934 | 9 | 0.228775% |
| D | 3953 | 45 | 1.138376% |
Noise dominated data is calculated using 1-second bins in cleaned event files. If a bin has >2000 counts, and if more than 50% of those come from <1% of pixels, then it is considered to be noise-dominated and hence unusable.
| Quadrant | # 1 sec bins | Bins with >0 counts | Bins with >2000 counts | High rate bins dominated by noise | Noise dominated (total time) | Noise dominated (detector-on time) | Marked lightcurve |
|---|---|---|---|---|---|---|---|
| A | 5119 | 4317 | 0 | 0 | 0.00% | 0.00% | 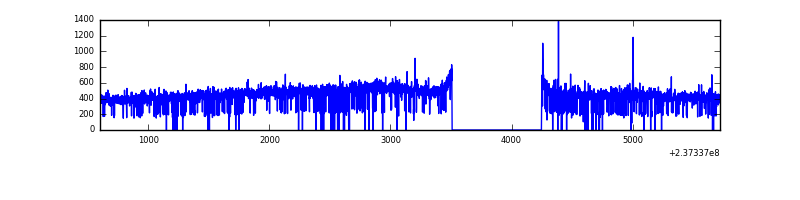 |
| B | 5119 | 4334 | 0 | 0 | 0.00% | 0.00% | 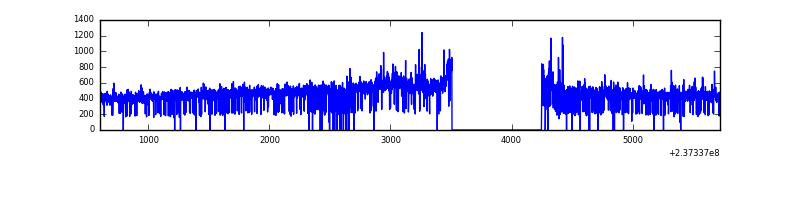 |
| C | 5119 | 4320 | 0 | 0 | 0.00% | 0.00% | 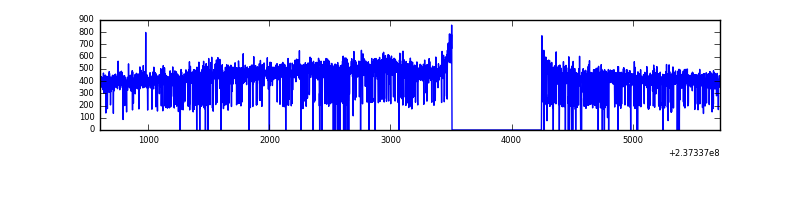 |
| D | 5119 | 4315 | 23 | 23 | 0.45% | 0.53% | 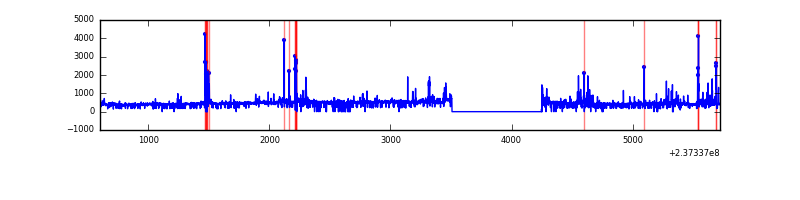 |
Top three noisy pixels from each quadrant. If the there are fewer than three noisy pixels in the level2.evt file, extra rows are filled as -1
| Pixel properties | Quadrant properties | ||||||
|---|---|---|---|---|---|---|---|
| Quadrant | DetID | PixID | Counts | Sigma | Mean | Median | Sigma |
| A | 14 | 111 | 7310 | 68.09 | 477 | 466 | 100.5 |
| A | 0 | 226 | 4331 | 38.45 | 477 | 466 | 100.5 |
| A | 13 | 248 | 3954 | 34.7 | 477 | 466 | 100.5 |
| B | 0 | 214 | 41353 | 432.44 | 477 | 465 | 94.6 |
| B | 0 | 229 | 13778 | 140.8 | 477 | 465 | 94.6 |
| B | 0 | 219 | 12911 | 131.63 | 477 | 465 | 94.6 |
| C | 13 | 61 | 3504 | 28.27 | 457 | 460 | 107.7 |
| C | 14 | 67 | 1662 | 11.16 | 457 | 460 | 107.7 |
| C | 3 | 202 | 1074 | 5.7 | 457 | 460 | 107.7 |
| D | 12 | 233 | 84332 | 748.44 | 455 | 443 | 112.1 |
| D | 2 | 14 | 69370 | 614.95 | 455 | 443 | 112.1 |
| D | 1 | 52 | 45098 | 398.4 | 455 | 443 | 112.1 |
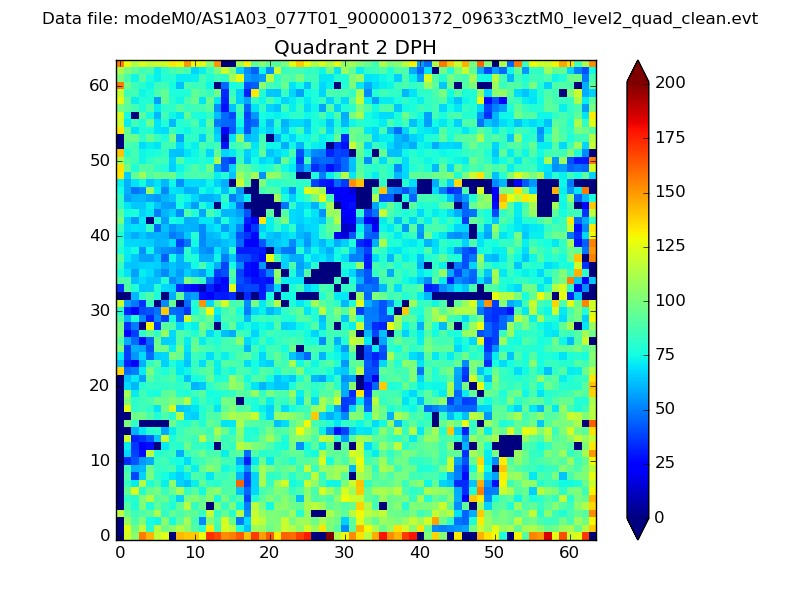
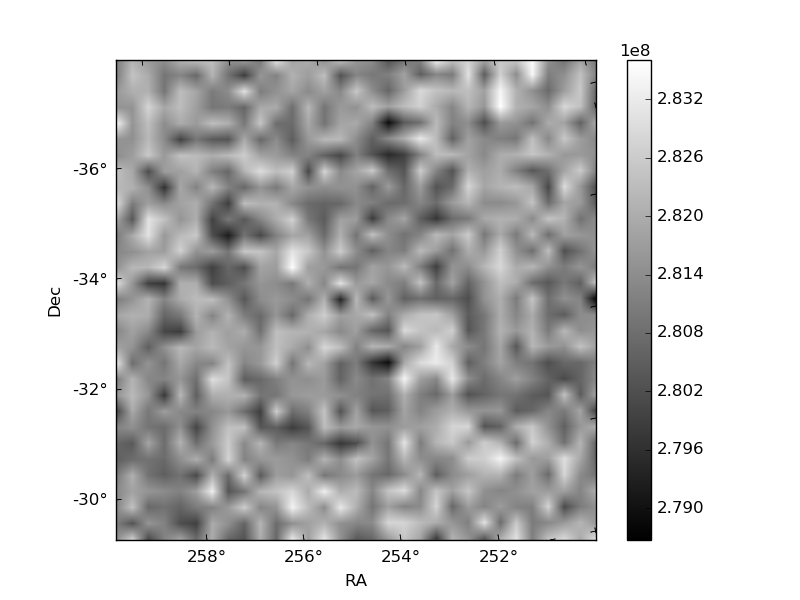
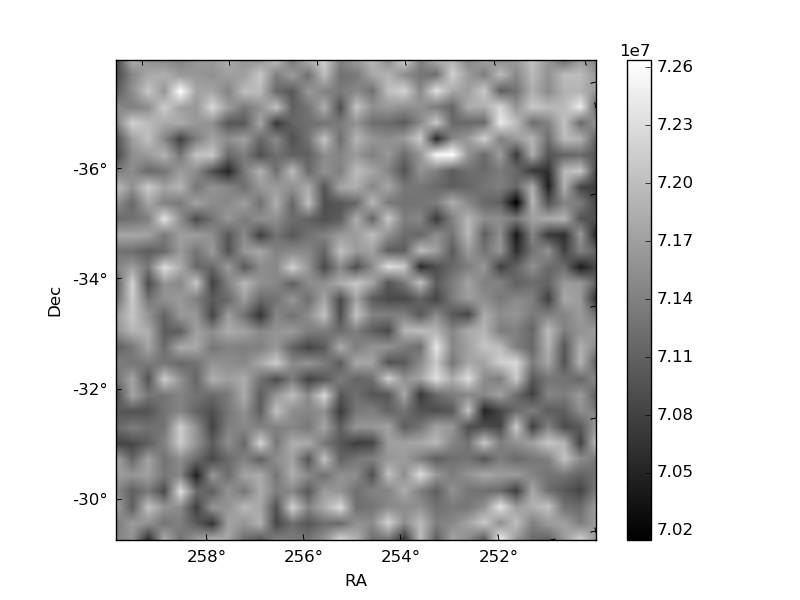
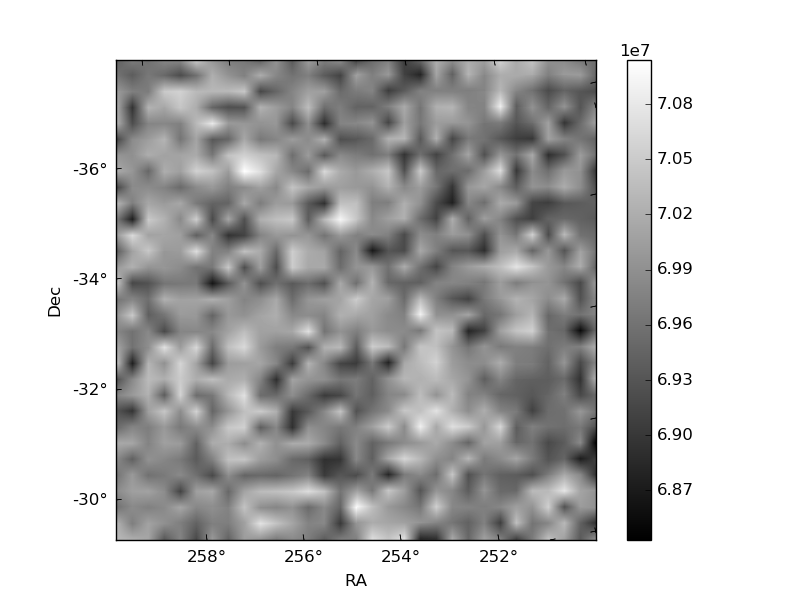
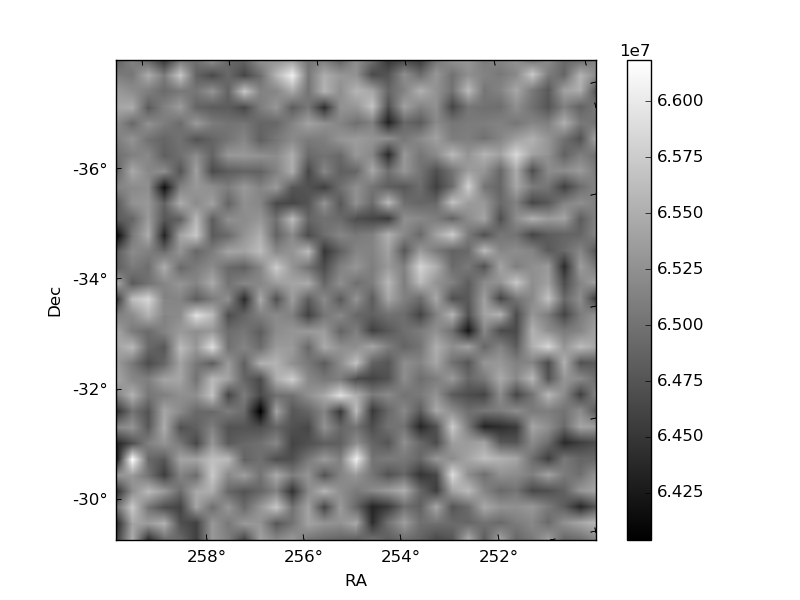
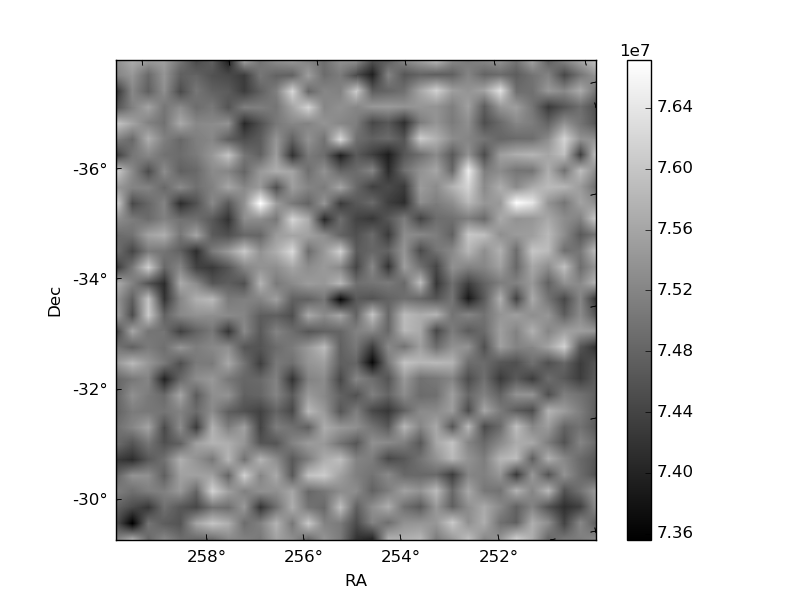
Histogram calculated using DETX and DETY for each event in the final _common_clean file
| Quadrant A | 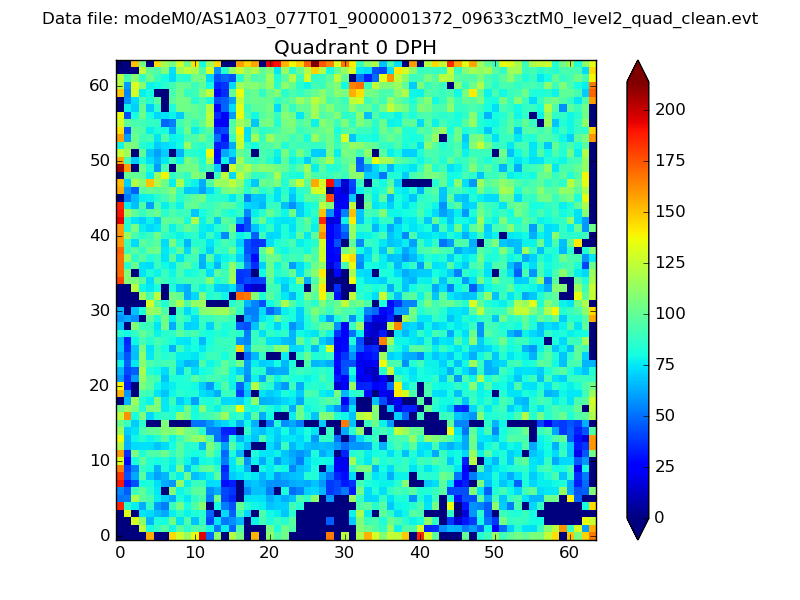 |
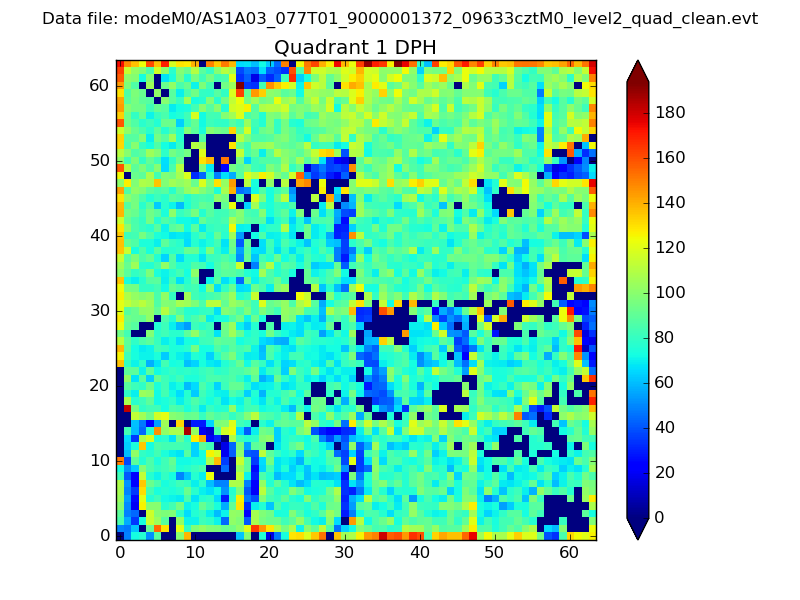 |
Quadrant B |
|---|---|---|---|
| Quadrant D | 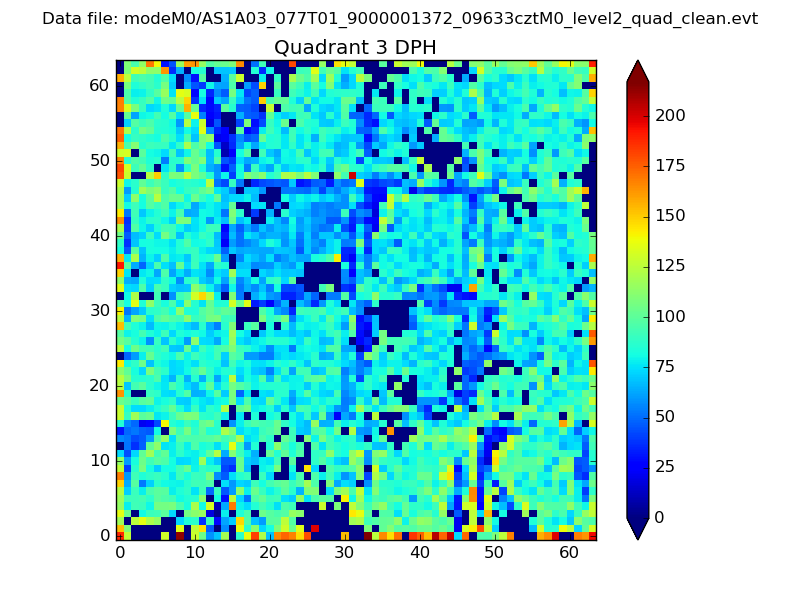 |
 |
Quadrant C |
| Plot type | Count rate plots | Images |
|---|---|---|
| Comparison with Poisson distribution Blue bars denote a histogram of data divided into 1 sec bins. Red curve is a Poisson curve with rate = median count rate of data. |
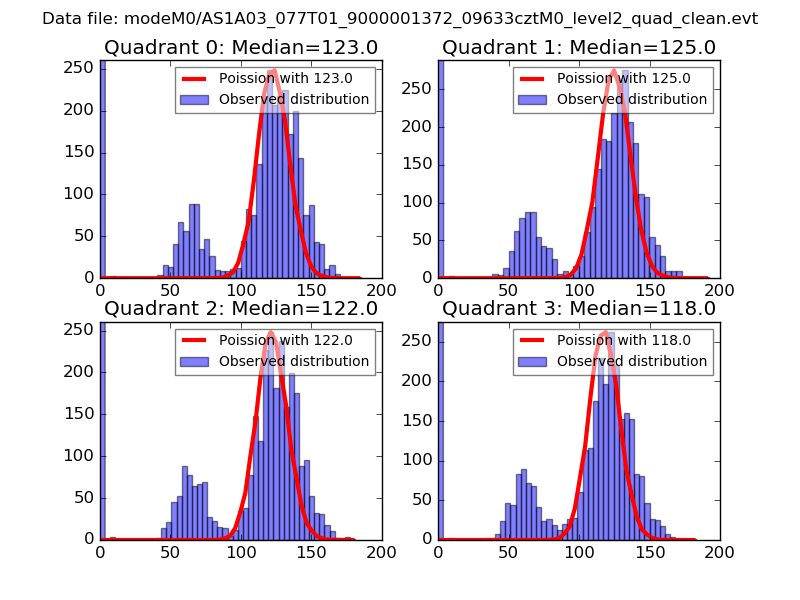 |
 |
| Quadrant-wise count rates Data is divided into 100 sec bins |
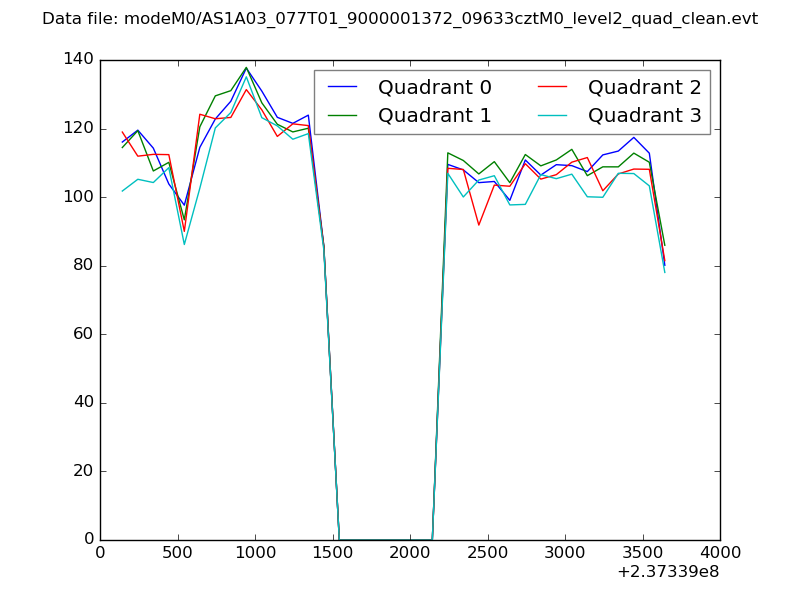 |
|
| Module-wise count rates for Quadrant A Data is divided into 100 sec bins |
 |
 |
| Module-wise count rates for Quadrant B Data is divided into 100 sec bins |
 |
 |
| Module-wise count rates for Quadrant C Data is divided into 100 sec bins |
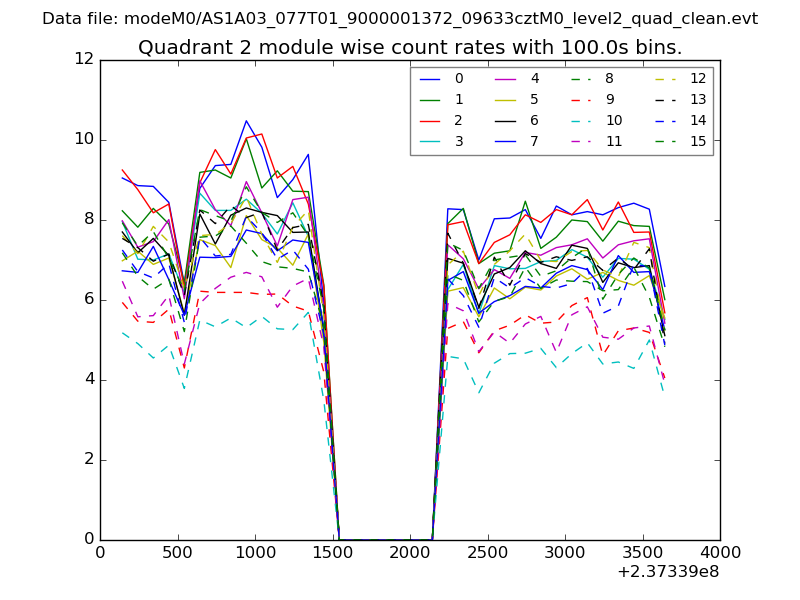 |
 |
| Module-wise count rates for Quadrant D Data is divided into 100 sec bins |
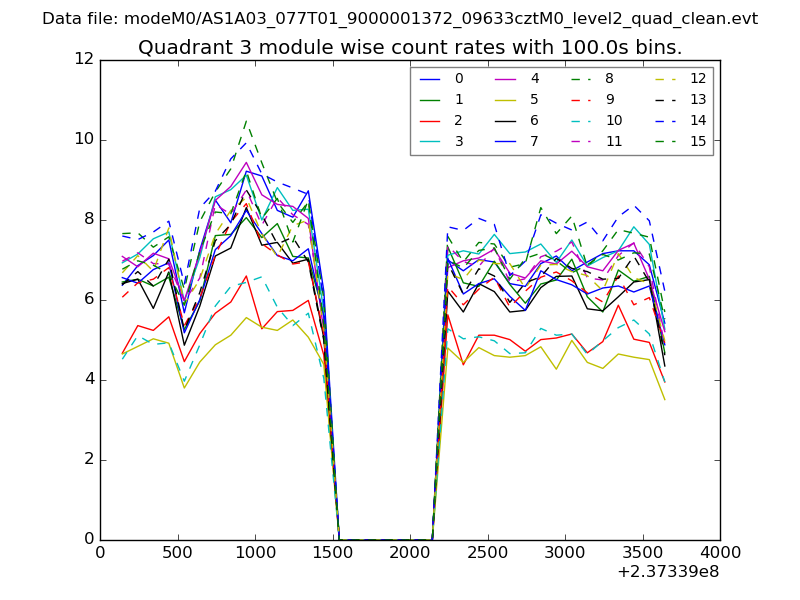 |
 |
| Parameter | Plot |
|---|---|
| CZT HV Monitor | 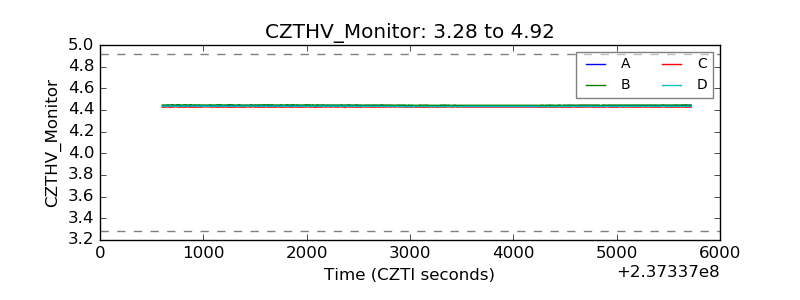 |
| D_VDD |  |
| Temperature 1 | 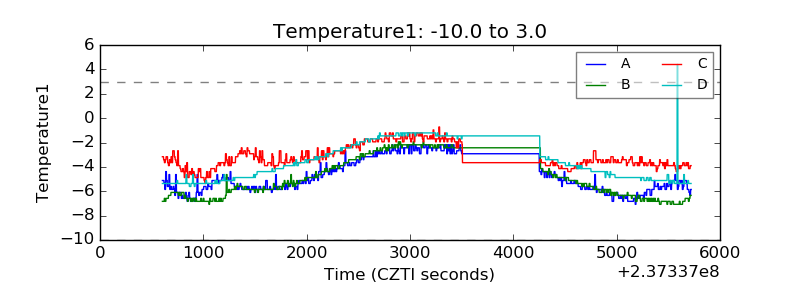 |
| Veto HV Monitor | 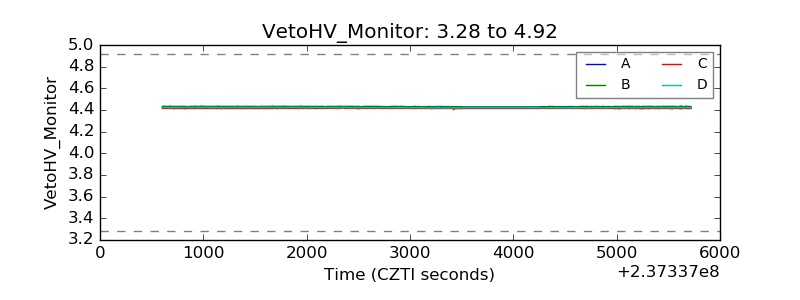 |
| Veto LLD | 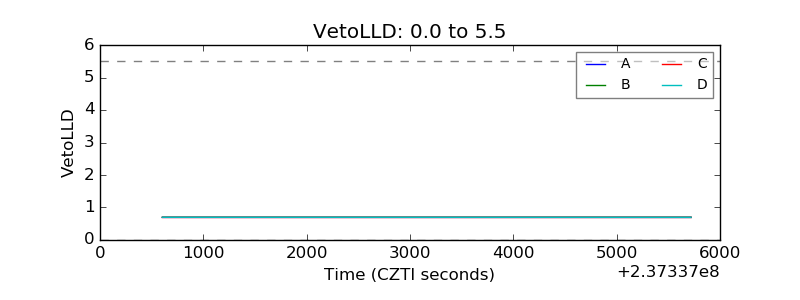 |
| Alpha Counter | 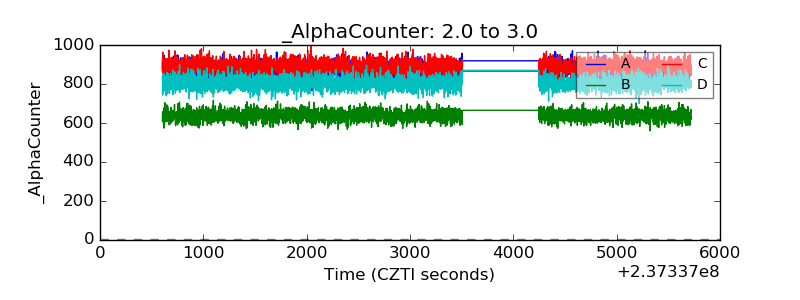 |
| _CPM_Rate | 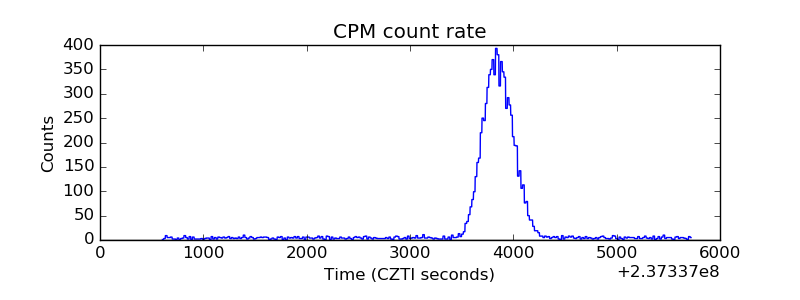 |
| CZT Counter | 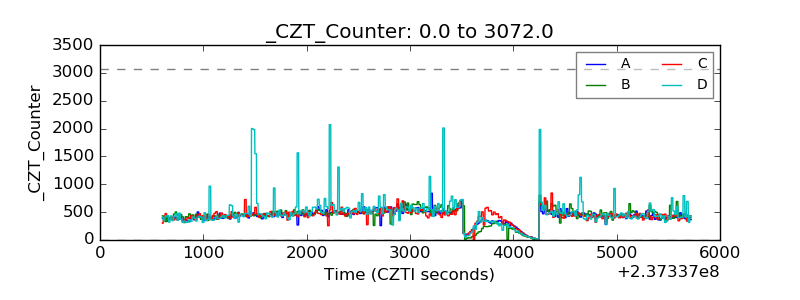 |
| +2.5 Volts monitor |  |
| +5 Volts monitor |  |
| _ROLL_ROT | 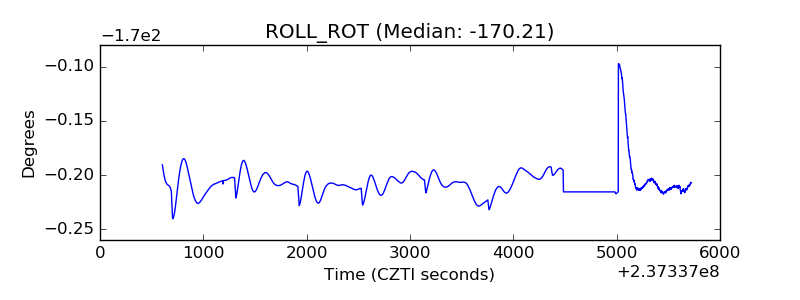 |
| _Roll_DEC | 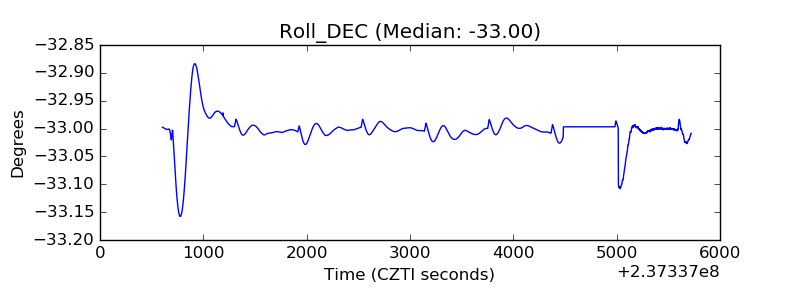 |
| _Roll_RA | 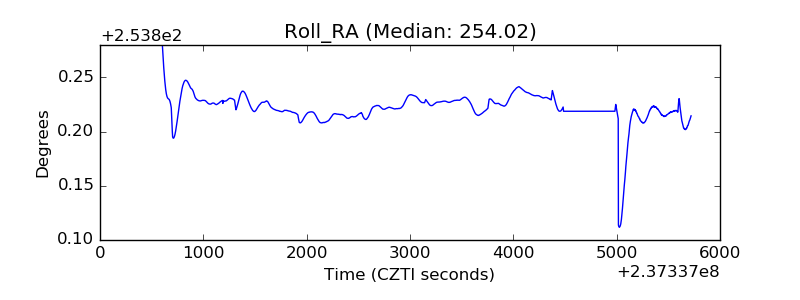 |
| Veto Counter |  |