| Param | Original file | Final file |
|---|---|---|
| Filename | modeM0/AS1A03_077T01_9000001372_09634cztM0_level2.evt | modeM0/AS1A03_077T01_9000001372_09634cztM0_level2_quad_clean.evt |
| Size (bytes) | 492,416,640 | 97,418,880 |
| Size | 469.6 MB | 92.9 MB |
| Events in quadrant A | 3,366,950 | 617,296 |
| Events in quadrant B | 3,562,803 | 618,460 |
| Events in quadrant C | 3,279,303 | 609,715 |
| Events in quadrant D | 4,201,831 | 590,472 |
| Mode M9 | |||
|---|---|---|---|
| Quadrant | BADHDUFLAG | Total packets | Discarded packets |
| A | 0 | 16 | 0 |
| B | 0 | 16 | 0 |
| C | 0 | 16 | 0 |
| D | 0 | 16 | 0 |
| Mode SS | |||
|---|---|---|---|
| Quadrant | BADHDUFLAG | Total packets | Discarded packets |
| A | 0 | 154 | 0 |
| B | 0 | 154 | 2 |
| C | 0 | 154 | 0 |
| D | 0 | 154 | 0 |
| Mode M0 | |||
|---|---|---|---|
| Quadrant | BADHDUFLAG | Total packets | Discarded packets |
| A | 0 | 15050 | 27 |
| B | 0 | 15521 | 22 |
| C | 0 | 14972 | 48 |
| D | 0 | 17690 | 40 |
| Quadrant | Total seconds | Saturated seconds | Saturation percentage |
|---|---|---|---|
| A | 7388 | 34 | 0.460206% |
| B | 7389 | 45 | 0.609013% |
| C | 7377 | 23 | 0.311780% |
| D | 7382 | 110 | 1.490111% |
Noise dominated data is calculated using 1-second bins in cleaned event files. If a bin has >2000 counts, and if more than 50% of those come from <1% of pixels, then it is considered to be noise-dominated and hence unusable.
| Quadrant | # 1 sec bins | Bins with >0 counts | Bins with >2000 counts | High rate bins dominated by noise | Noise dominated (total time) | Noise dominated (detector-on time) | Marked lightcurve |
|---|---|---|---|---|---|---|---|
| A | 9034 | 7401 | 0 | 0 | 0.00% | 0.00% | 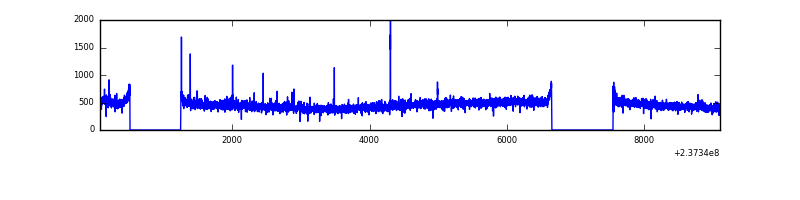 |
| B | 9034 | 7401 | 1 | 1 | 0.01% | 0.01% |  |
| C | 9034 | 7401 | 0 | 0 | 0.00% | 0.00% | 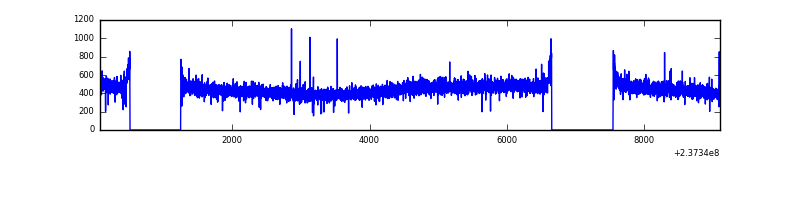 |
| D | 9034 | 7401 | 62 | 62 | 0.69% | 0.84% |  |
Top three noisy pixels from each quadrant. If the there are fewer than three noisy pixels in the level2.evt file, extra rows are filled as -1
| Pixel properties | Quadrant properties | ||||||
|---|---|---|---|---|---|---|---|
| Quadrant | DetID | PixID | Counts | Sigma | Mean | Median | Sigma |
| A | 14 | 111 | 24410 | 132.38 | 867 | 847 | 178.0 |
| A | 0 | 226 | 8093 | 40.71 | 867 | 847 | 178.0 |
| A | 13 | 253 | 7441 | 37.05 | 867 | 847 | 178.0 |
| B | 0 | 214 | 94538 | 551.0 | 872 | 849 | 170.0 |
| B | 0 | 229 | 33486 | 191.94 | 872 | 849 | 170.0 |
| B | 12 | 111 | 18730 | 105.16 | 872 | 849 | 170.0 |
| C | 13 | 61 | 6313 | 27.75 | 838 | 843 | 197.1 |
| C | 14 | 234 | 6171 | 27.03 | 838 | 843 | 197.1 |
| C | 14 | 67 | 2676 | 9.3 | 838 | 843 | 197.1 |
| D | 8 | 195 | 200189 | 996.7 | 827 | 809 | 200.0 |
| D | 12 | 233 | 161218 | 801.89 | 827 | 809 | 200.0 |
| D | 10 | 172 | 157398 | 782.79 | 827 | 809 | 200.0 |
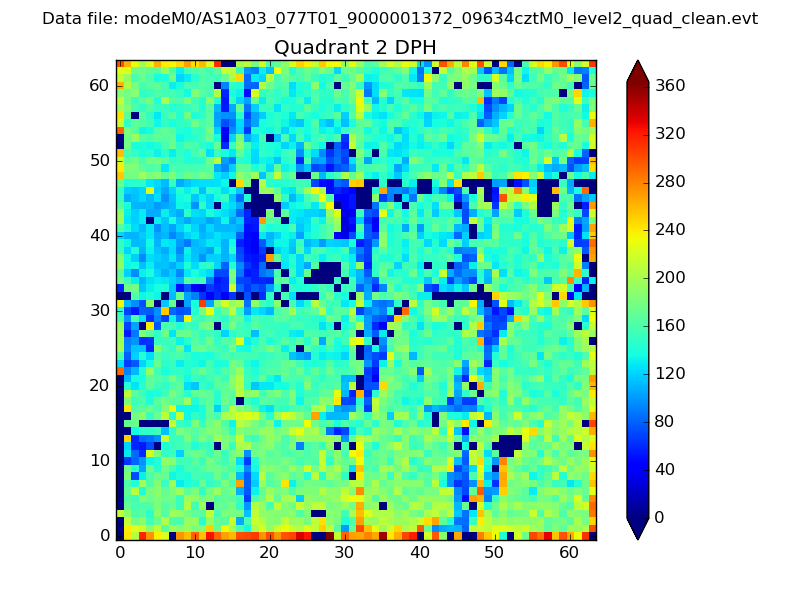
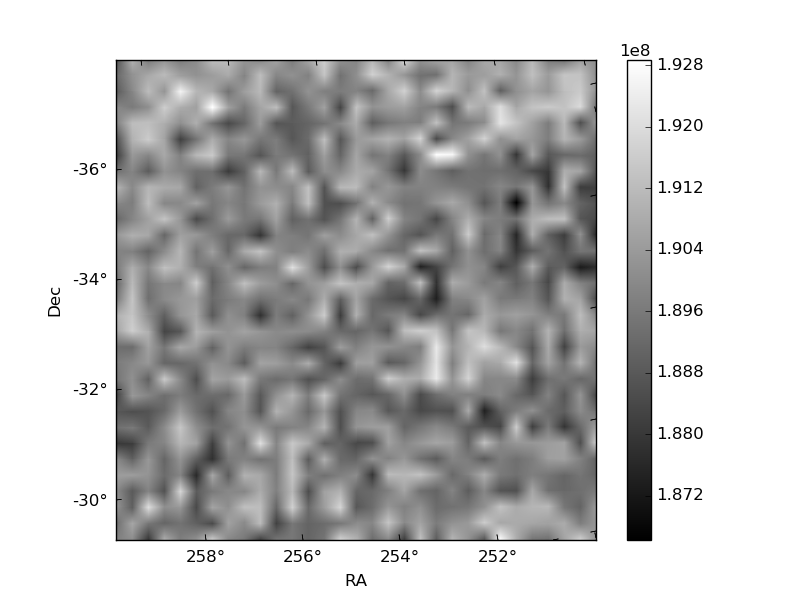
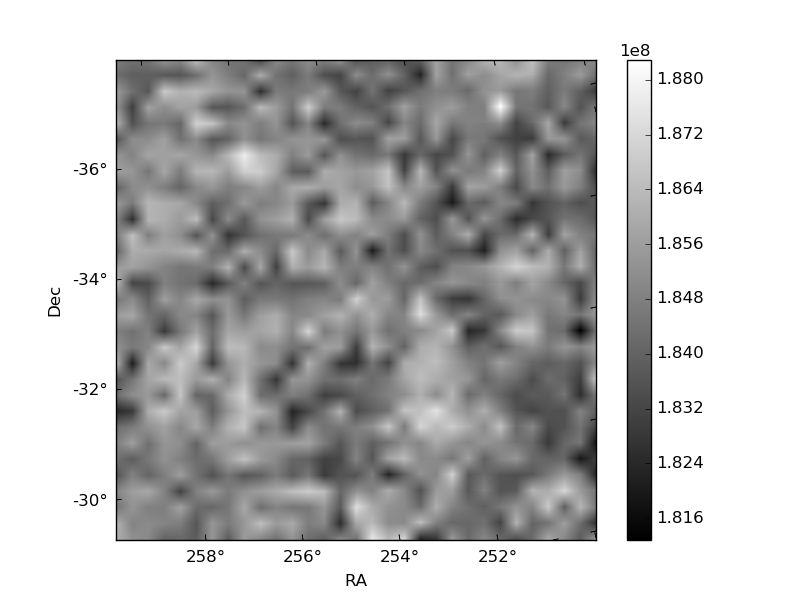
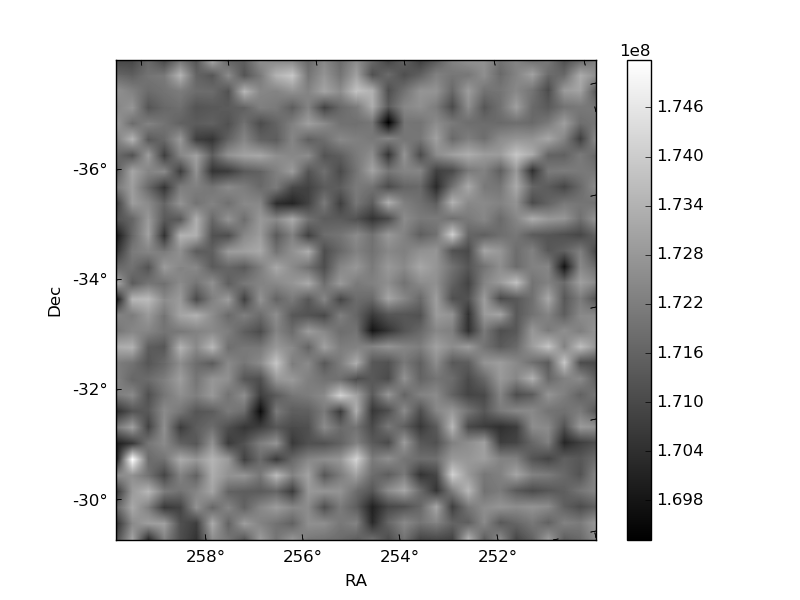
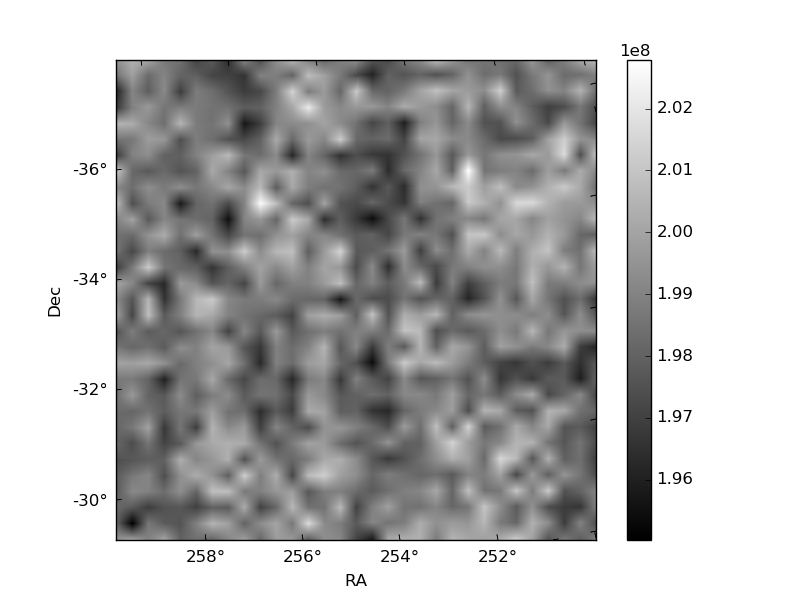
Histogram calculated using DETX and DETY for each event in the final _common_clean file
| Quadrant A | 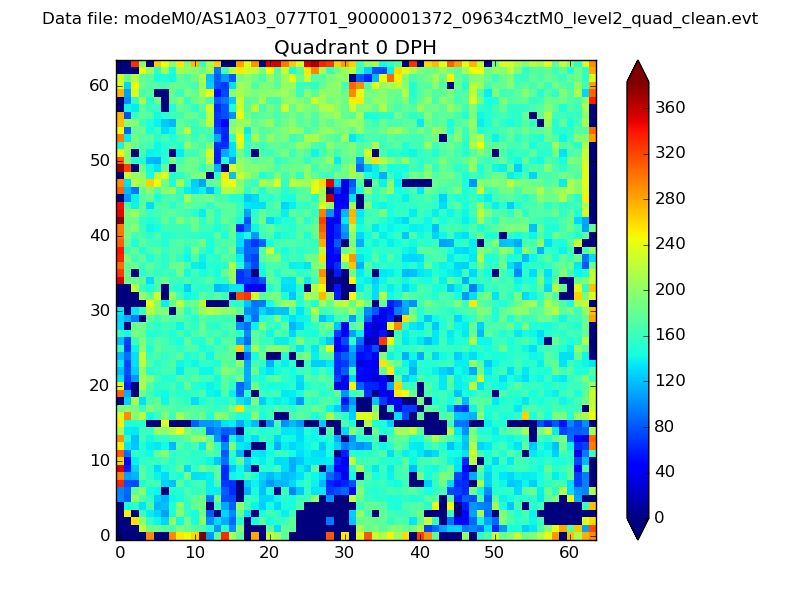 |
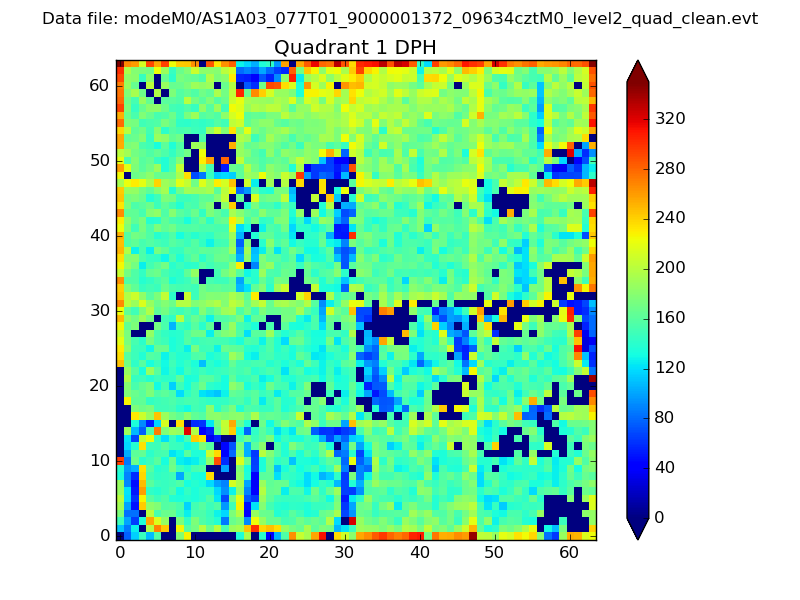 |
Quadrant B |
|---|---|---|---|
| Quadrant D | 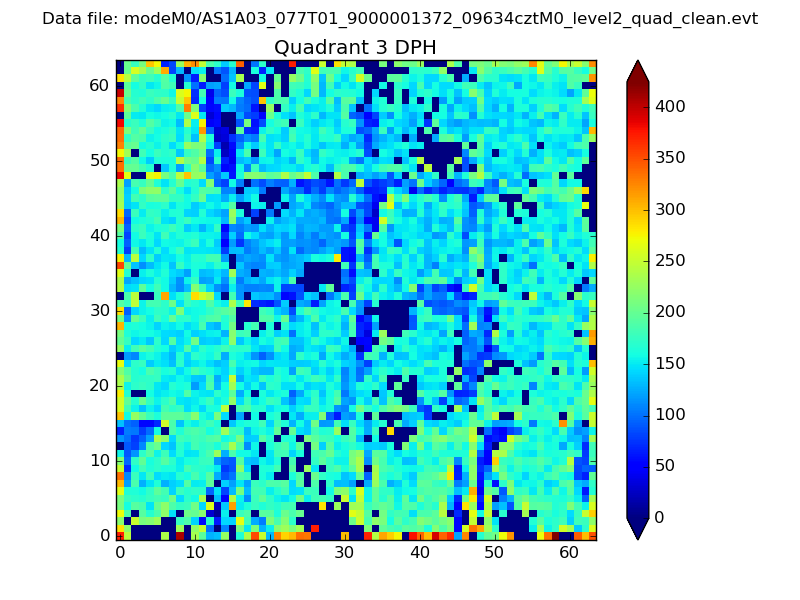 |
 |
Quadrant C |
| Plot type | Count rate plots | Images |
|---|---|---|
| Comparison with Poisson distribution Blue bars denote a histogram of data divided into 1 sec bins. Red curve is a Poisson curve with rate = median count rate of data. |
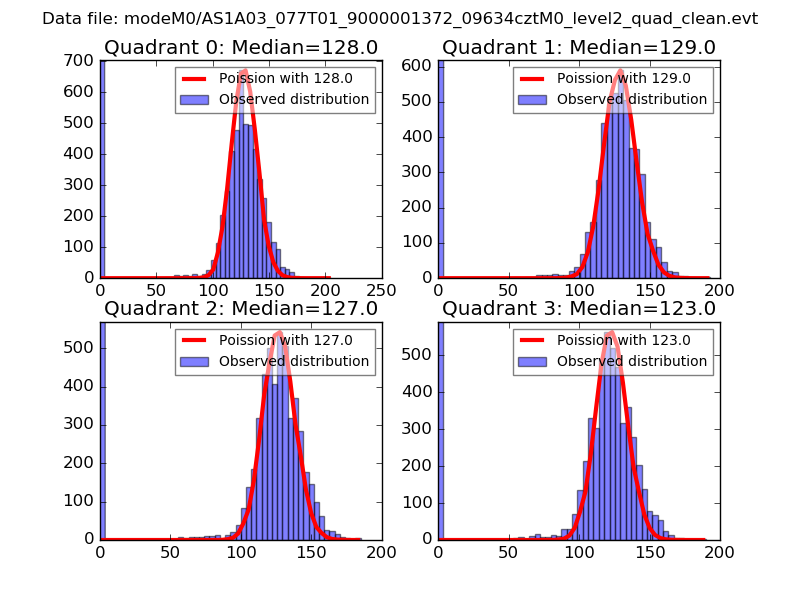 |
 |
| Quadrant-wise count rates Data is divided into 100 sec bins |
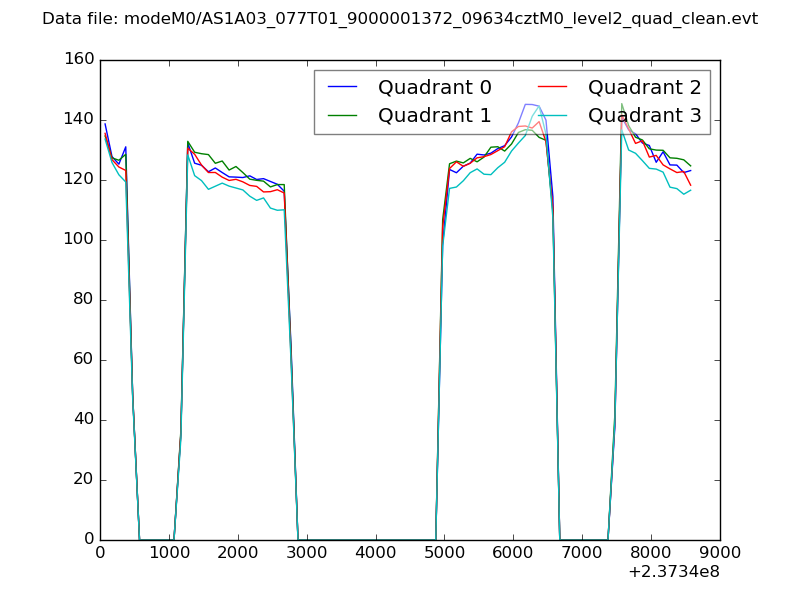 |
|
| Module-wise count rates for Quadrant A Data is divided into 100 sec bins |
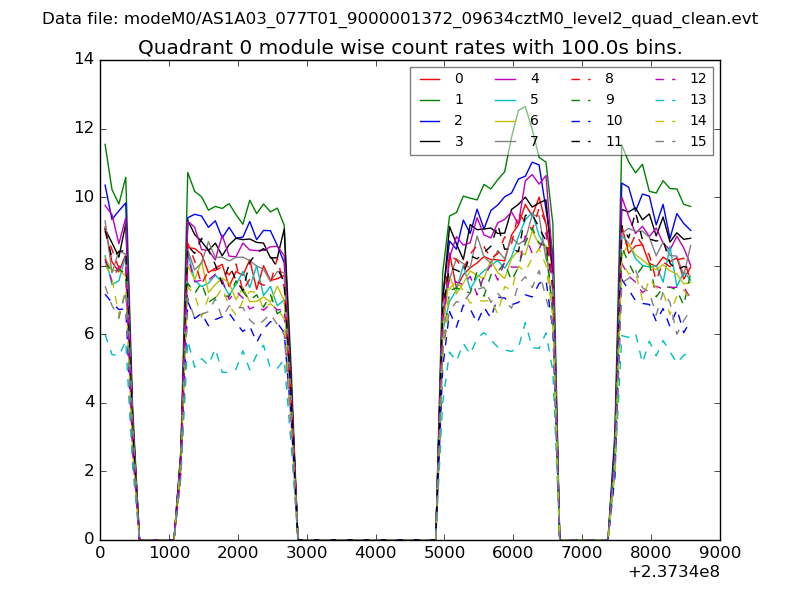 |
 |
| Module-wise count rates for Quadrant B Data is divided into 100 sec bins |
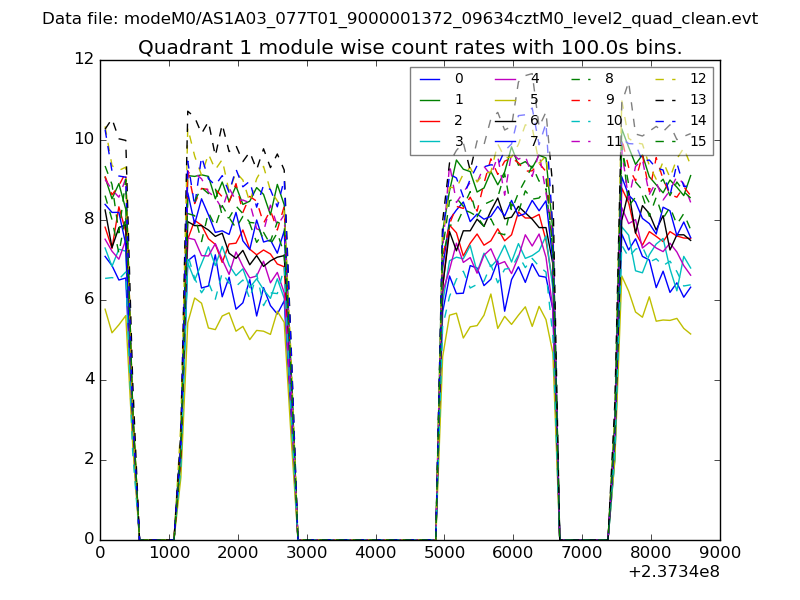 |
 |
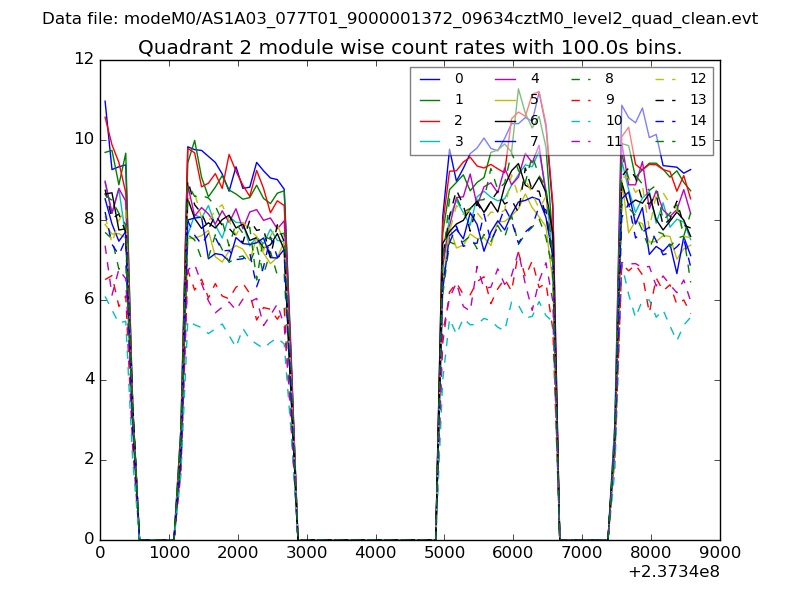
| Module-wise count rates for Quadrant C Data is divided into 100 sec bins |
 |
 |
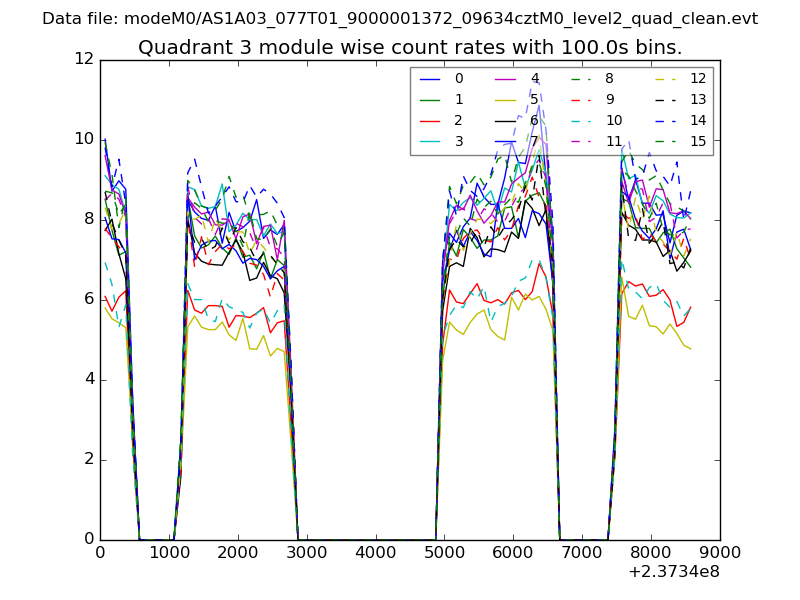
| Module-wise count rates for Quadrant D Data is divided into 100 sec bins |
 |
 |
| Parameter | Plot |
|---|---|
| CZT HV Monitor | 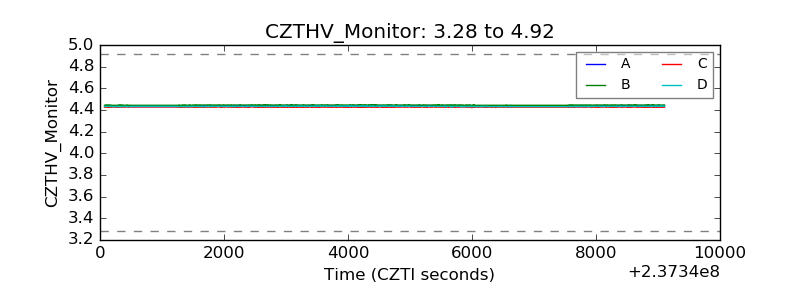 |
| D_VDD | 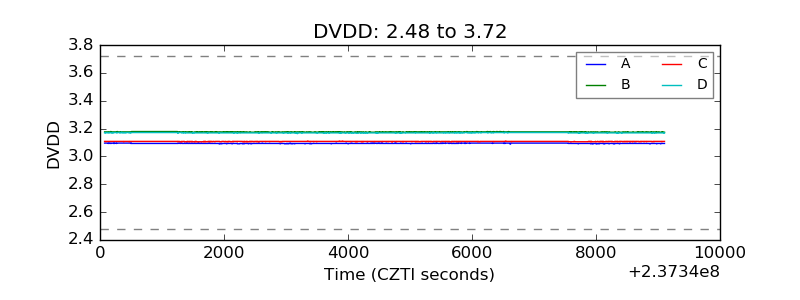 |
| Temperature 1 | 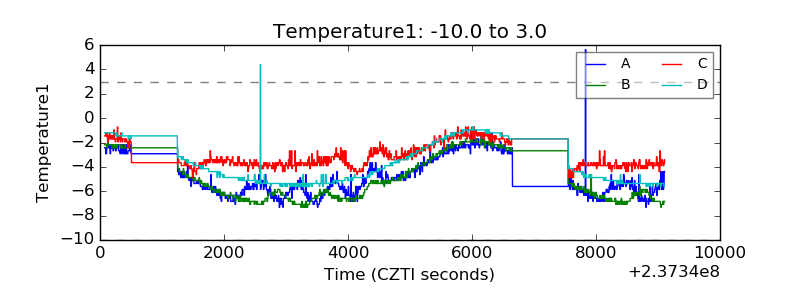 |
| Veto HV Monitor | 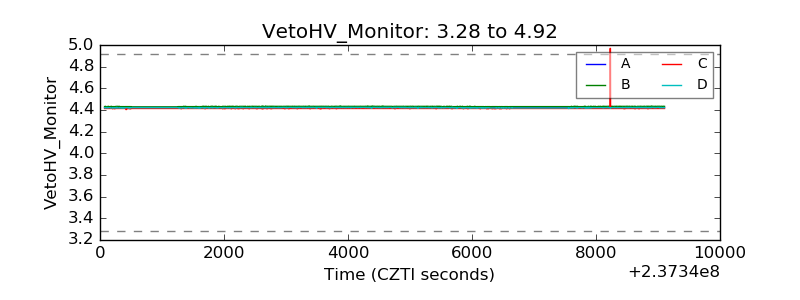 |
| Veto LLD | 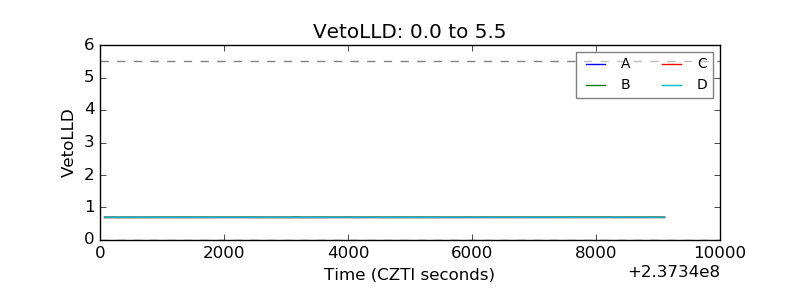 |
| Alpha Counter | 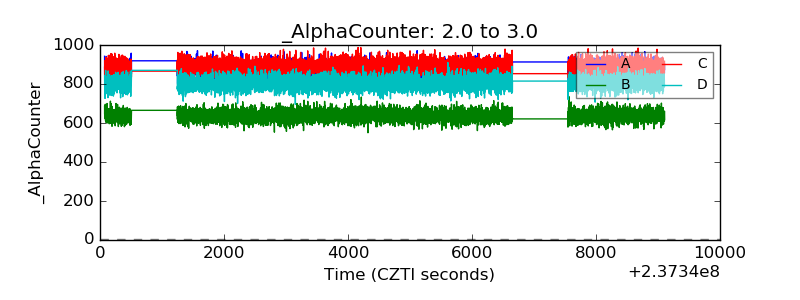 |
| _CPM_Rate | 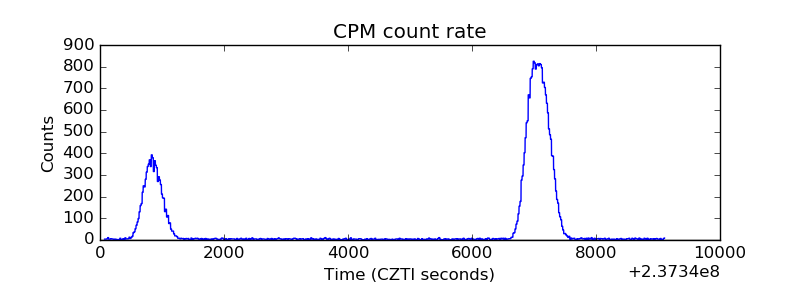 |
| CZT Counter | 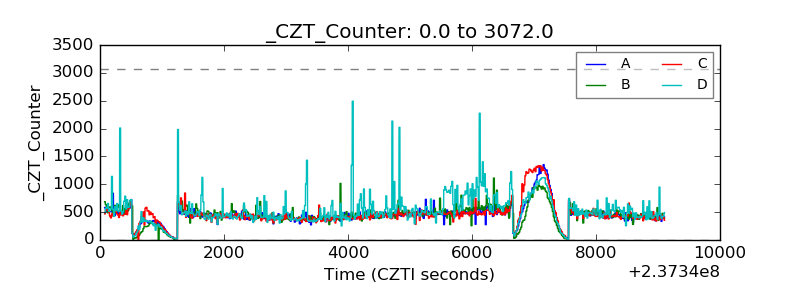 |
| +2.5 Volts monitor |  |
| +5 Volts monitor |  |
| _ROLL_ROT | 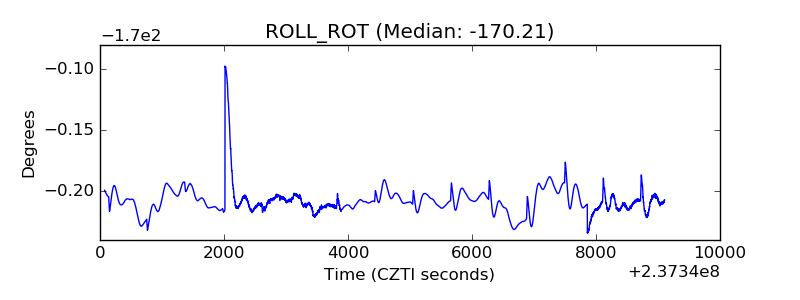 |
| _Roll_DEC | 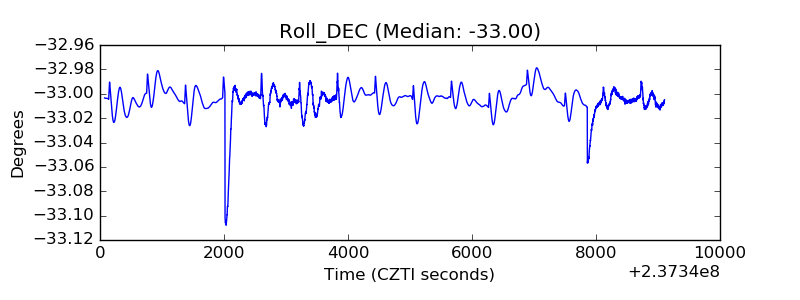 |
| _Roll_RA | 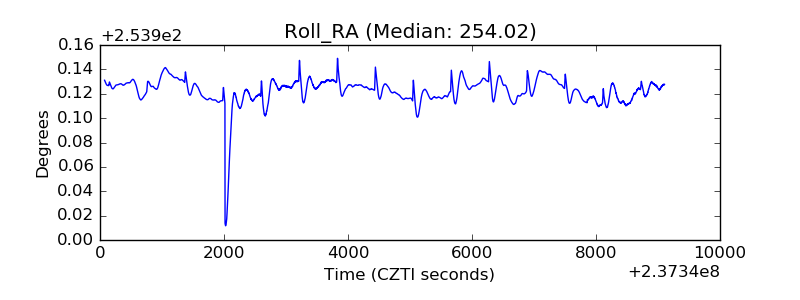 |
| Veto Counter | 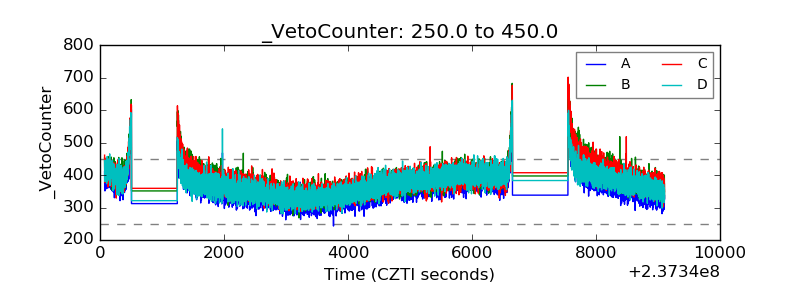 |