| Param | Original file | Final file |
|---|---|---|
| Filename | modeM0/AS1A03_077T01_9000001372_09635cztM0_level2.evt | modeM0/AS1A03_077T01_9000001372_09635cztM0_level2_quad_clean.evt |
| Size (bytes) | 425,551,680 | 76,740,480 |
| Size | 405.8 MB | 73.2 MB |
| Events in quadrant A | 2,933,848 | 473,450 |
| Events in quadrant B | 3,076,357 | 476,783 |
| Events in quadrant C | 2,898,027 | 469,475 |
| Events in quadrant D | 3,539,085 | 452,248 |
| Mode M9 | |||
|---|---|---|---|
| Quadrant | BADHDUFLAG | Total packets | Discarded packets |
| A | 0 | 11 | 0 |
| B | 0 | 11 | 0 |
| C | 0 | 11 | 0 |
| D | 0 | 11 | 0 |
| Mode SS | |||
|---|---|---|---|
| Quadrant | BADHDUFLAG | Total packets | Discarded packets |
| A | 0 | 132 | 0 |
| B | 0 | 132 | 0 |
| C | 0 | 132 | 0 |
| D | 0 | 132 | 0 |
| Mode M0 | |||
|---|---|---|---|
| Quadrant | BADHDUFLAG | Total packets | Discarded packets |
| A | 0 | 13100 | 28 |
| B | 0 | 13323 | 28 |
| C | 0 | 13097 | 17 |
| D | 0 | 14885 | 24 |
| Quadrant | Total seconds | Saturated seconds | Saturation percentage |
|---|---|---|---|
| A | 6470 | 15 | 0.231839% |
| B | 6471 | 26 | 0.401793% |
| C | 6475 | 23 | 0.355212% |
| D | 6477 | 82 | 1.266018% |
Noise dominated data is calculated using 1-second bins in cleaned event files. If a bin has >2000 counts, and if more than 50% of those come from <1% of pixels, then it is considered to be noise-dominated and hence unusable.
| Quadrant | # 1 sec bins | Bins with >0 counts | Bins with >2000 counts | High rate bins dominated by noise | Noise dominated (total time) | Noise dominated (detector-on time) | Marked lightcurve |
|---|---|---|---|---|---|---|---|
| A | 7533 | 6483 | 0 | 0 | 0.00% | 0.00% | 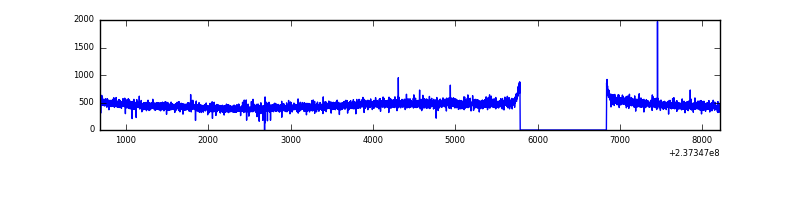 |
| B | 7533 | 6484 | 1 | 1 | 0.01% | 0.02% | 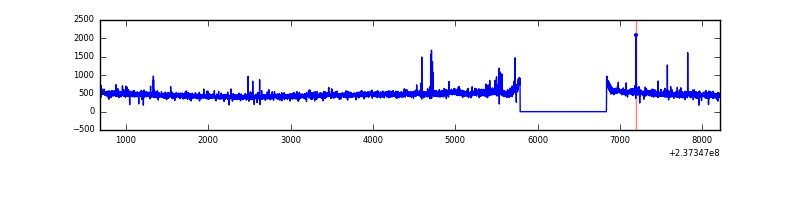 |
| C | 7533 | 6484 | 0 | 0 | 0.00% | 0.00% | 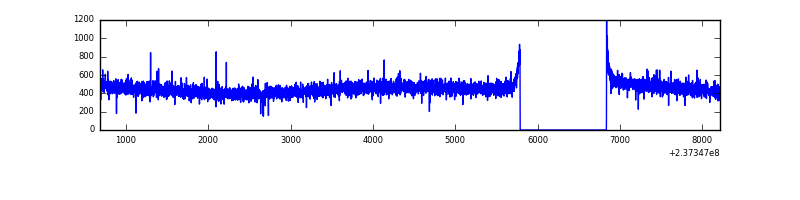 |
| D | 7533 | 6483 | 62 | 62 | 0.82% | 0.96% | 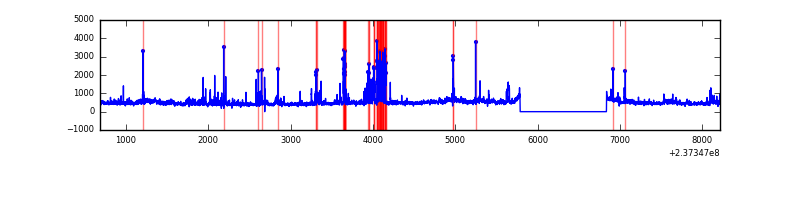 |
Top three noisy pixels from each quadrant. If the there are fewer than three noisy pixels in the level2.evt file, extra rows are filled as -1
| Pixel properties | Quadrant properties | ||||||
|---|---|---|---|---|---|---|---|
| Quadrant | DetID | PixID | Counts | Sigma | Mean | Median | Sigma |
| A | 13 | 253 | 7851 | 45.91 | 761 | 745 | 154.8 |
| A | 0 | 226 | 7041 | 40.68 | 761 | 745 | 154.8 |
| A | 12 | 194 | 6235 | 35.47 | 761 | 745 | 154.8 |
| B | 0 | 214 | 31717 | 208.82 | 768 | 750 | 148.3 |
| B | 0 | 229 | 29968 | 197.03 | 768 | 750 | 148.3 |
| B | 12 | 111 | 16424 | 105.7 | 768 | 750 | 148.3 |
| C | 13 | 61 | 5426 | 27.21 | 741 | 744 | 172.1 |
| C | 12 | 4 | 3551 | 16.31 | 741 | 744 | 172.1 |
| C | 14 | 234 | 2126 | 8.03 | 741 | 744 | 172.1 |
| D | 1 | 52 | 208350 | 1181.08 | 729 | 713 | 175.8 |
| D | 8 | 195 | 141635 | 801.59 | 729 | 713 | 175.8 |
| D | 12 | 233 | 104563 | 590.72 | 729 | 713 | 175.8 |
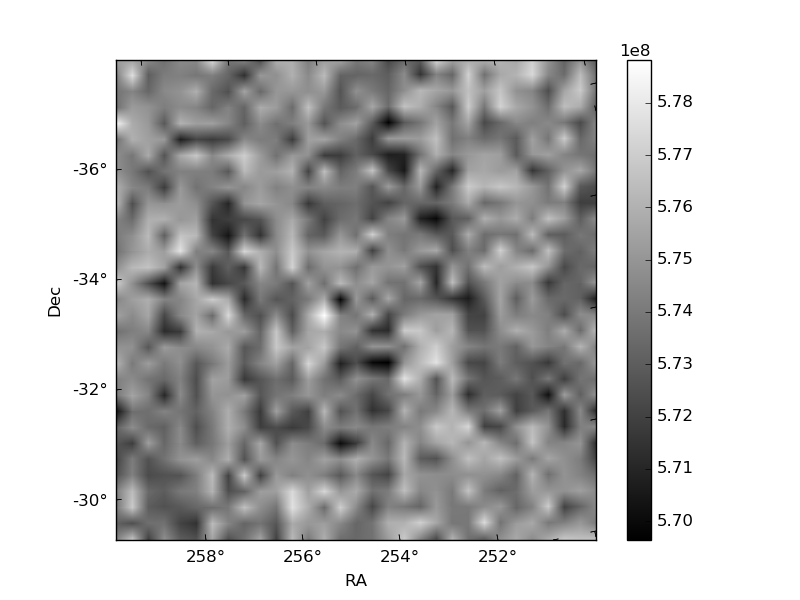
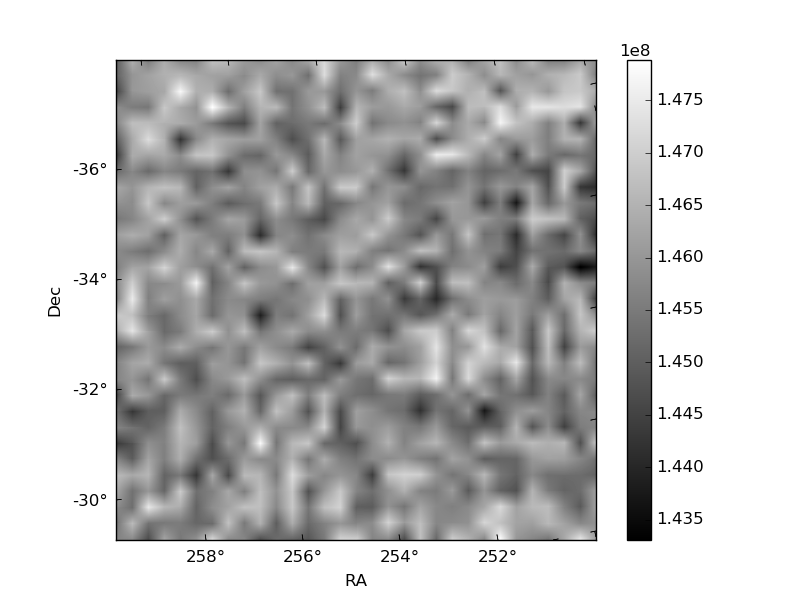
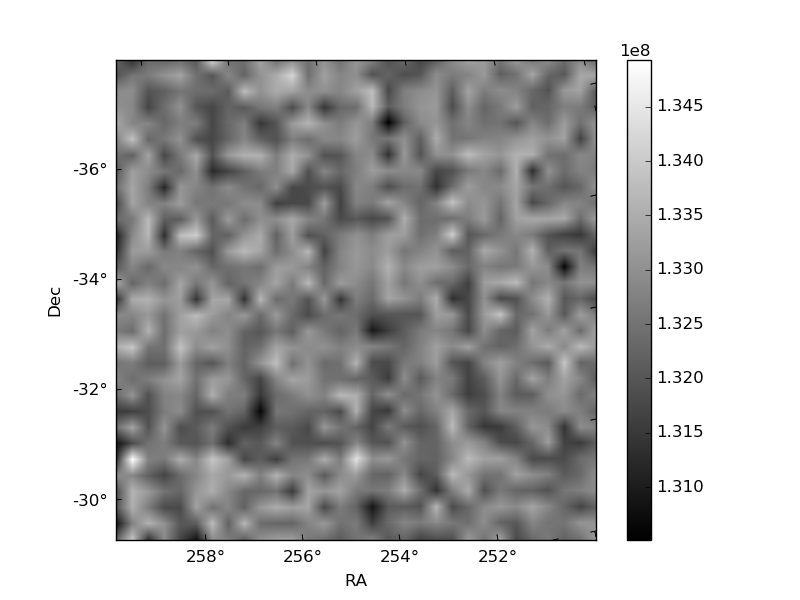
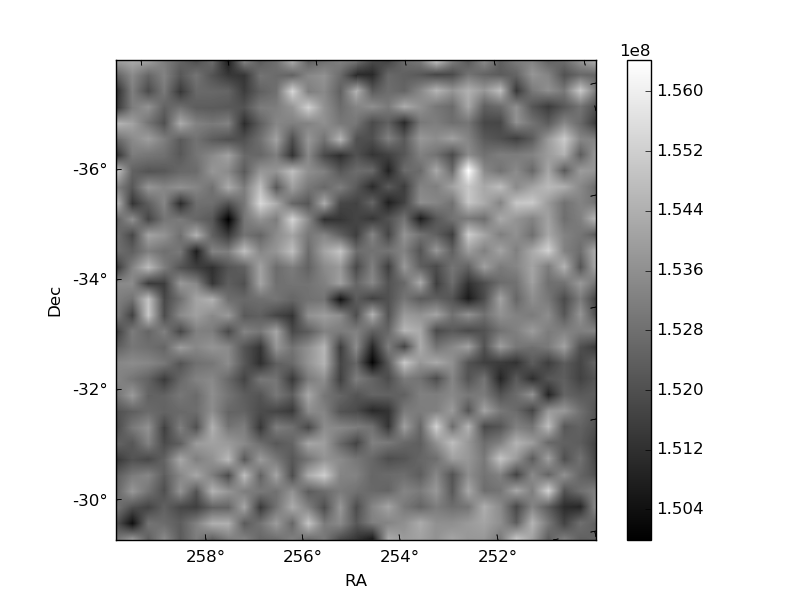
Histogram calculated using DETX and DETY for each event in the final _common_clean file
| Quadrant A | 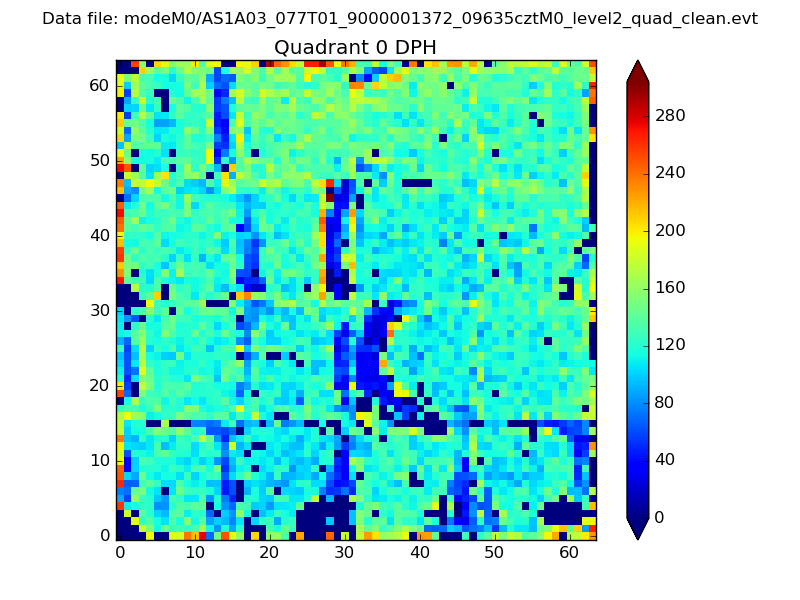 |
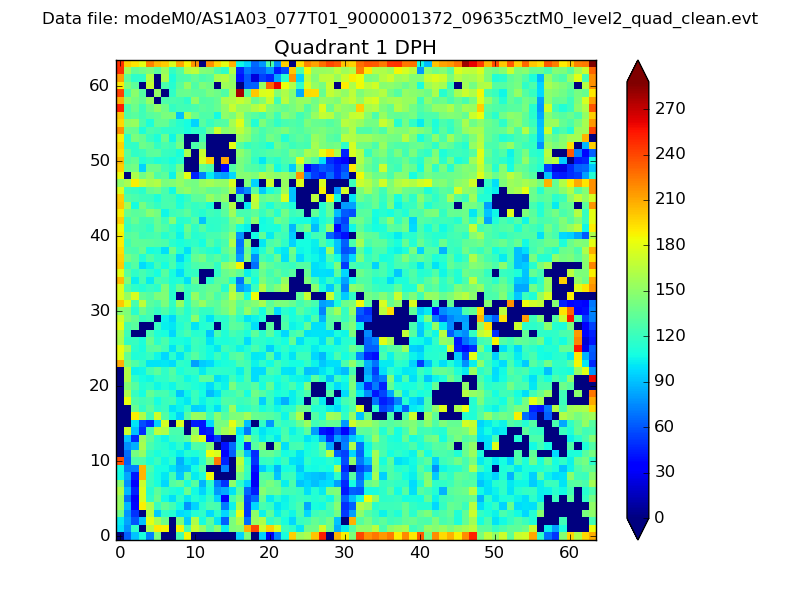 |
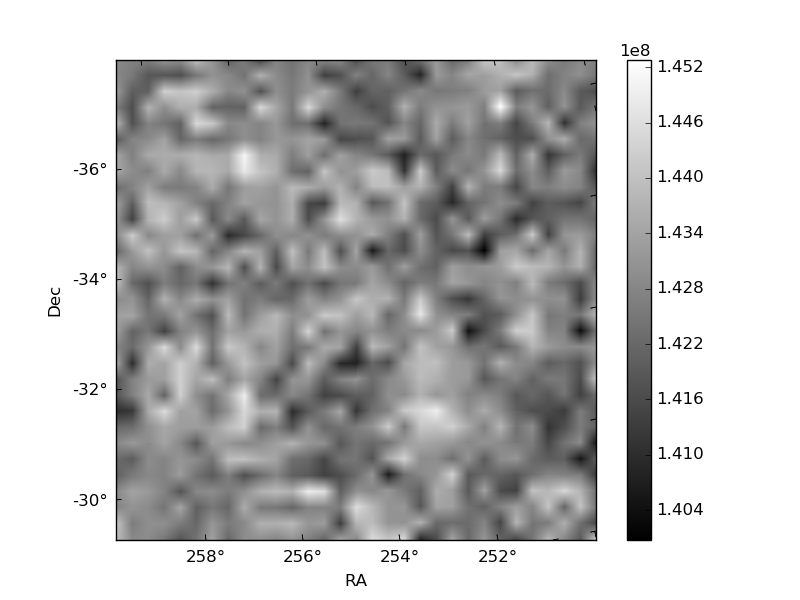
Quadrant B |
|---|---|---|---|
| Quadrant D | 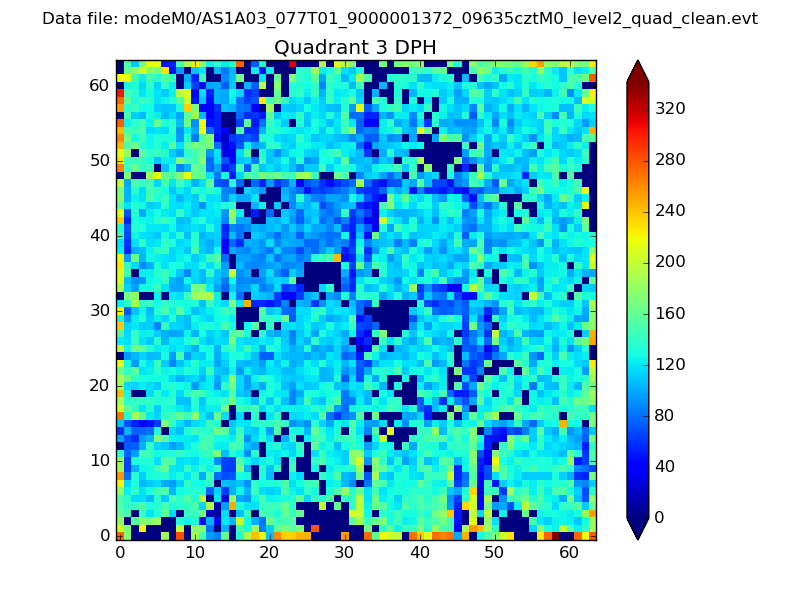 |
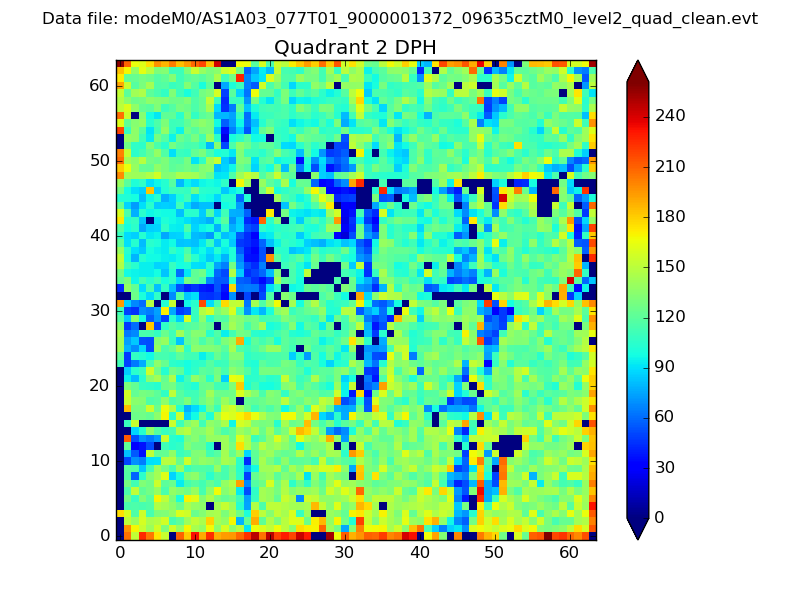 |
Quadrant C |
| Plot type | Count rate plots | Images |
|---|---|---|
| Comparison with Poisson distribution Blue bars denote a histogram of data divided into 1 sec bins. Red curve is a Poisson curve with rate = median count rate of data. |
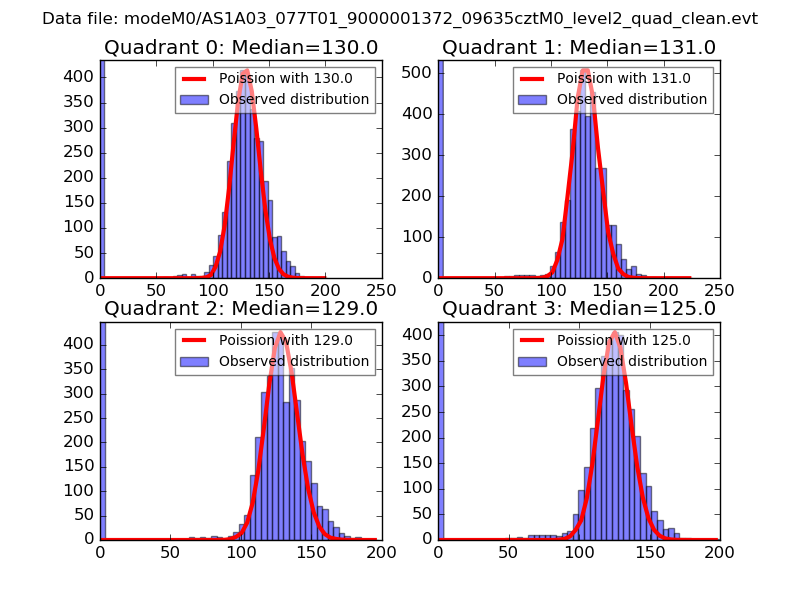 |
 |
| Quadrant-wise count rates Data is divided into 100 sec bins |
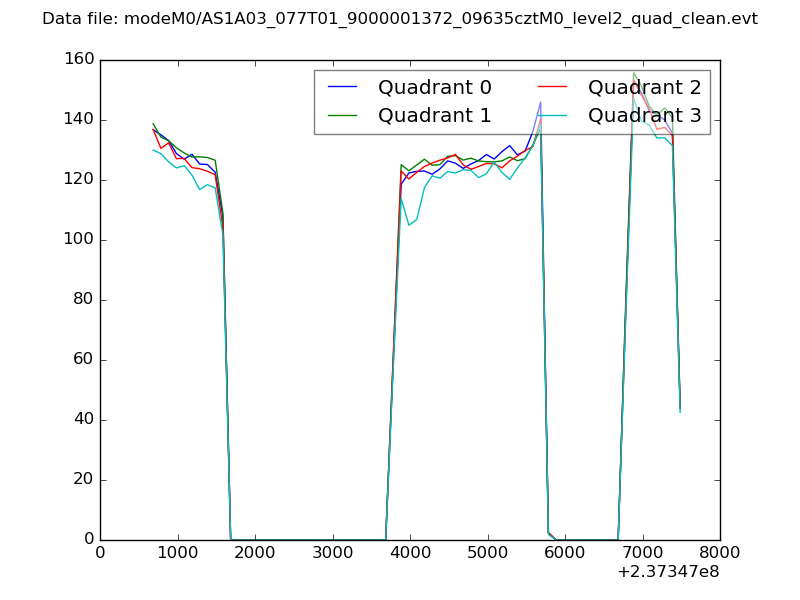 |
|
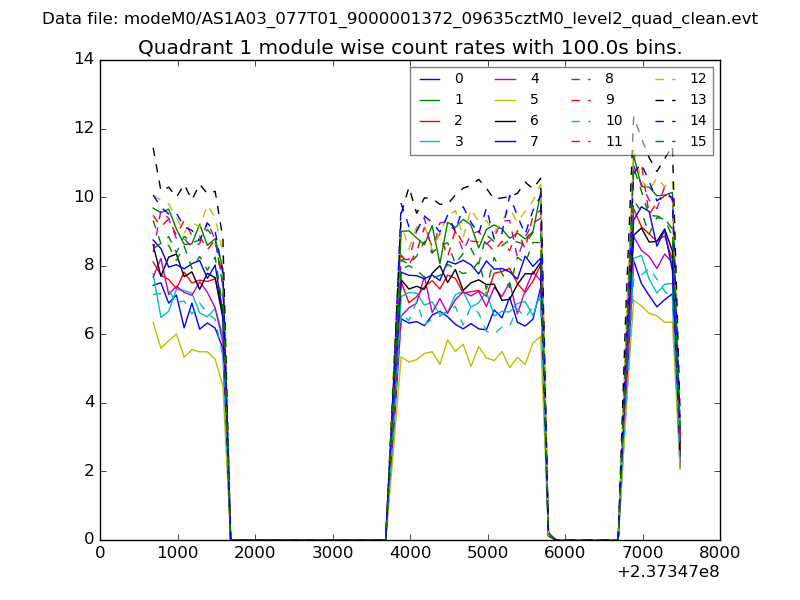
| Module-wise count rates for Quadrant A Data is divided into 100 sec bins |
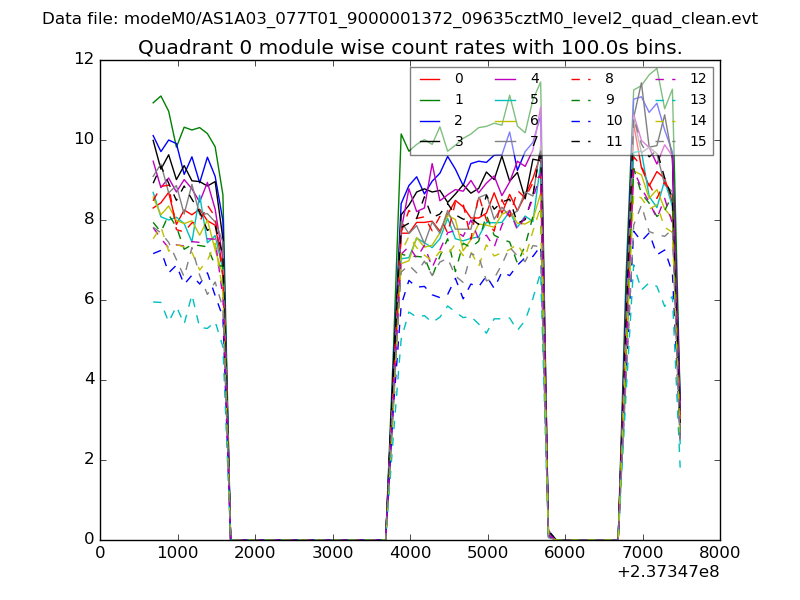 |
 |
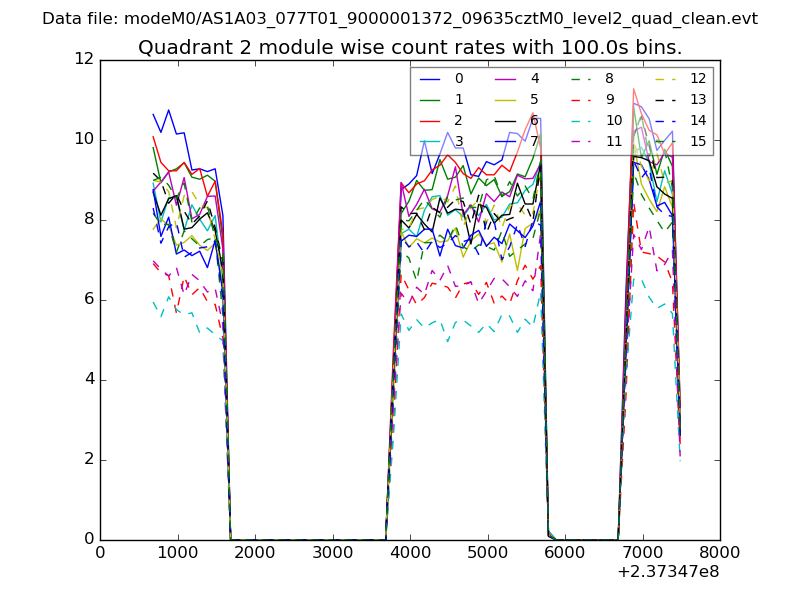
| Module-wise count rates for Quadrant B Data is divided into 100 sec bins |
 |
 |
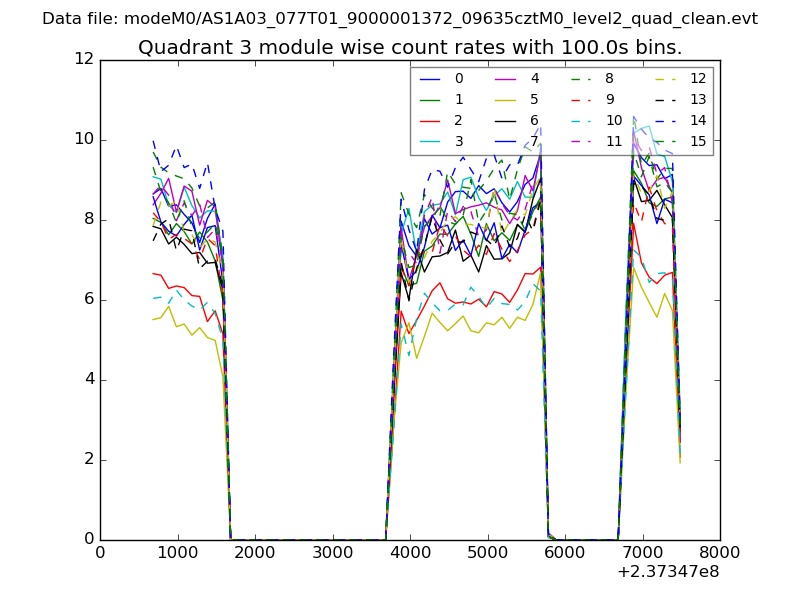
| Module-wise count rates for Quadrant C Data is divided into 100 sec bins |
 |
 |
| Module-wise count rates for Quadrant D Data is divided into 100 sec bins |
 |
 |
| Parameter | Plot |
|---|---|
| CZT HV Monitor | 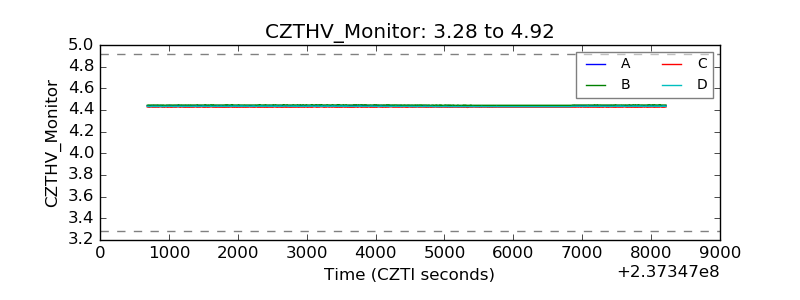 |
| D_VDD | 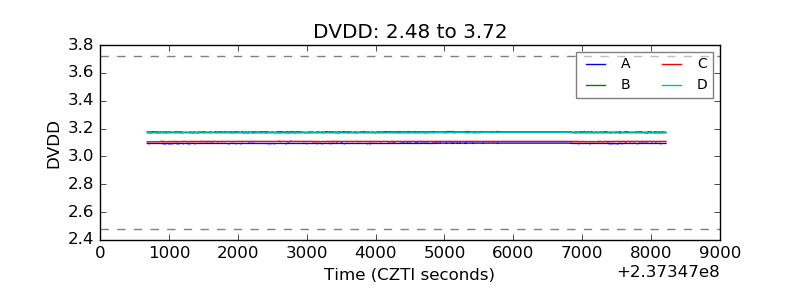 |
| Temperature 1 | 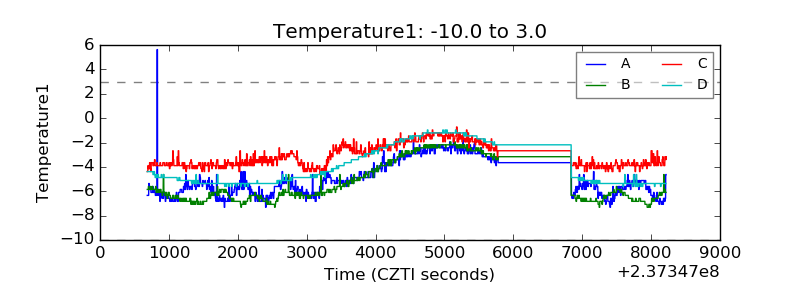 |
| Veto HV Monitor | 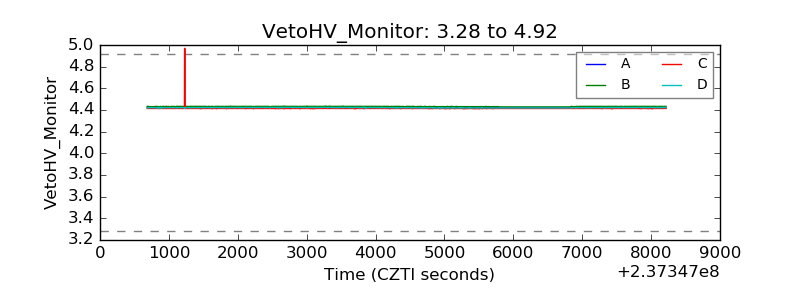 |
| Veto LLD | 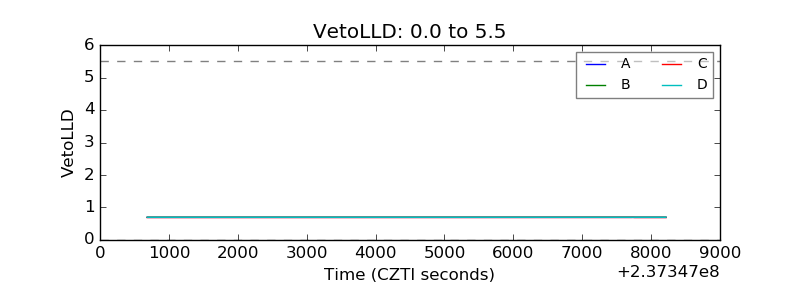 |
| Alpha Counter | 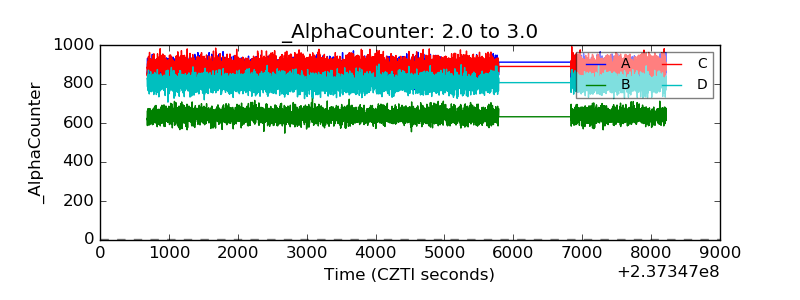 |
| _CPM_Rate | 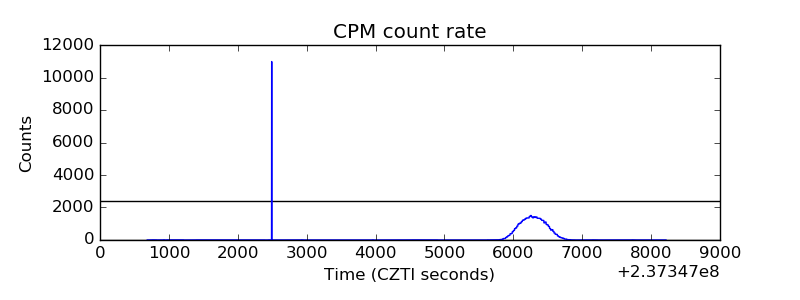 |
| CZT Counter | 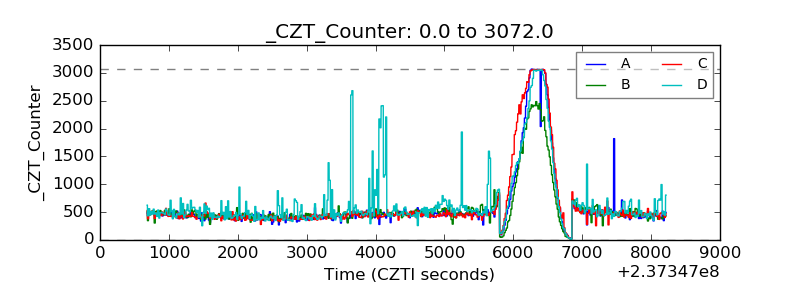 |
| +2.5 Volts monitor |  |
| +5 Volts monitor |  |
| _ROLL_ROT | 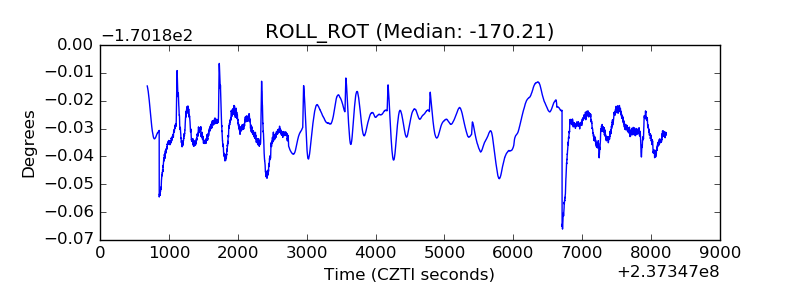 |
| _Roll_DEC | 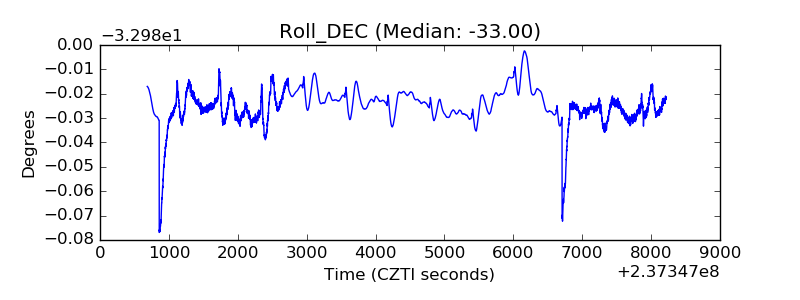 |
| _Roll_RA | 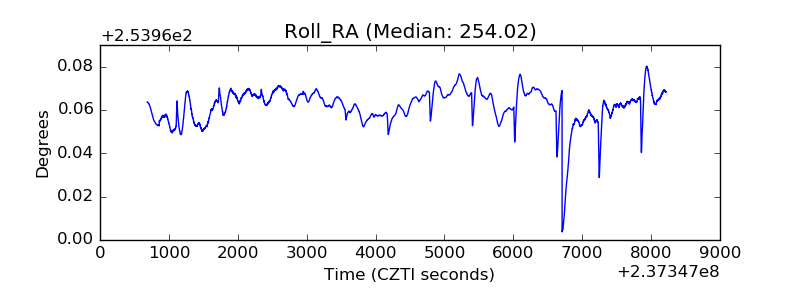 |
| Veto Counter | 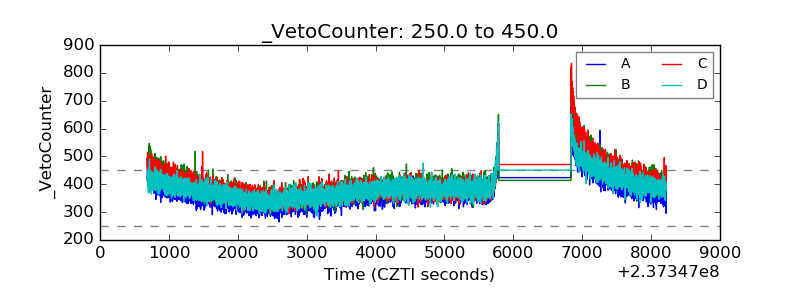 |